 The Gulf of Mexico Crater is one of the larger, and most thoroughly studied portion of geology in the North American Continent. As a major source of hydrocarbons, there has been much discussion of how it was formed, and how all of the petroleum products got there. At the other end of the size scale, the Turner Gulch crater forms a part of the surface of the Uncompahgre Plateau of Colorado and Utah. While the Gulf of Mexico crater tells about conditions when cratering started, the Turner Gulch tells about conditions when cratering ended.
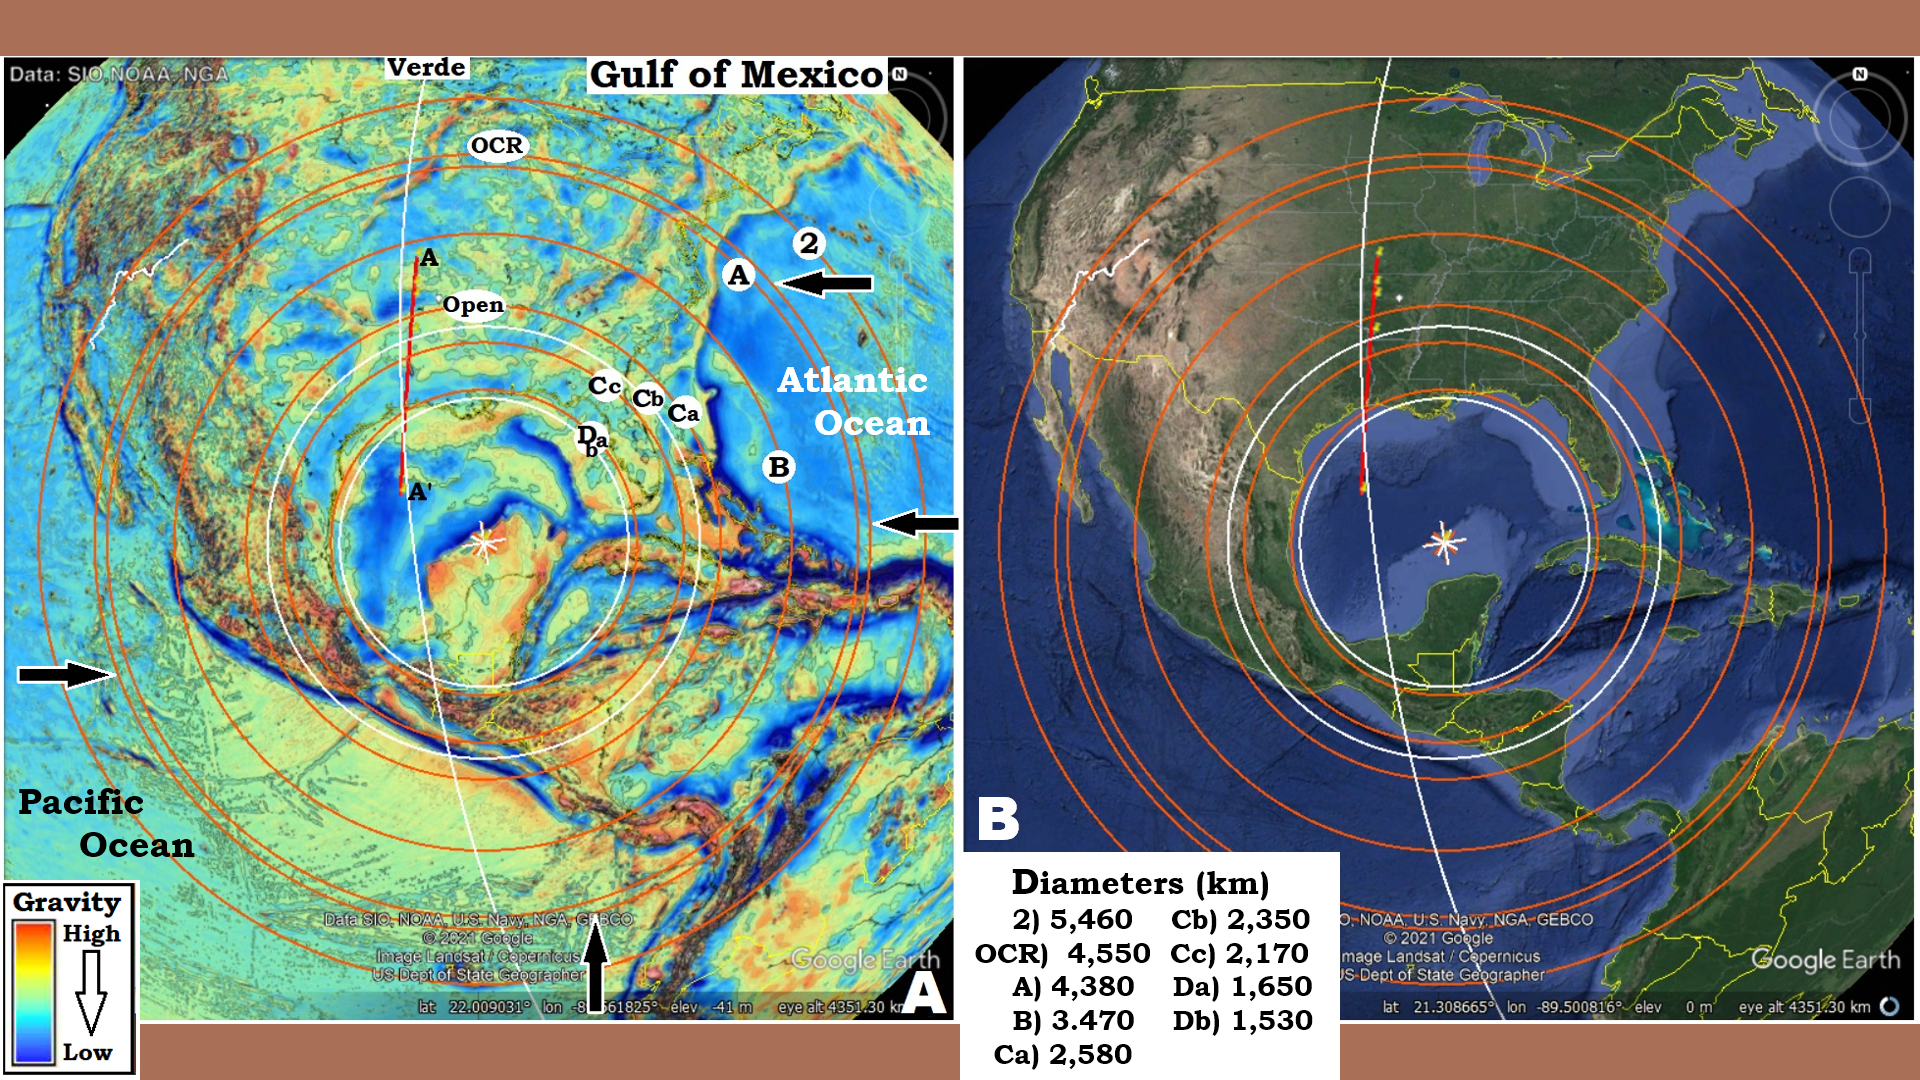 Figure 1: Trying to find the dimensions of the Gulf of Mexico crater was a bit of a challenge, because the gulf itself seems such a logical choice. It is reasonably round, and at over 1,500 km/930 miles in diameter it would be a fairly large crater by earth’s standards. But, when I located the image of the Sabine Block, Figure 2, in the position A-A’, reaching past the Open Ring (Cc) I figured that Cc-ring must be the crater rim. However, when looking at the Global Gravity Anomaly Map from Scripps (2014) the portion of the Original Crater Rim (OCR)-ring between the two pairs of black arrows became obvious. In the Atlantic Ocean a very distinct darker blue ring, low density ring, fills between A-ring and B-ring. Immediately under A and B-rings themselves are a higher density ridge shown by the lighter blue. In the Pacific Ocean between A-and B-rings is a broken blue gravity pattern, but it is lower gravity than the much more yellow B-ring. And it can be seen that the A and B-rings define much of the yellow arced area that extends south from Mexico. The Gulf of Mexico crater provides a reason for the distinctly denser gravity pattern over this area of the ocean’s floor. White arc overlaying the red line (A-A’, line of Sabine Block section) identifies a Concentric Global Ring Structure (CGRS) centered in the Verde crater in the eastern Atlantic Ocean, near northern Africa, that I believe defines the physical shape and location of the Sabine Block, Figure 13.
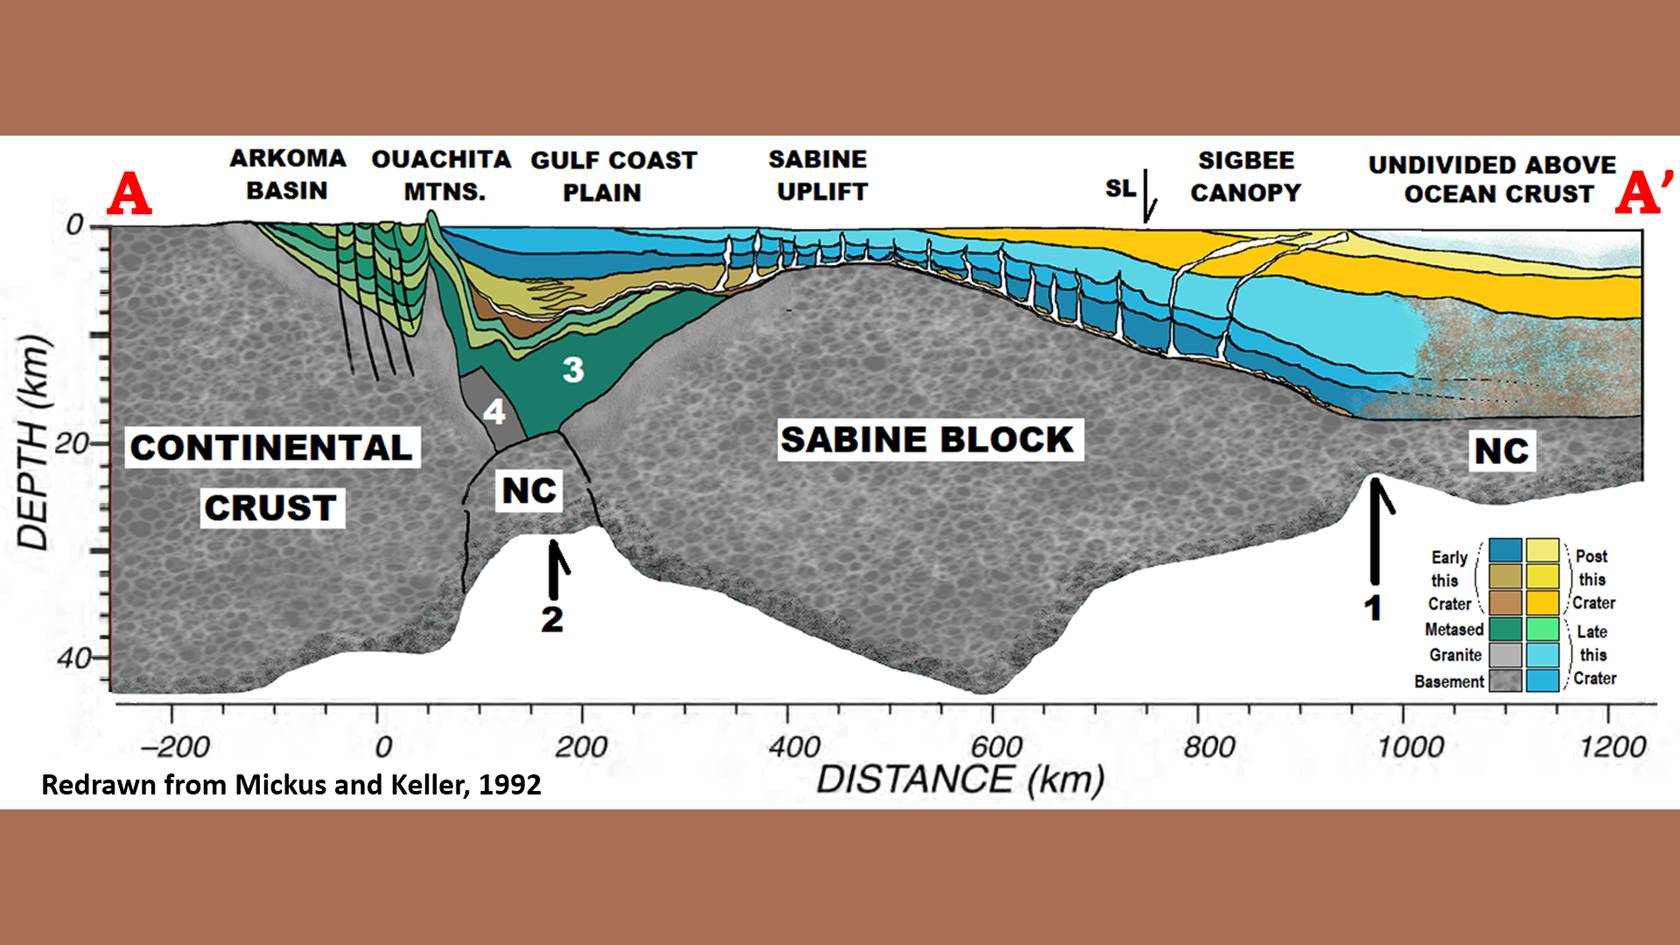 Figure 2: Cross section of the Sabine Block roughly down the border between Texas and Louisiana (A-A’ Figure 1) that encouraged me to see the Gulf of Mexico rings further to the north. Then plotting it on gravity map allowed me to see the larger context of the entire North American Continent. The Sabine Block is a chunk of continental crust that has been broken off. If the gray peak of granite (gneissic) core under the Ouachita Mountains and block-4 had arrived later, visually the Sabine Block might have directly fractured off the continental crust and floated south on the more viscous mantle surface. But, what could have broken a 40 km thick by 800 km long block of rock loose? It had to happen before any significant amount of the sediments were deposited. Did the Gulf of Mexico crater produce a ring-fault that split it off? The division does not continue around towards Texas. In fact, a sharp split occurs below the Texas Salt Basin, which is assumed to be part of the Grenville Orogeny for the Plate Tectonics Model forming Earth’s geomorphology (See pdf: GoM-1-Grenville Orogeny never happened). Although there are some ridges and gullies descending along the gulf coast of Texas, there is not another loose block near this size.
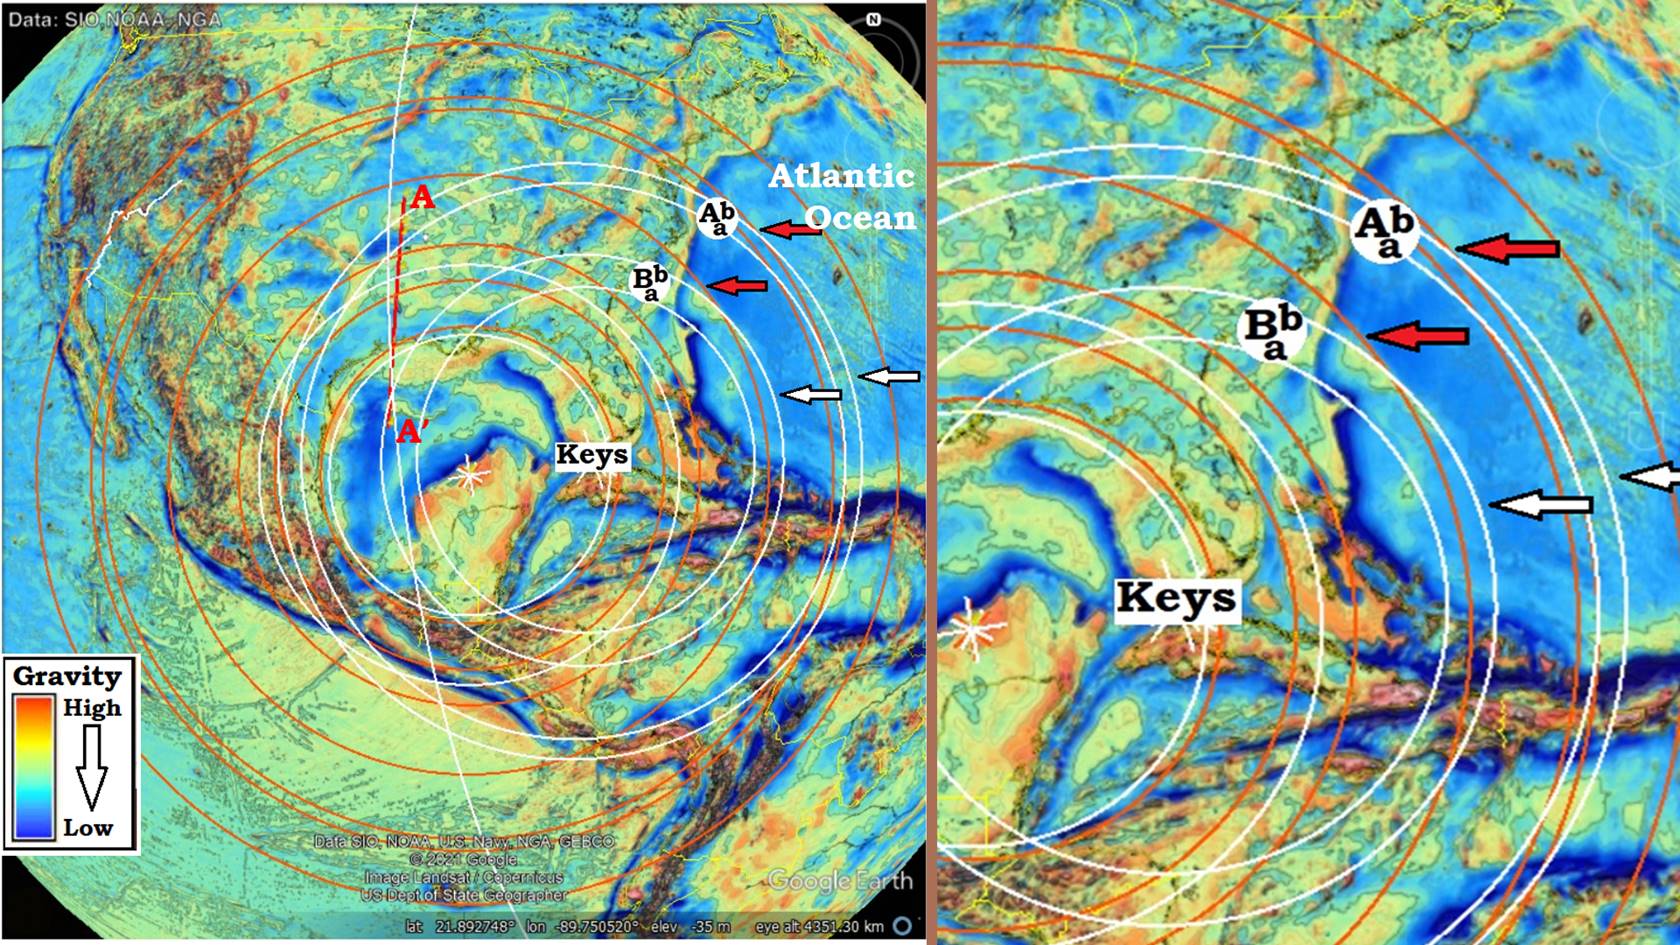 Figure 3: Additionally, the geology of Florida is not like the rest of the bordering gulf structure. The cratering process did not shear it off in a slope, but instead seems to have left it as a block. The overlapping of the Bermuda crater (see slideshow: The large craters that formed North America) could account for some of the differences, but after searching, an additional earlier crater was located, This earlier crater, the Keys crater, left heat in the substrate that changed the way the later Gulf of Mexico shaped the crater edges in this area. Recognizing the Keys crater requires careful separation of the clues. In the Atlantic Ocean the red arrows point to slightly greater density rings of the Gulf of Mexico crater, while the white arrows show slight deviations of higher gravity that comes from the Keys crater. Compare the same area in Figure 1 to see the deviation when not obscured with circles.
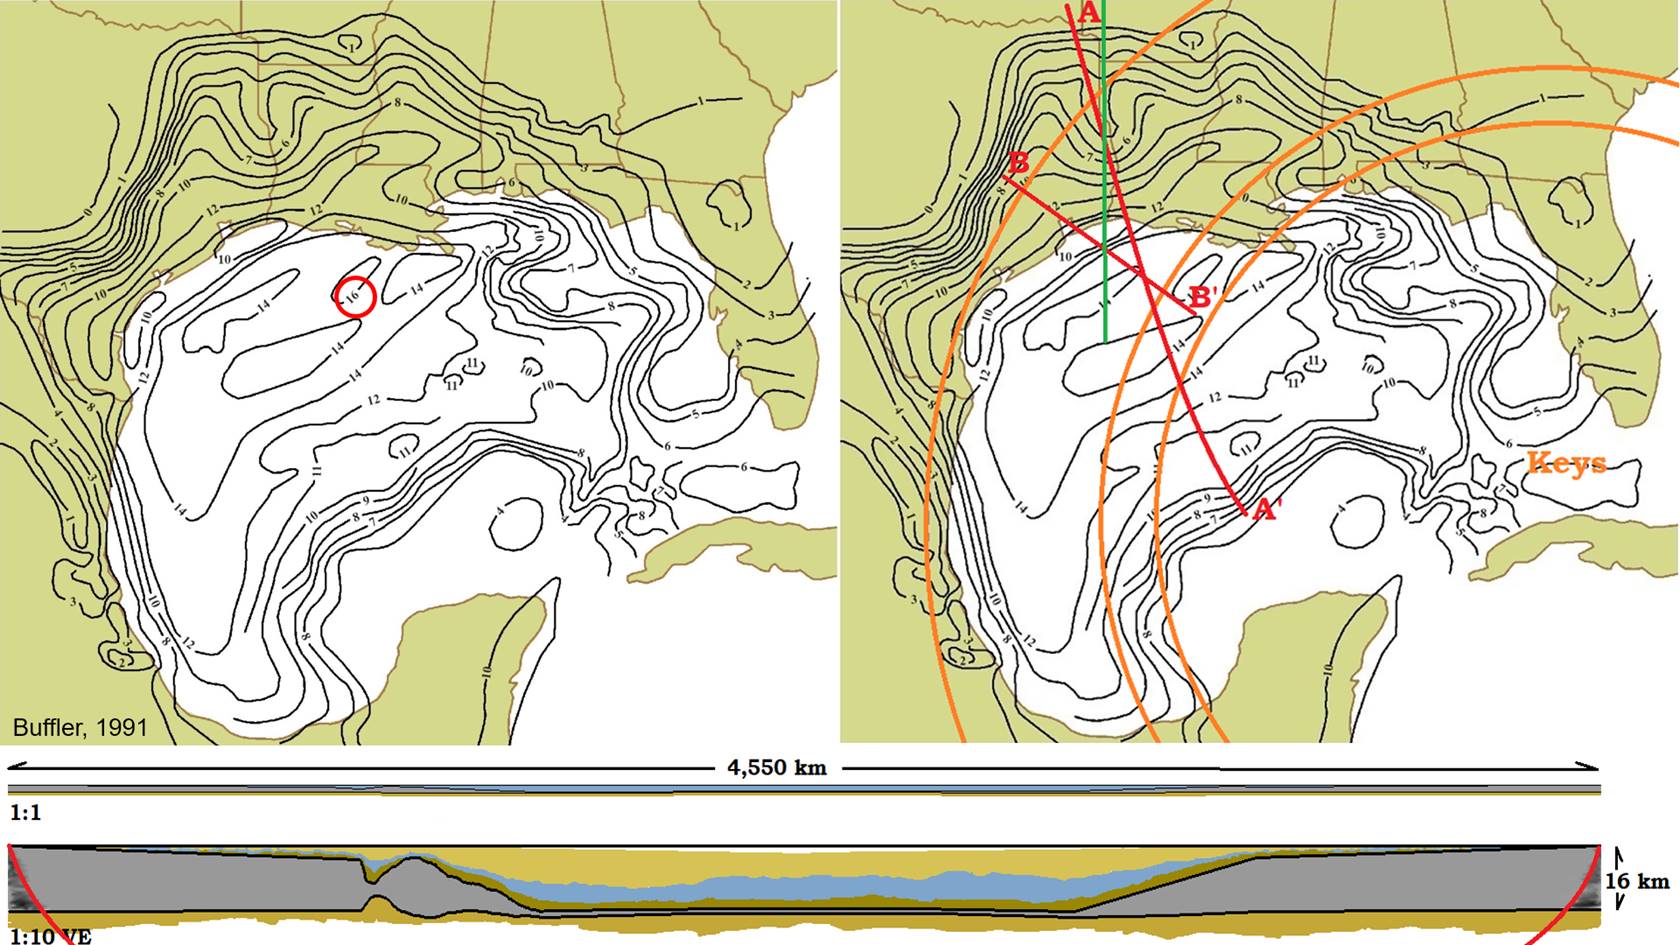 Figure 4: Looking at the surface of the basement as determined by welling drillings, Buffler produced a topography map of the bottom of the excavated bowl of the Gulf of Mexico. The lowest depth (~16 km/10 mi) is part of the release-wave ring of the Keys crater. The Green linear is where the cross section of the Sabine Block was measured, but I propose the raised linear under the red arc (A-A’) suggest the actual structure might be an arc formed by a CGRS from the Verde crater (Figure 1). The outer red ring/annulus from the Keys may be responsible for splitting the Sabine Block off on its west side from the main Continental crust (Figure 13). Combining the 4,550 km/2,830 mi diameter with the 16 km/10 mi depth and basin shape of the bowl is shown at 1:1 ratio in a generalized original section, and with a vertical exaggeration of 10 times to accentuate the bowl shape. This is not the crater shape most people would expect from cratering models often offered. The model by Shoemaker (1974) (Chapter 8) and still used by NASA, based on an subsurface nuclear explosion, suggest they need to examine more actual craters. Which is the point of this slideshow.
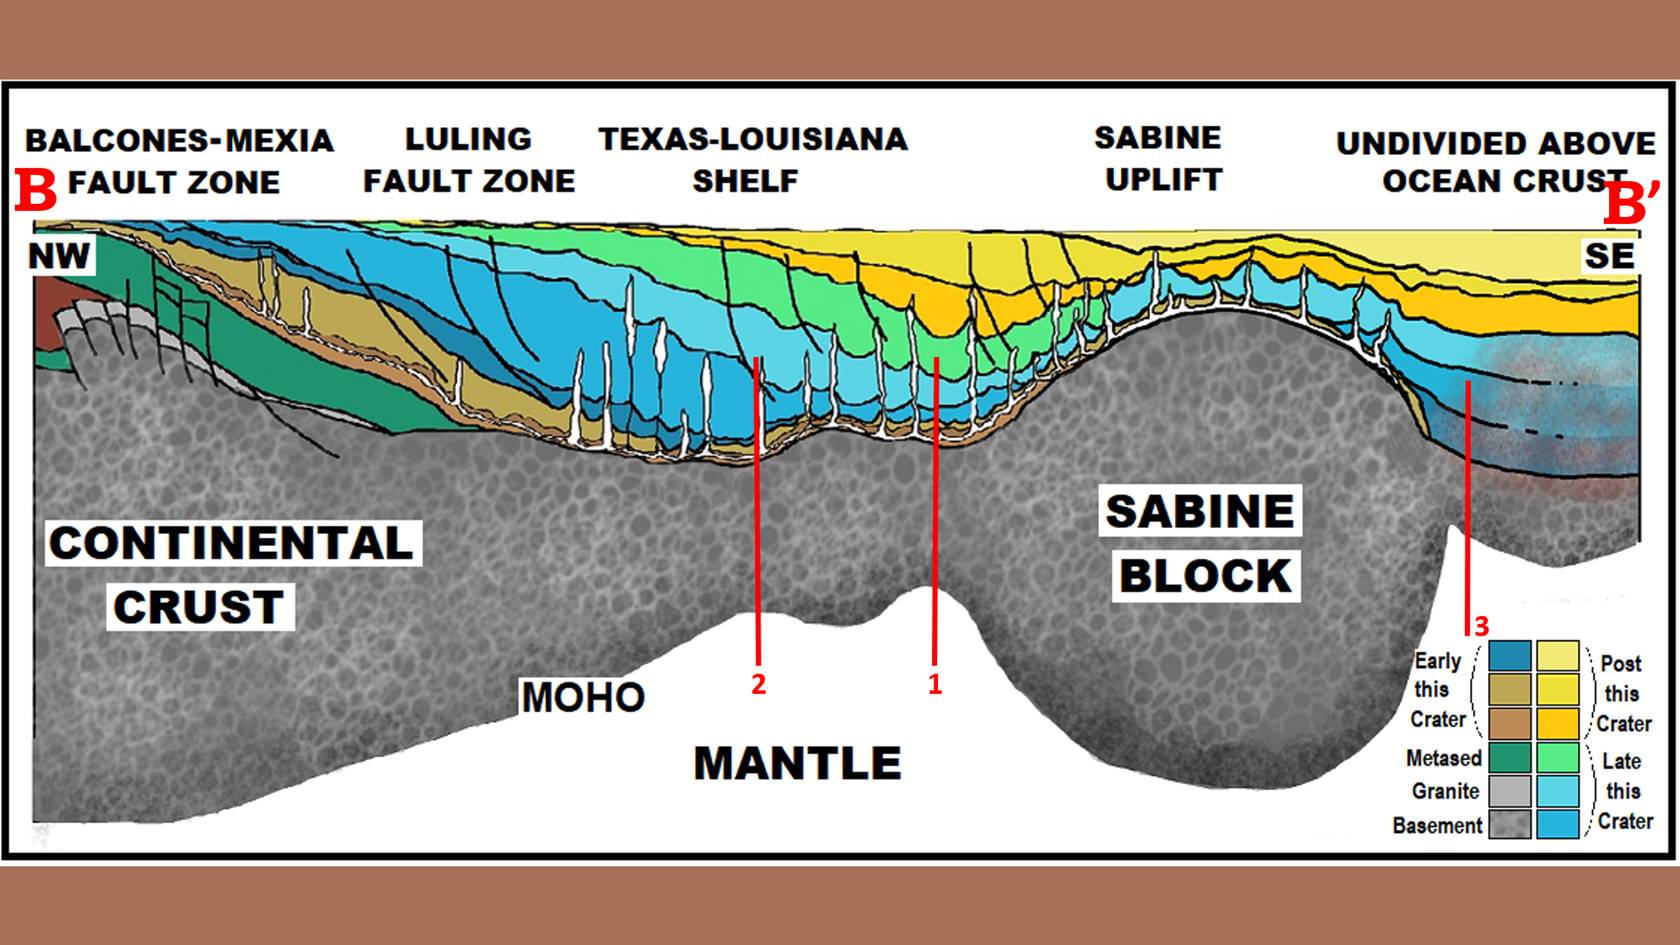 Figure 5: A section from Mid Texas into the Gulf across the Sabine Block. (Linear B-B’, Figure 4). Red linears 1-3 show possible locations of faulting from the Keys crater that might have split the blocks loose at multiple locations. Or they may represent multiple fracturing events from multiple other craters. One section does not give us enough information to differentiate between choices.
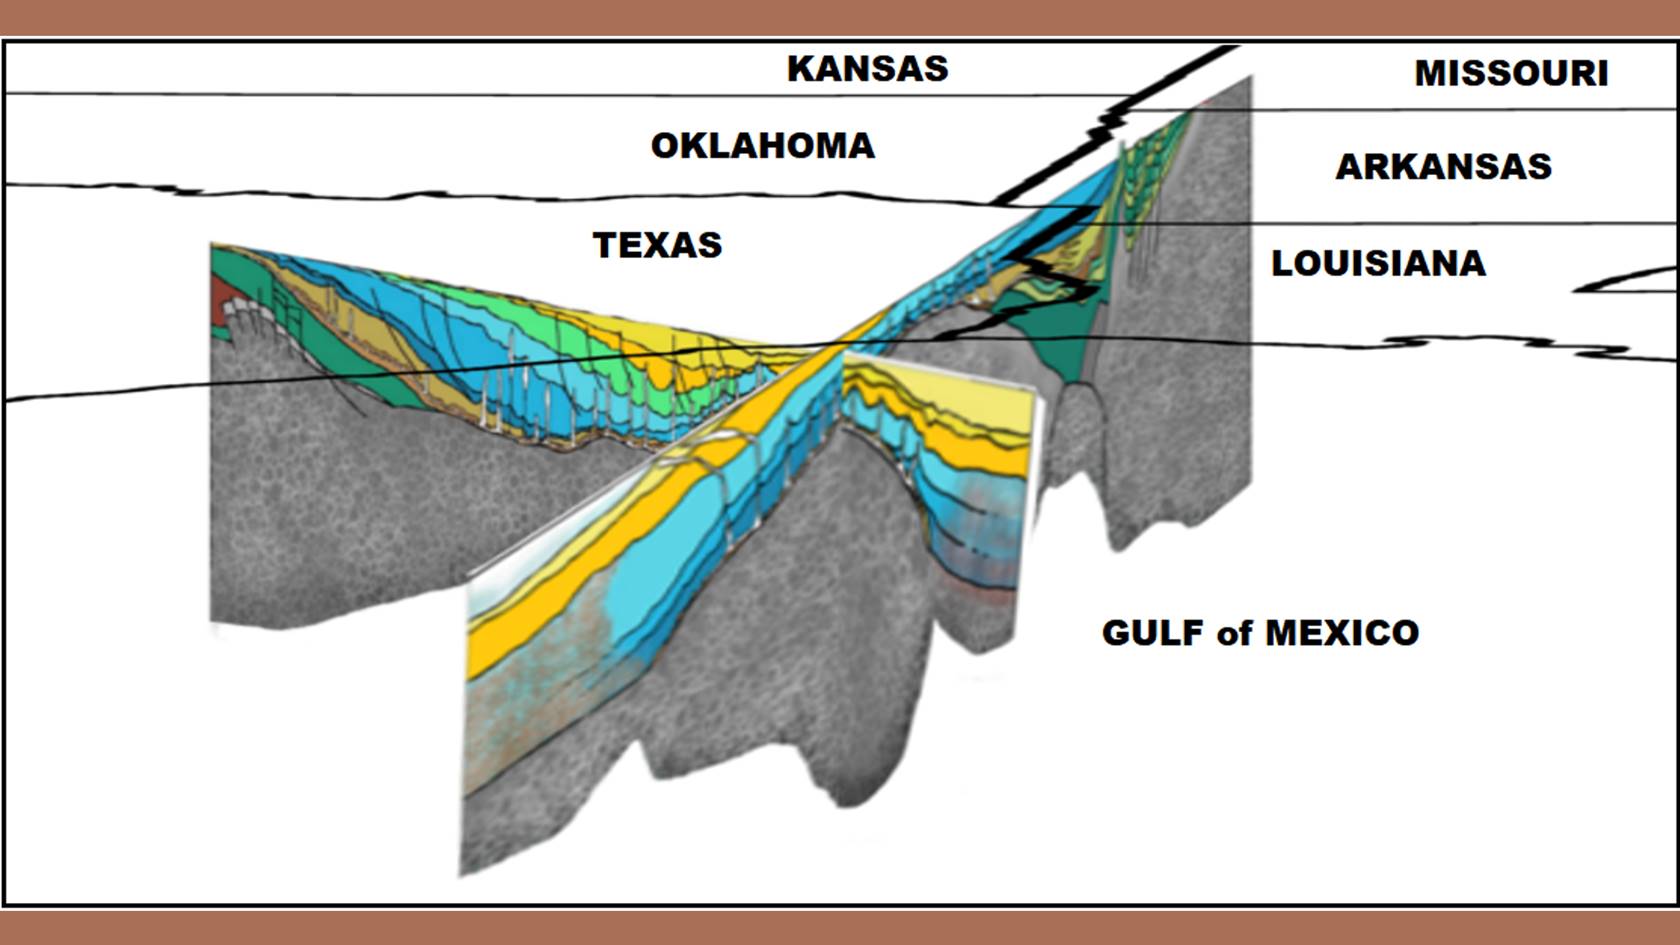 Figure 6: When both Figures 2 and 5 are combined obliquely, we get more of an idea of the actual shape of the Sabine Block in the edge of the Gulf of Mexico cratering bowl.
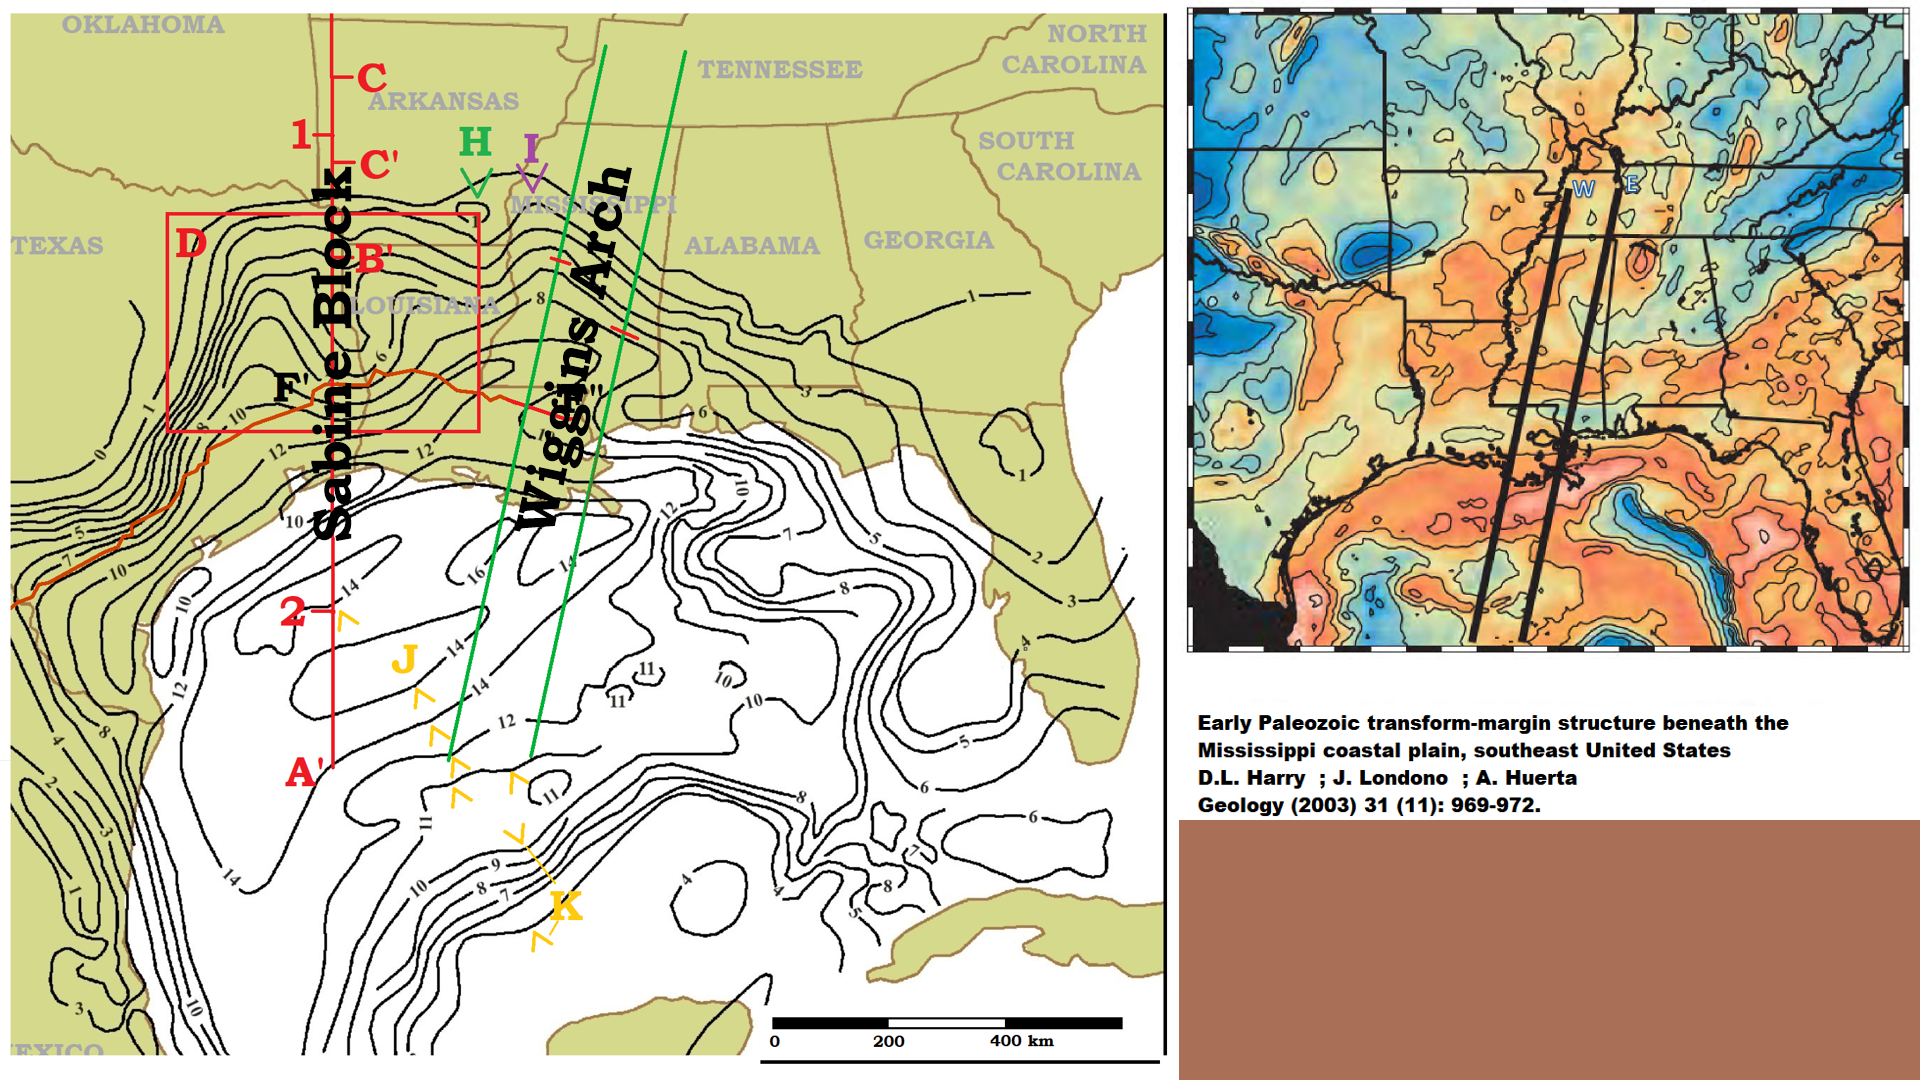 Figure 7: But, the Sabine Block is not a total peninsula sticking out into the gulf. It is attached to the Wiggins Arch structure extending across Mississippi and possibly Alabama.
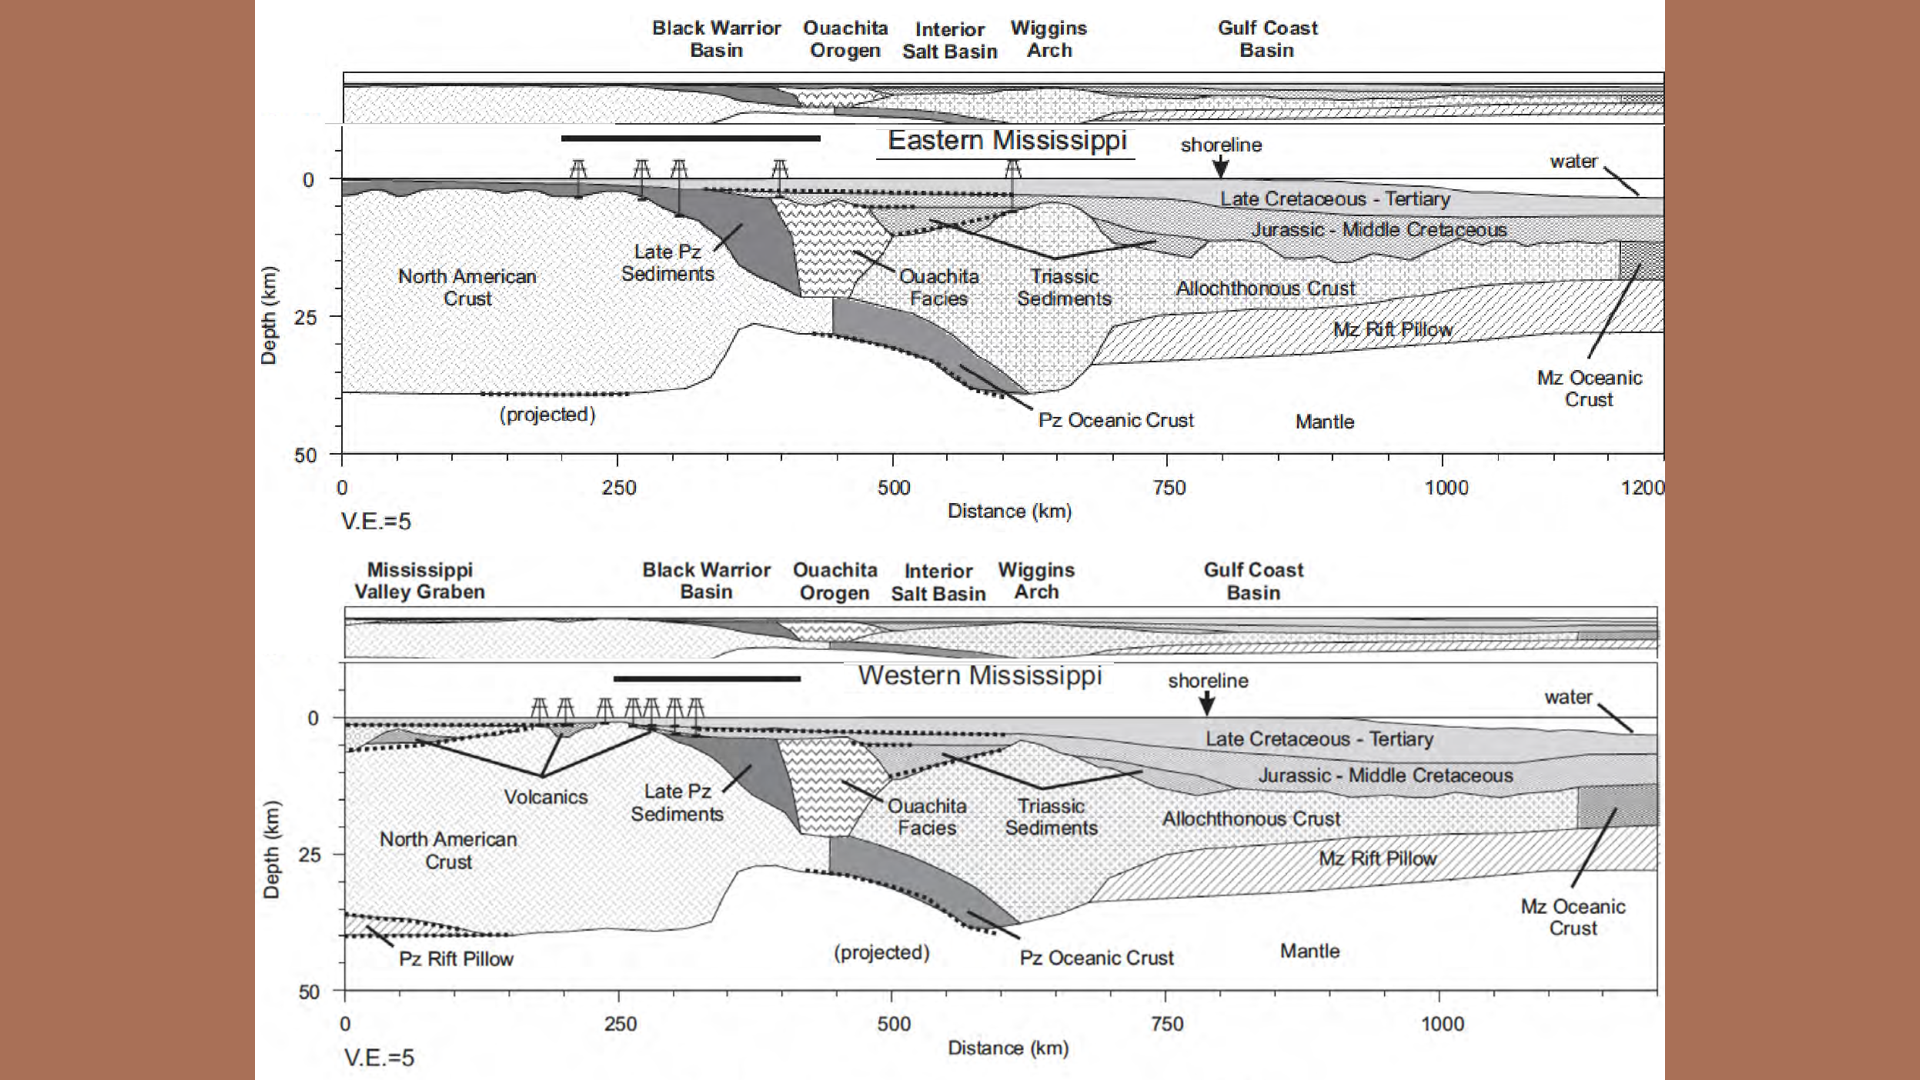 Figure 8: Here are two sections through the Wiggins Arch. They have roughly the same profile as the Sabine Block. As they carry that structure towards the Keyes crater, I propose they all brock off in the same event prompted by the lithologic change produced by the earlier Keys crater and all were split off by the following Serranilla crater.
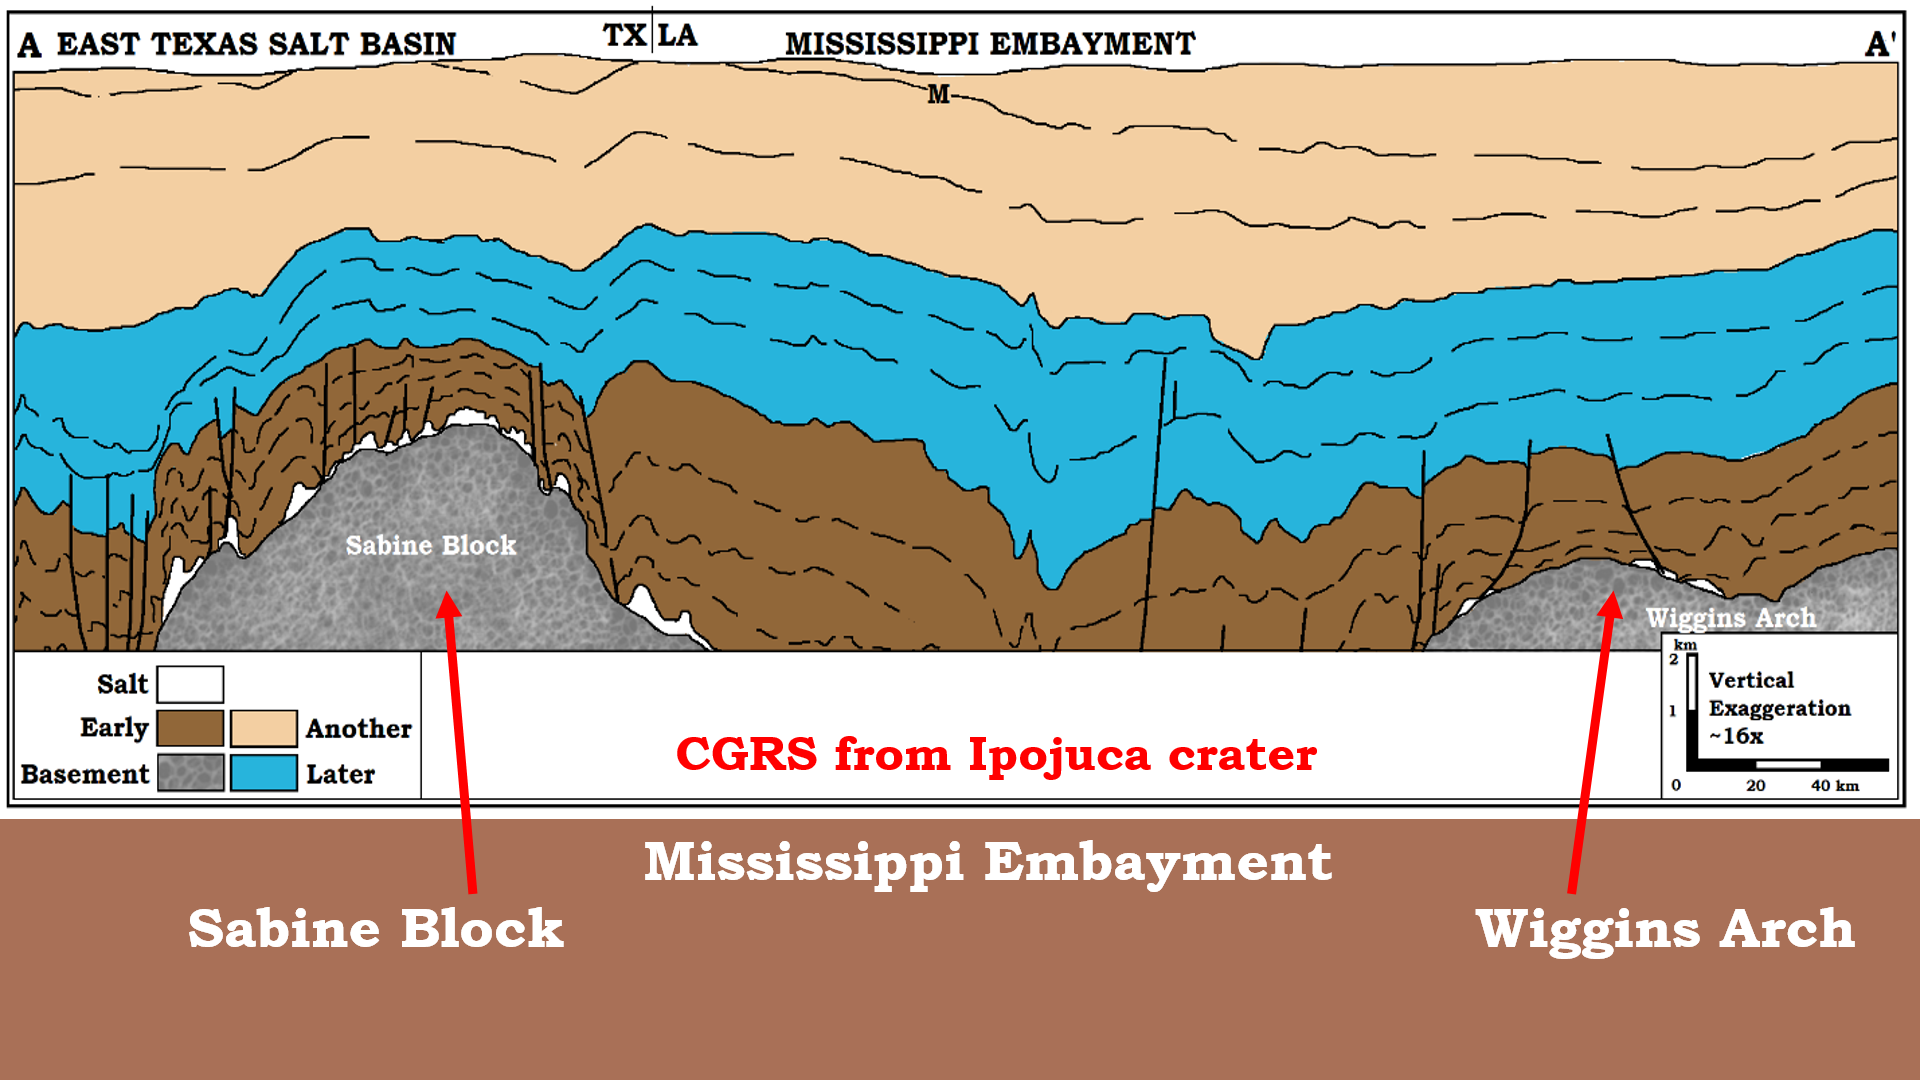 Figure 9: Between the Sabine Block and the Wiggins Arch occurs a trough known as the Mississippi Embayment. It extends up the path of the Mississippi River’s thalweg past the joining of the Ohio River. This thalweg is a CGRS Release Valley from the Ipojuca center in the southern Atlantic Ocean (Chapter 15A) and can be traced into Saginaw Bay and through Lake Huron into Ontario and Quebec, Canada.
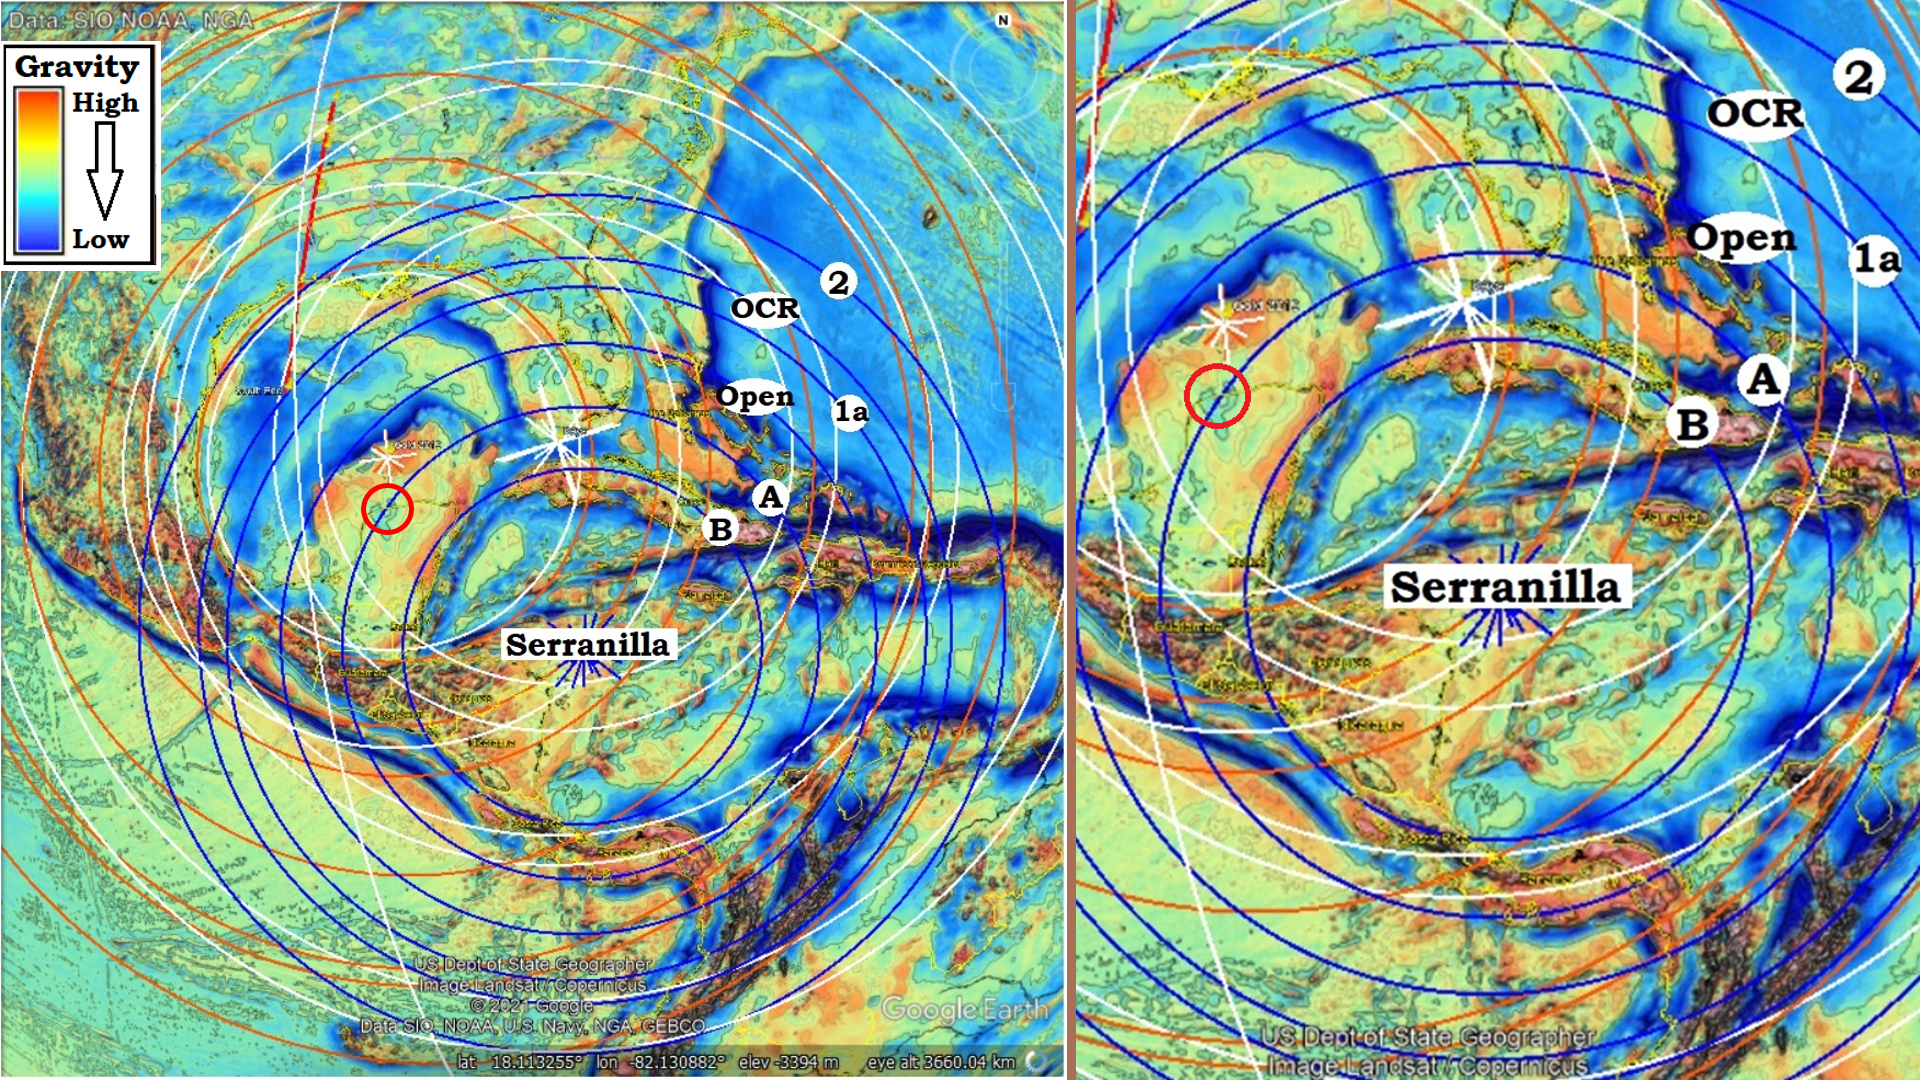 Figure 10: If the Keys crater caused the Sabine Block and Wiggins Arch to fracture across the bowl of the Gulf of Mexico, what caused them to fracture on their northern end off the Continental crust of North America? I will propose it was the formation of the Serranilla crater that spans from the Yucatan Peninsula to South America, and is responsible for forming much of the Caribbean Ocean. The Serranilla crater forms the arc of mountains that rim the northern coast of Cuba, from the Sierra de Los Organos to the Arch de Camaguey, although later smaller craters have made major contributions to the up-thrust final form. The Mayan Mountains of Yucatan and Belize carry the arc to the south. While the small red circle, the Chicxulub crater, is credited with the Iridium layer and much of the Late Cretaceous to Paleogene lithology of the Gulf Of Mexico region, I propose the lithology and accompanying changes were due to the formation of the much larger Serranilla crater, not the tiny Chicxulub.
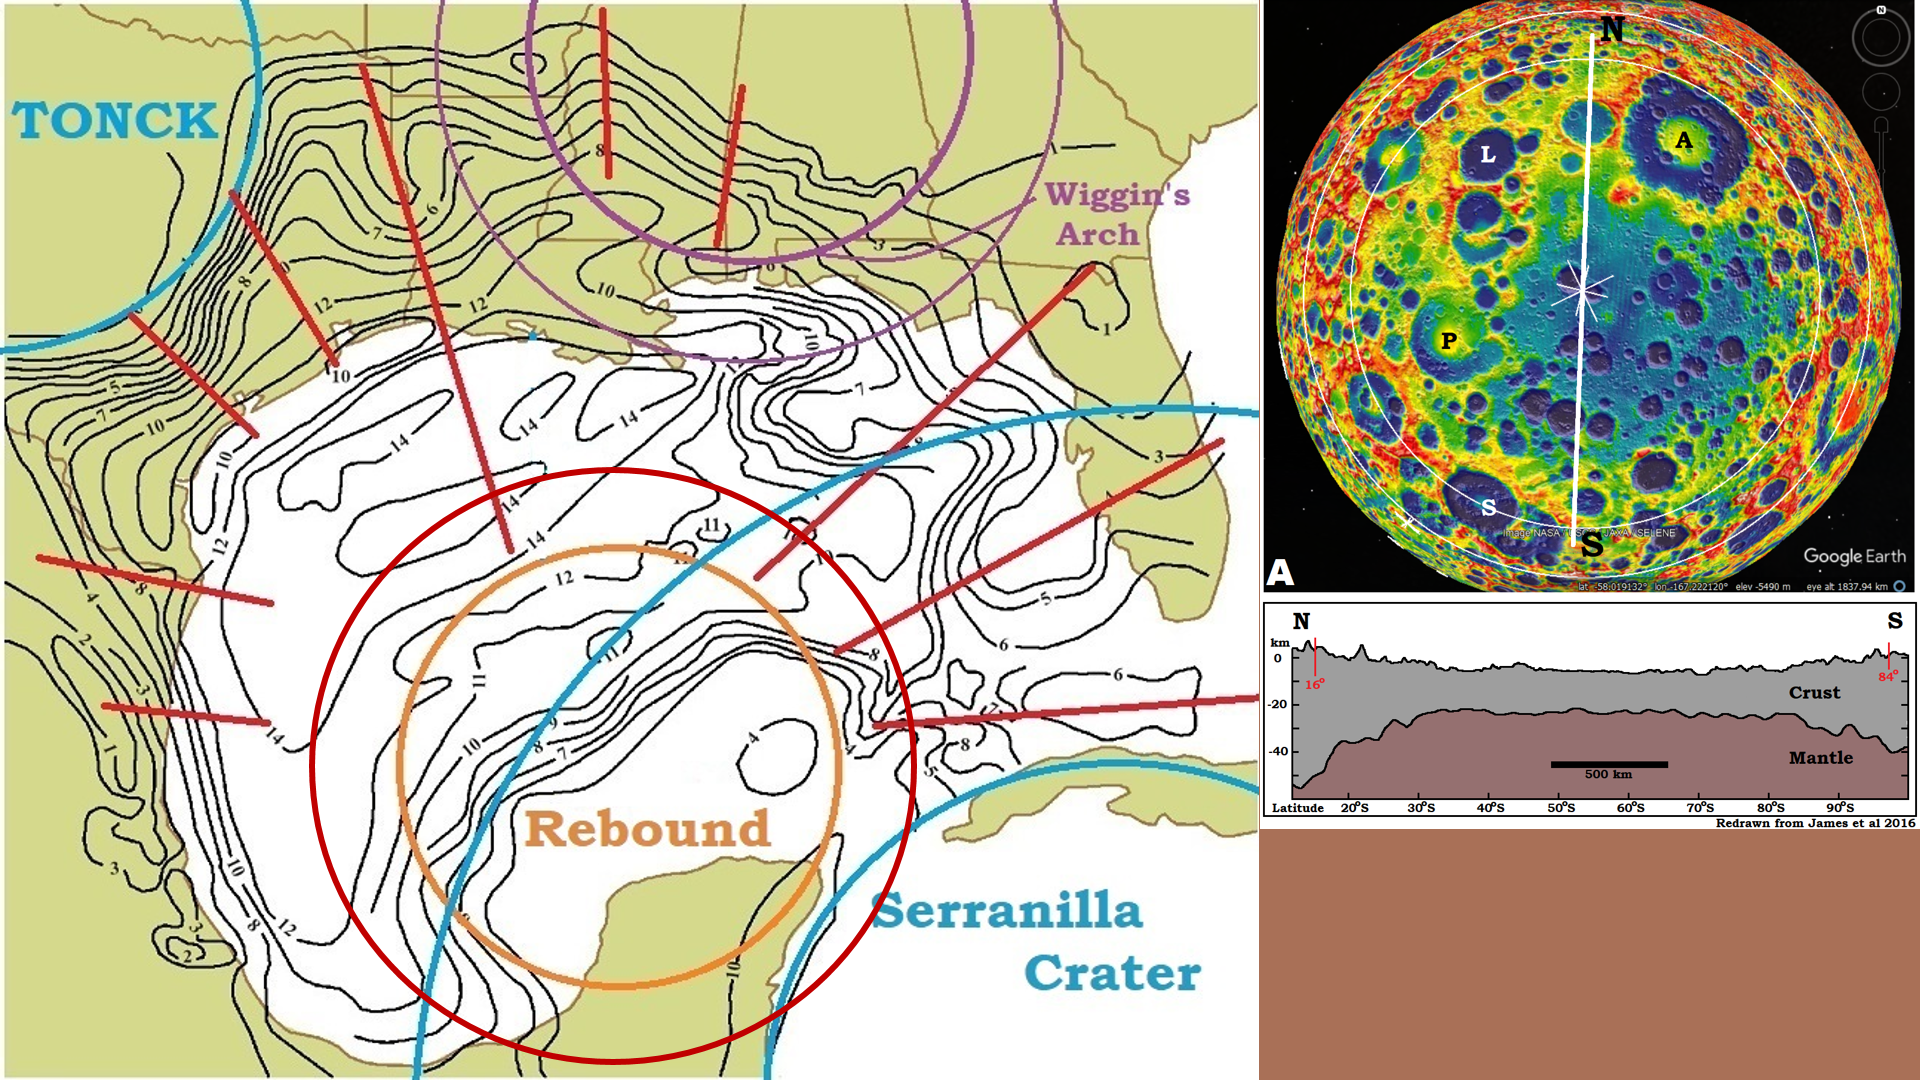 Figure 11: An uplift in the center of the crater is a commonly recognized structure in lunar craters. (A) shows the South Pole-Aitken Basin in GRAIL Gravity Map. James et al (2016) provides the cross section of the ~2,000 km/1,240mi diameter crater. I propose the uplifted mantle exist under the Gulf of Mexico crater to the Open (Cc)-ring, Figure 1. This topography isochrones suggest the rebound is most evident in the red circular area, possibly accentuated by the uplift from the Serranilla crater.
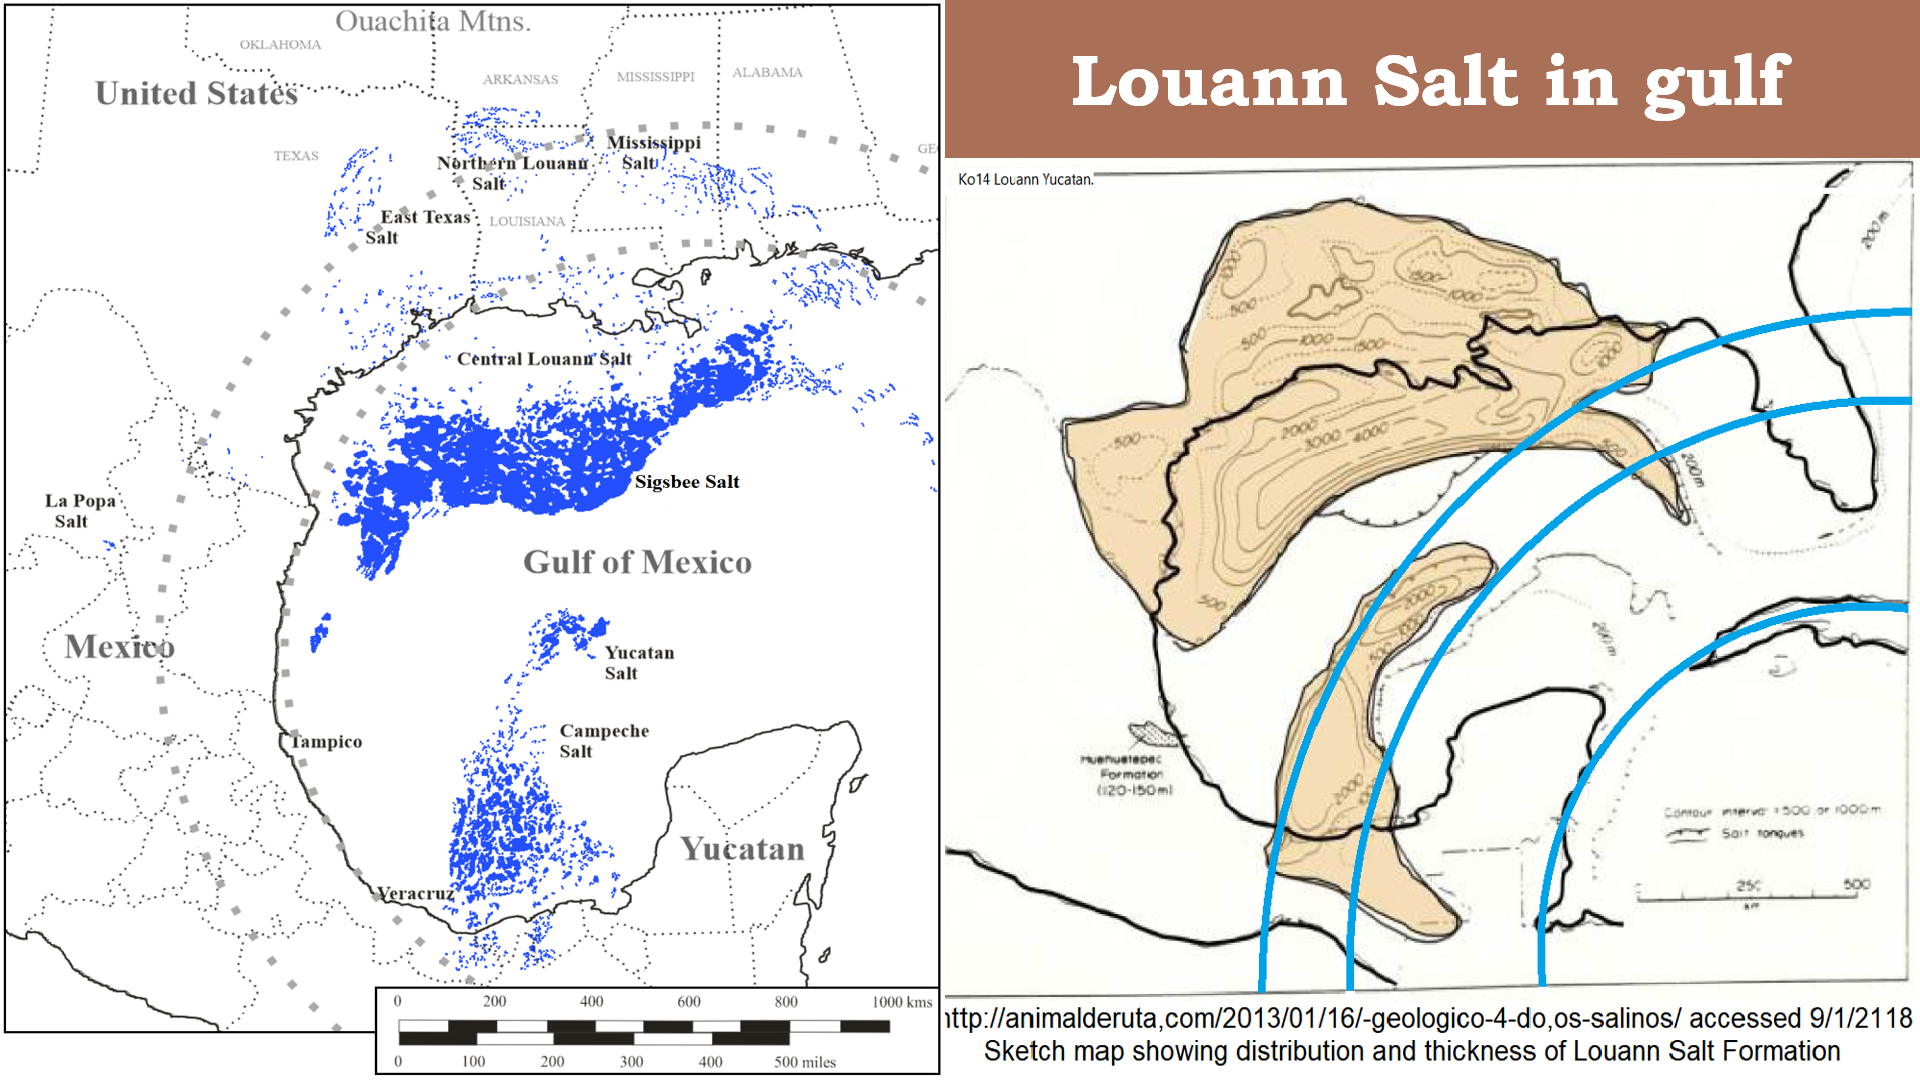 Figure 12: Two drawings of the distribution of salt in the gulf. Present model builder have no explanation for the strip of separation between the two main salt bodies. Many refer to it as the “spreading center” suggesting this strip is where the gulf has historically grown wider pushing South America and Africa (Gondwana) apart to form the Atlantic Ocean. We will see an explanation why the Sigsbee Salt is thrust southward, but the salt’s “arc of absence” separating the two main bodies, and the circular absence between the Yucatan Peninsula and the Yucatan Salt and Campeche Salt, where I have proposed the Gulf of Mexico crater is centered, is a real physical absence. As I propose salt is a condensate from the cloud of vaporized rock. The heat in the surface may have a direct affect on the ability for vaporized minerals to remain on the ground after condensing (see pdf: GM 2- GoM Louann Salt). This heat would most likely be present near the center of the Gulf of Mexico crater, and where additional heat was put into the substrate by the Serranilla crater. This would also suggest the Serranilla crater happened before much of the heat for the Gulf of Mexico crater had time to significantly dissipate.
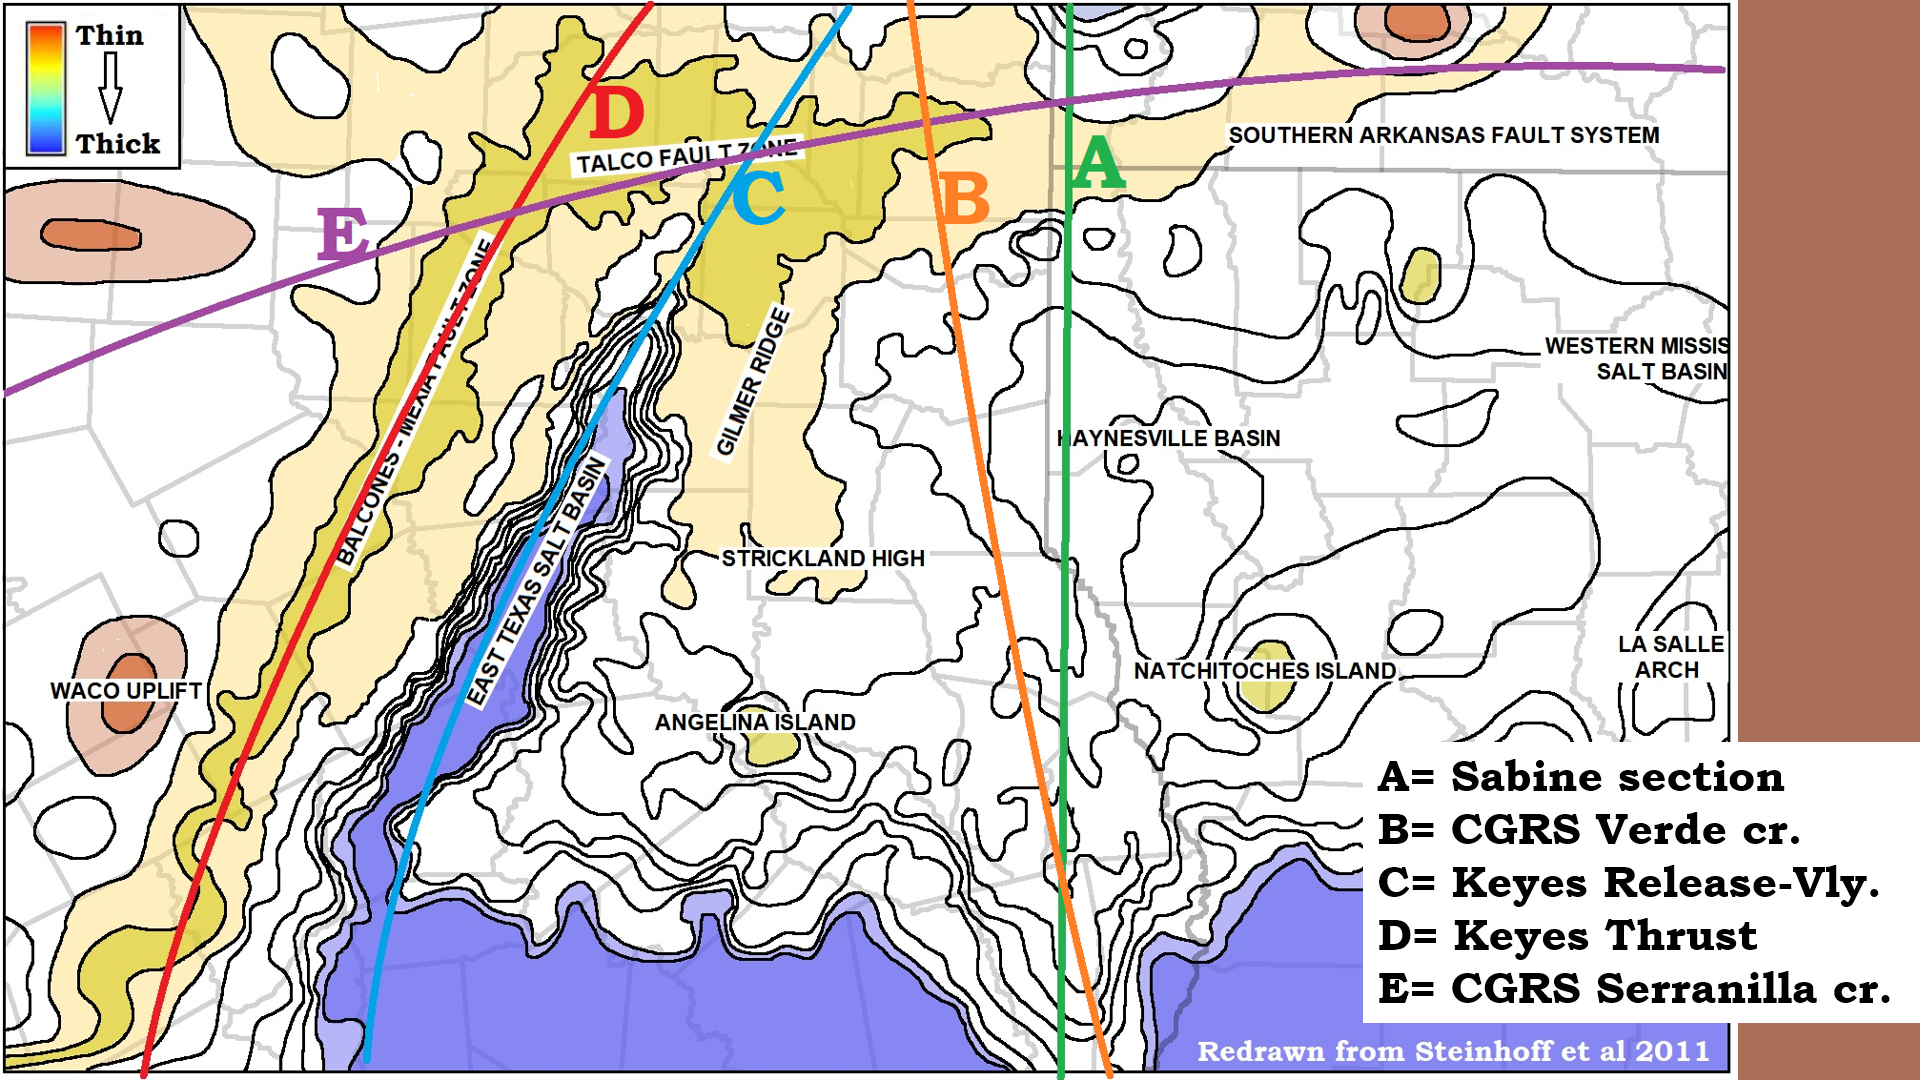 Figure 13:Steinhoff et al provides a Topographic map of the top of the crystalline basement using the Pettet to Gilmore Lime as a surrogate from well drillings. Some of the detail we can see in the basement topography includes the top ridge of the Sabine Block, linear B, laying at an angle to the mapped section used by Mickus and Keller, Figure 2, that is located at linear-A. Linears C and D are a ridge and valley pair that cuts off the west side of the Sabine Block. I believe this shear pair probably centers in the Keys crater. Linear E shows in both the Talco Fault Zone and the Southern Arkansas Fault Zone, and I propose it is a CGRS from the Serranilla crater.
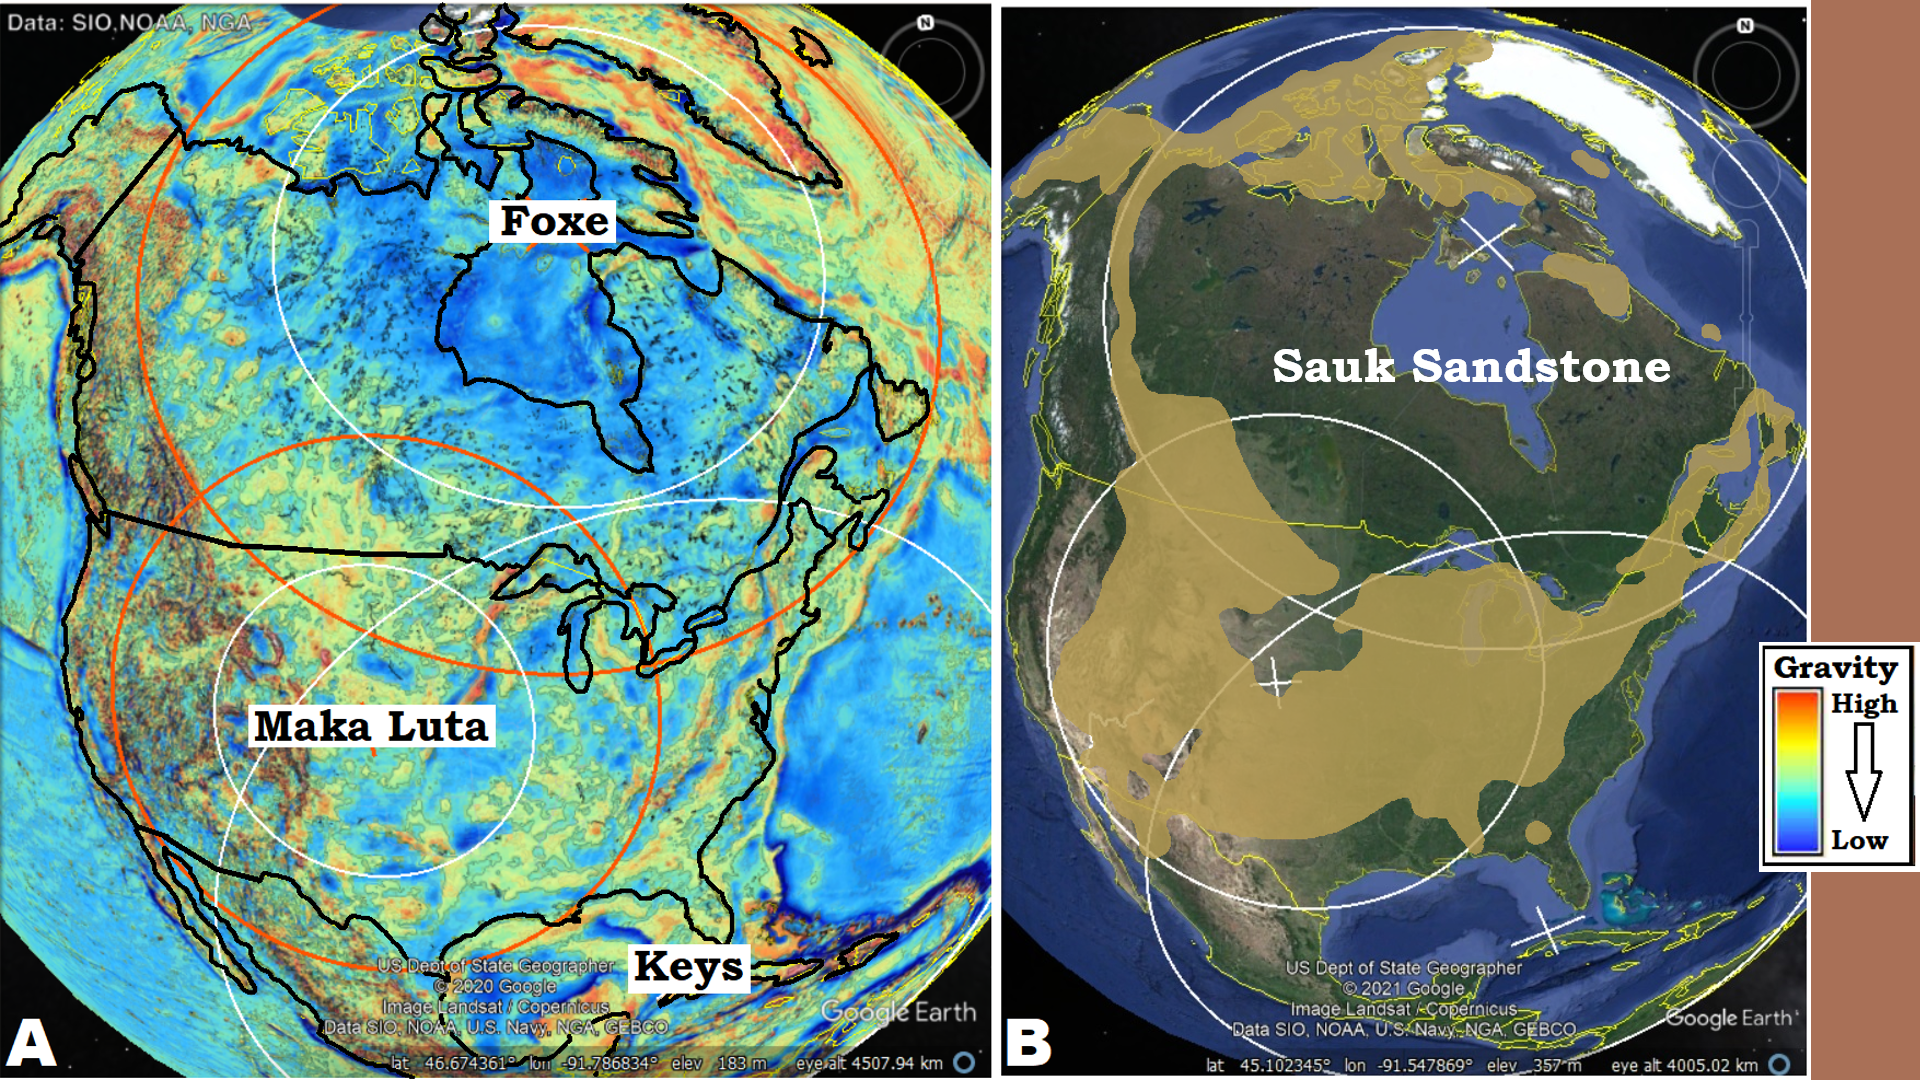 Figure 14: The first sedimentary layer above the Great Unconformity in the Grand Canyon is the Tapeats Sandstone. It is correlated over much of North America and is often referred to as the Sauk Mega Sequence. While the author does not agree with the concept behind mega sequences, these correlated sandstone layers do conform to the edges of the Foxe crater and much of the Maka Luta crater with some significant absences. One of these absences is underneath the center of the Maka Luta crater and a void extending along the CGRS from the Keyes crater. This curved linear is often referred to as the “dinosaur Peninsula,” as many evidences of dinosaurs are to be found in it. As some additional spots appear on the Keyes circle further south, I propose heat controlled the non-depositing of the sandstone in these areas. If the substrate was too hot, the quartz and feldspar sand was not able to condense, This would also explain why the sandstone did not condense towards the center of the Foxe crater. This is the Canadian “craton” which must have remained at a higher temperature than its edges. But, why is the void in the sandstone over Texas and Louisiana adjacent to the Gulf of Mexico?
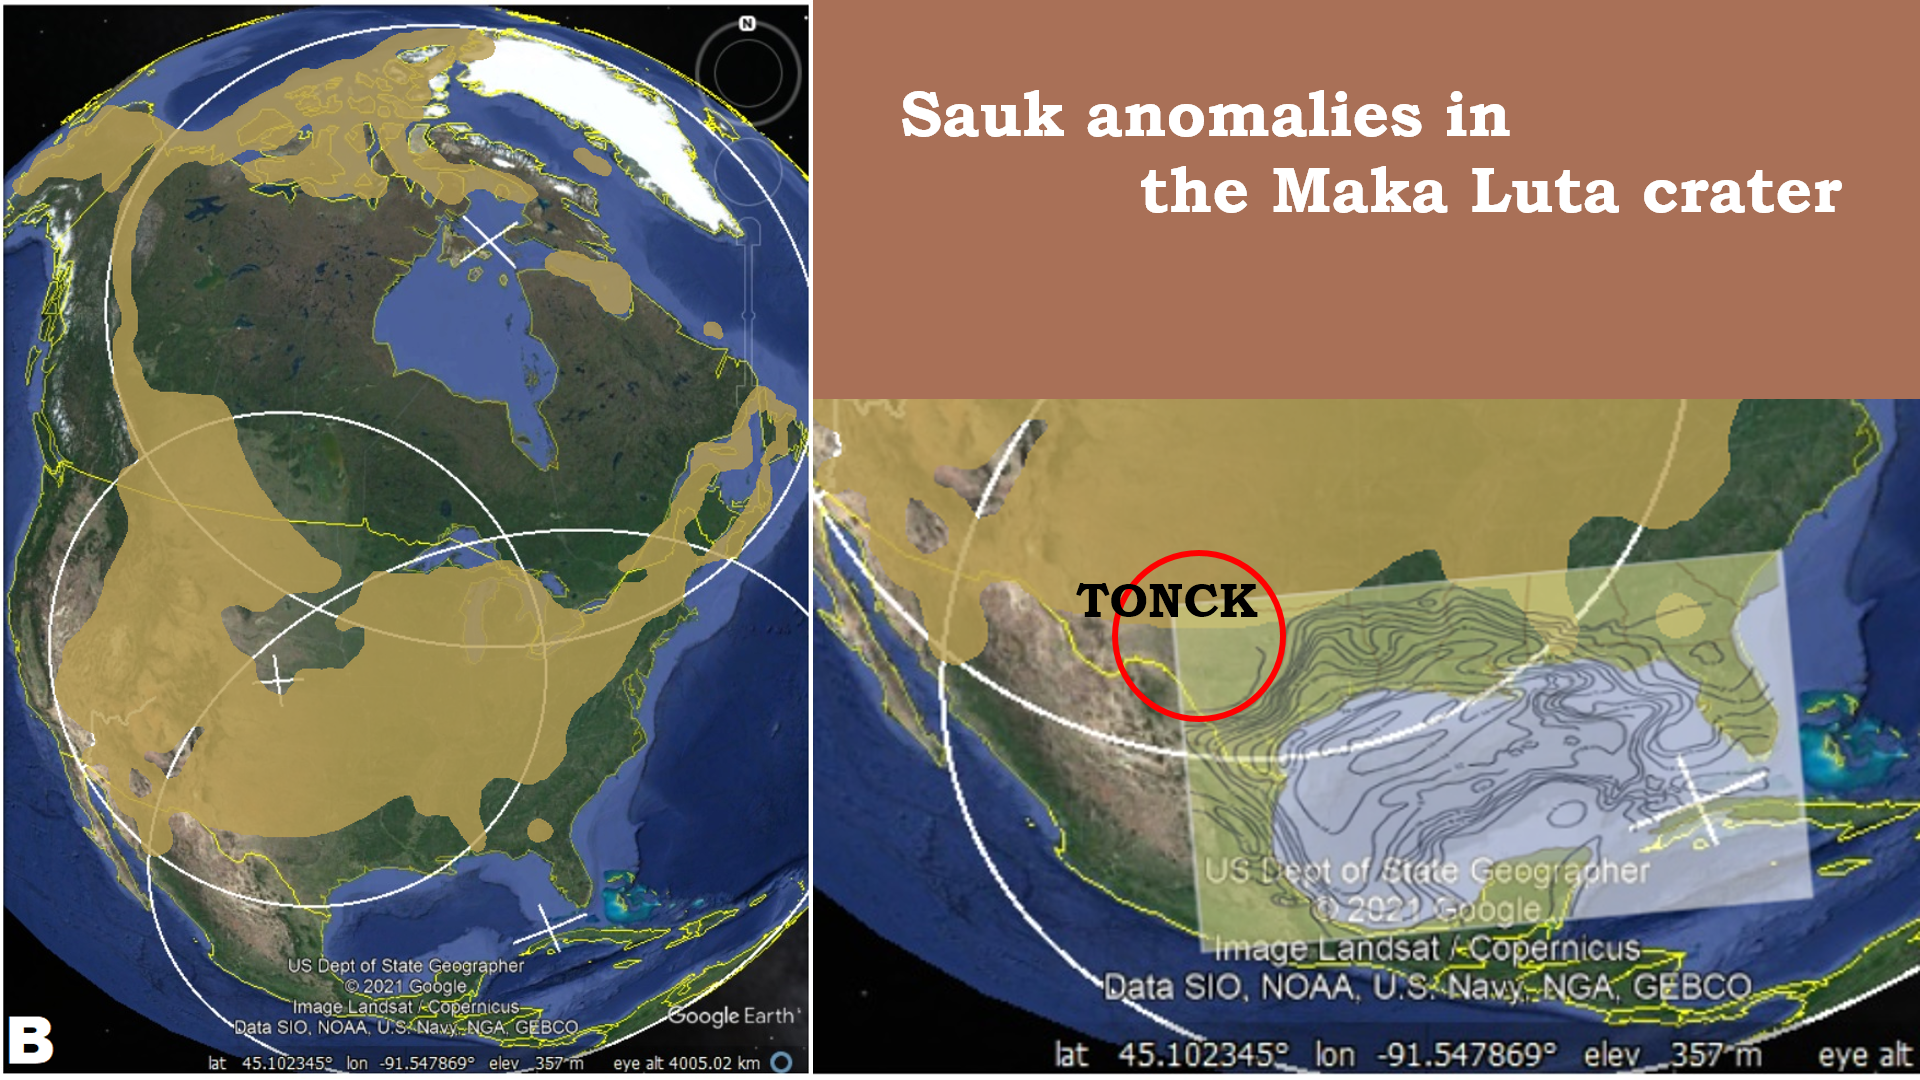 Figure 15: Overlaying the basement topographic map over the Sauk map suggest a reason. Much of that area was excavated by the Gulf of Mexico crater and would also be at an elevated temperature compared to further inland. The spot of sandstone just north of Florida, in southern Georgia is also interesting in this regards. Note how the isochrones over Florida avoids that area. It is likely that the basement under that spot was also at a lower temperature to allow condensation of the sandstone from a cloud of vaporized rock. The placement of the TONCK crater, Chapter 1, extends the void in the Maka Luta to the west, but it does not follow its border like the basement topo does. I propose this is because the TONCK crater was after the Maka Luta, and therefore did not change the substrate’s temperature, but it did push back or rearrange the excavation of the Gulf of Mexico crater in that area, so that it is no longer recognized.
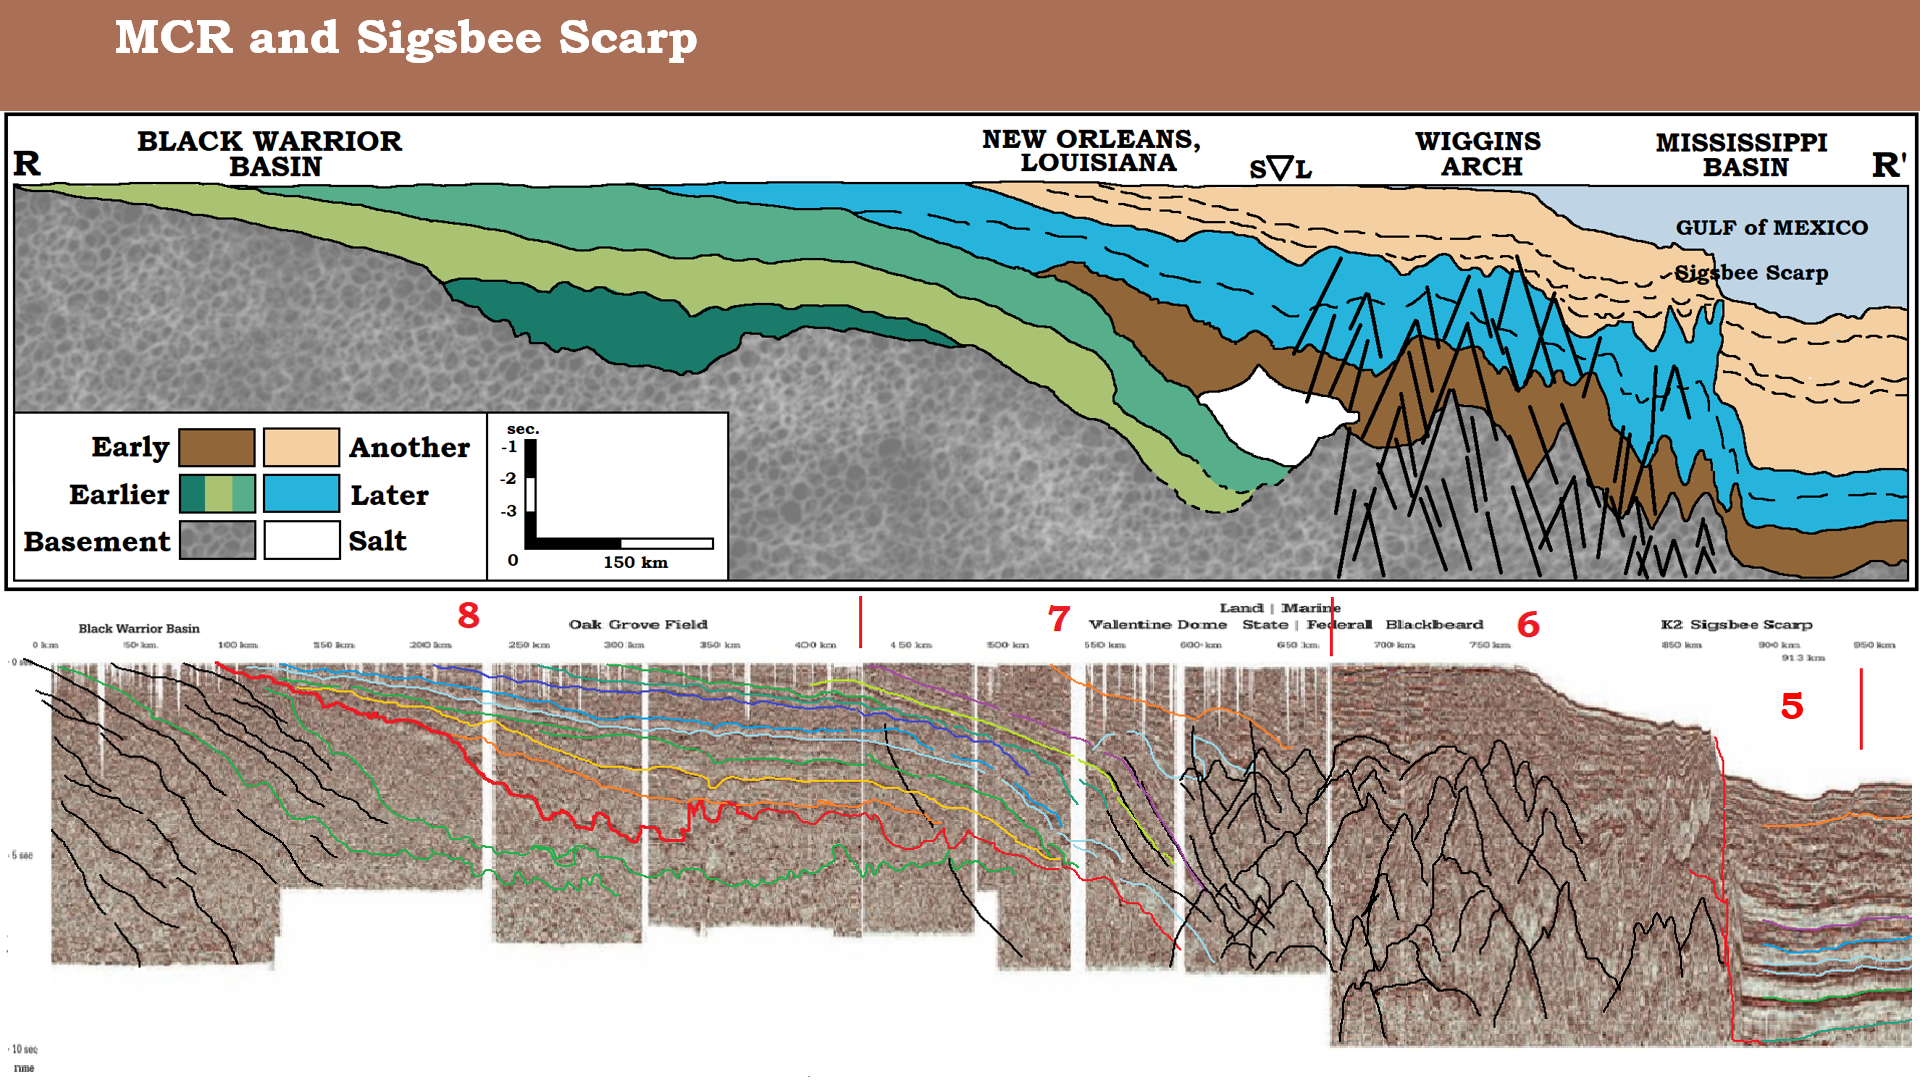 Figure 16: Section R, see Figure 18 for location, extends from the Black Warrior Basin, across the Wiggins arch, through Sigsbee Scarp, into the deep gulf. I have included the original ION seismic section for the reader themselves to see the disruption that the MCR crater produced in the sedimentary strata thrusting up the Sigsbee Scarp. Had not that disruption occurred, it is presumed that the slopping layers seen under 7 would continue at that same slope to join up with the layers under 5. That slope would have been the slope of the crater sides in the excavated bowl. I am struck by the similarity in appearance of the cone shape in the area of the thrust-up to the cone-in-cone appearance of shatter cones that are also often found under the edge of a crater’s ring. Remember shatter cones are found in association with rings of relatively small craters. What would a shatter cone look like if it was 12-14 km/8-10mi tall and 4-600 km/250-375 mi wide? Maybe it would look like this.
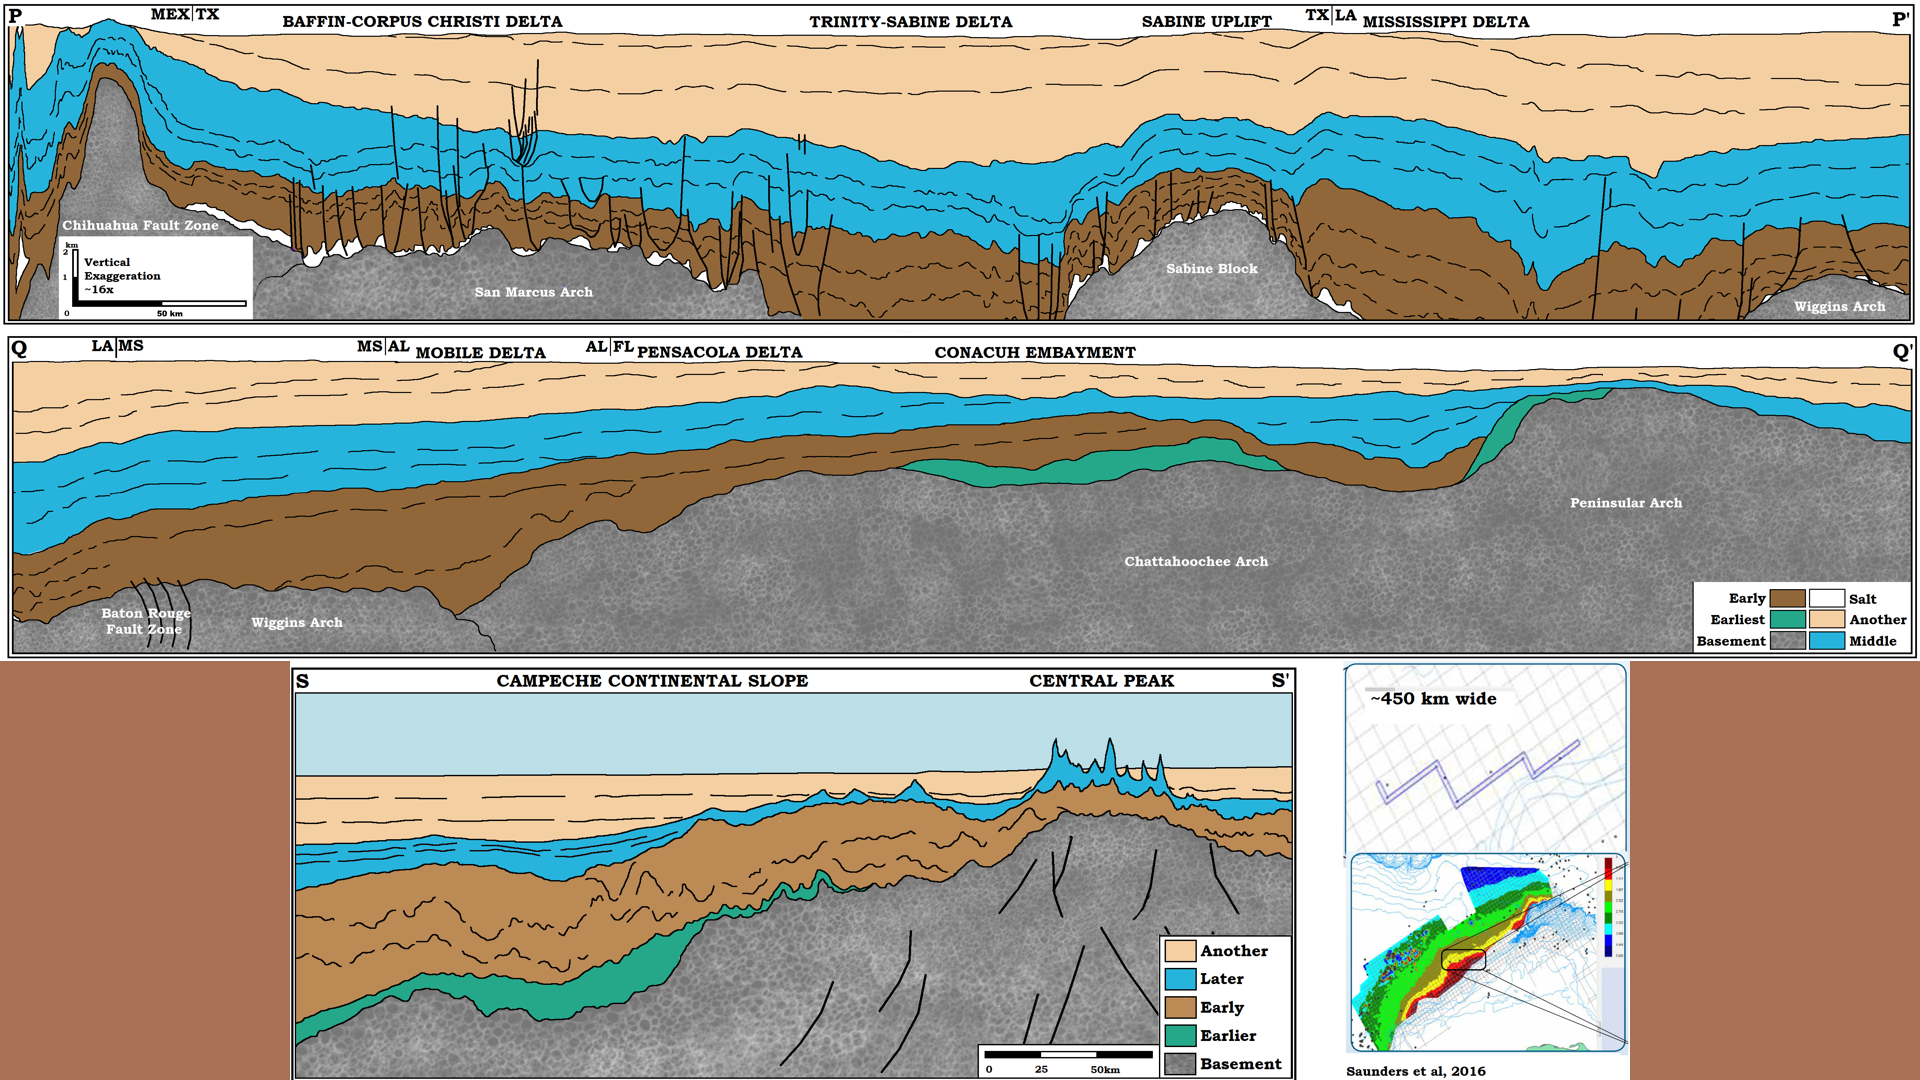 Figure 17: Sections rimming the Gulf (location shown in Figure 18) from the Mexico-Texas border on the upper right (P) to the Atlantic Coast just north of Florida on the mid right (Q’). The strata are not only correlated, but they are continuous, except for the earliest strata which did not deposit on the Peninsular Arch under Florida. The earliest strata only deposited on the gulf side of Florida and may represent sediments from the Bermuda crater. Both the Bermuda and Gulf of Mexico craters came after the Keyes crater and worked together to form the sub Florida Peninsular Arch. The top of the blue strata is generally identified as Late Cretaceous-Paleogene boundary. I propose both the brown and blue strata were all fallback sediments from the Gulf of Mexico crater. And, while later craters thrust up and rearranged the gneiss in the crystalline basement and lower strata, no later craters pierced down to the crystalline basement in this area. Section S-S’ shows what I interpret as part of the central peak structure, just on the edge of the Campeche shelf. This is where I find the center of the Gulf of Mexico crater in Figure 1.
 Figure 18: Key to most of the lithology sections and locations referenced in this slideshow. The Gulf of Mexico is the location of the Grenville Orogeny and the convergence and rifting of Gondwana. For this all to have happened gradually is impossible if all the base layers show continuous deposition from Mexico to Florida (See the Grenville Orogeny never happened). As possibly the most drilled and studied area of ground on the planet, the Gulf of Mexico hold few lithologic secrets. The history of cratering is all in the details, and the more details we know, the better we are going to be able to understand exactly how cratering there took place. If the model is correct, the more we know, the more we will understand, and the clearer the details will become.
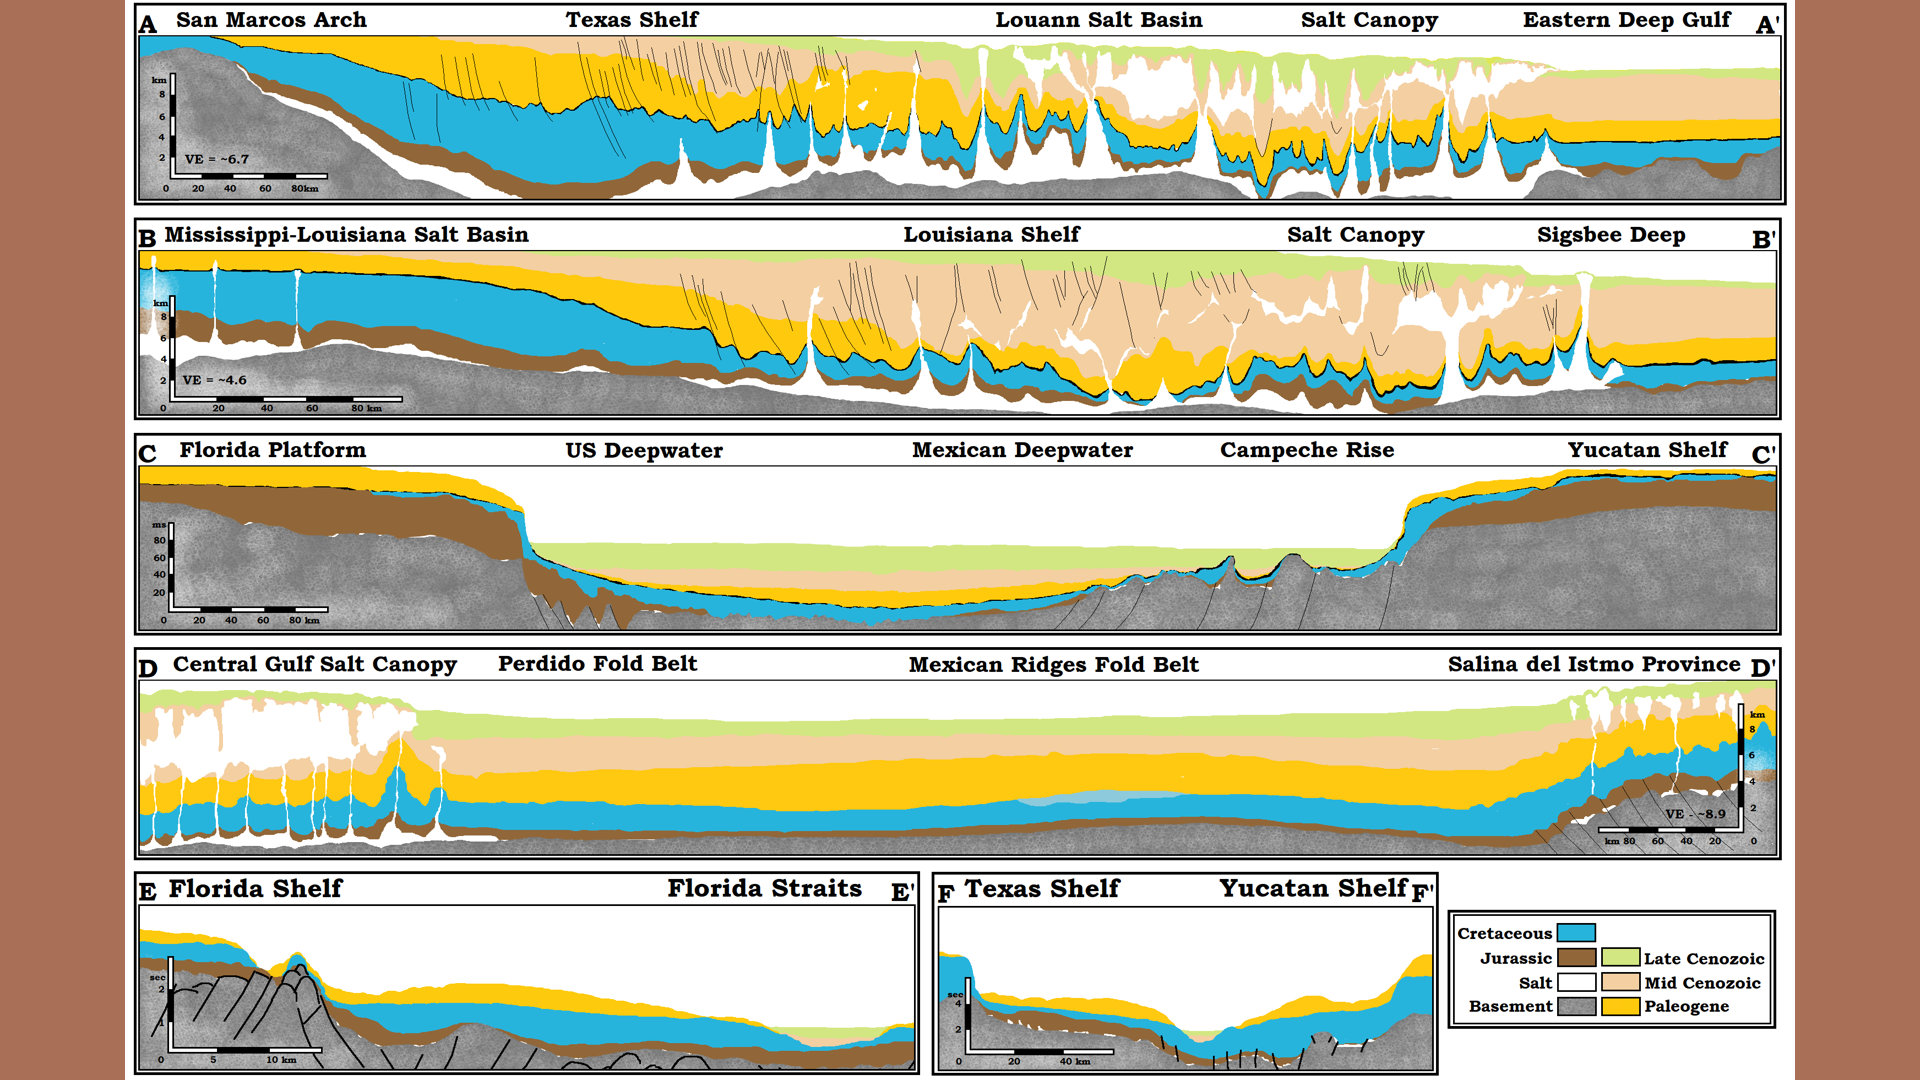 Figure 19: Six sections through the gulf (for locations, see Figure 18). The black line between the Late Cretaceous and the Paleogene is the K-Pg Boundary (KPGB). The black line represents the KPGB iridium layer believed to be spewed out by Chicxulub crater causing the dinosaur extinction. The KPGB iridium layer is real, but unlikely to represent a unique feature. Probably, iridium layers around the world represent local cratering to that area, like in the gulf. But, it was not produced by the Chicxulub crater, which was much later, but maybe the Serranilla crater in this location. The Paleogene Wilcox formation just above the KPGB is one of the thickest single strata in the gulf, and it may represent the final fallback and condensation from the Gulf of Mexico crater with the arrival of the Serranilla crater. Section C show it predates the rise of the Florida platform and predates the Serranilla as it is partially absent in the south end of the Campeche rise which I attribute to uplift in the center of the Gulf of Mexico crater, and disruption form the rise of Yucatan in the Serranilla cratering up-thrust.
 Figure 20: Comparing sections between areas can be misleading. This is three section. A-A’ is across the Eastern Rocky Mountains to the Mississippi River, a distance of ~1,500 km/~930 miles with an altitude gain of ~3500 m/~2.0 miles. In barely half the linear distance on the Louisiana Shelf, B-B’, strata in the Gulf gains almost 10 miles/16 km of altitude. Similarly in C-C’, on the Texas shelf in about 2/3 the linear distance the altitude gain is between 9 -10 miles/5 - 6 km. All three sections are shown with the same vertical exaggeration, so they are in the same scale. Topographic changes in the Gulf of Mexico is nothing like topographic changes on the surface of the earth, so it would be ridiculous to postulate similar processes formed them. I am suggesting, the cratering bowls left by the early craters were very different than the remnants of smaller craters left on the earth’s surface.
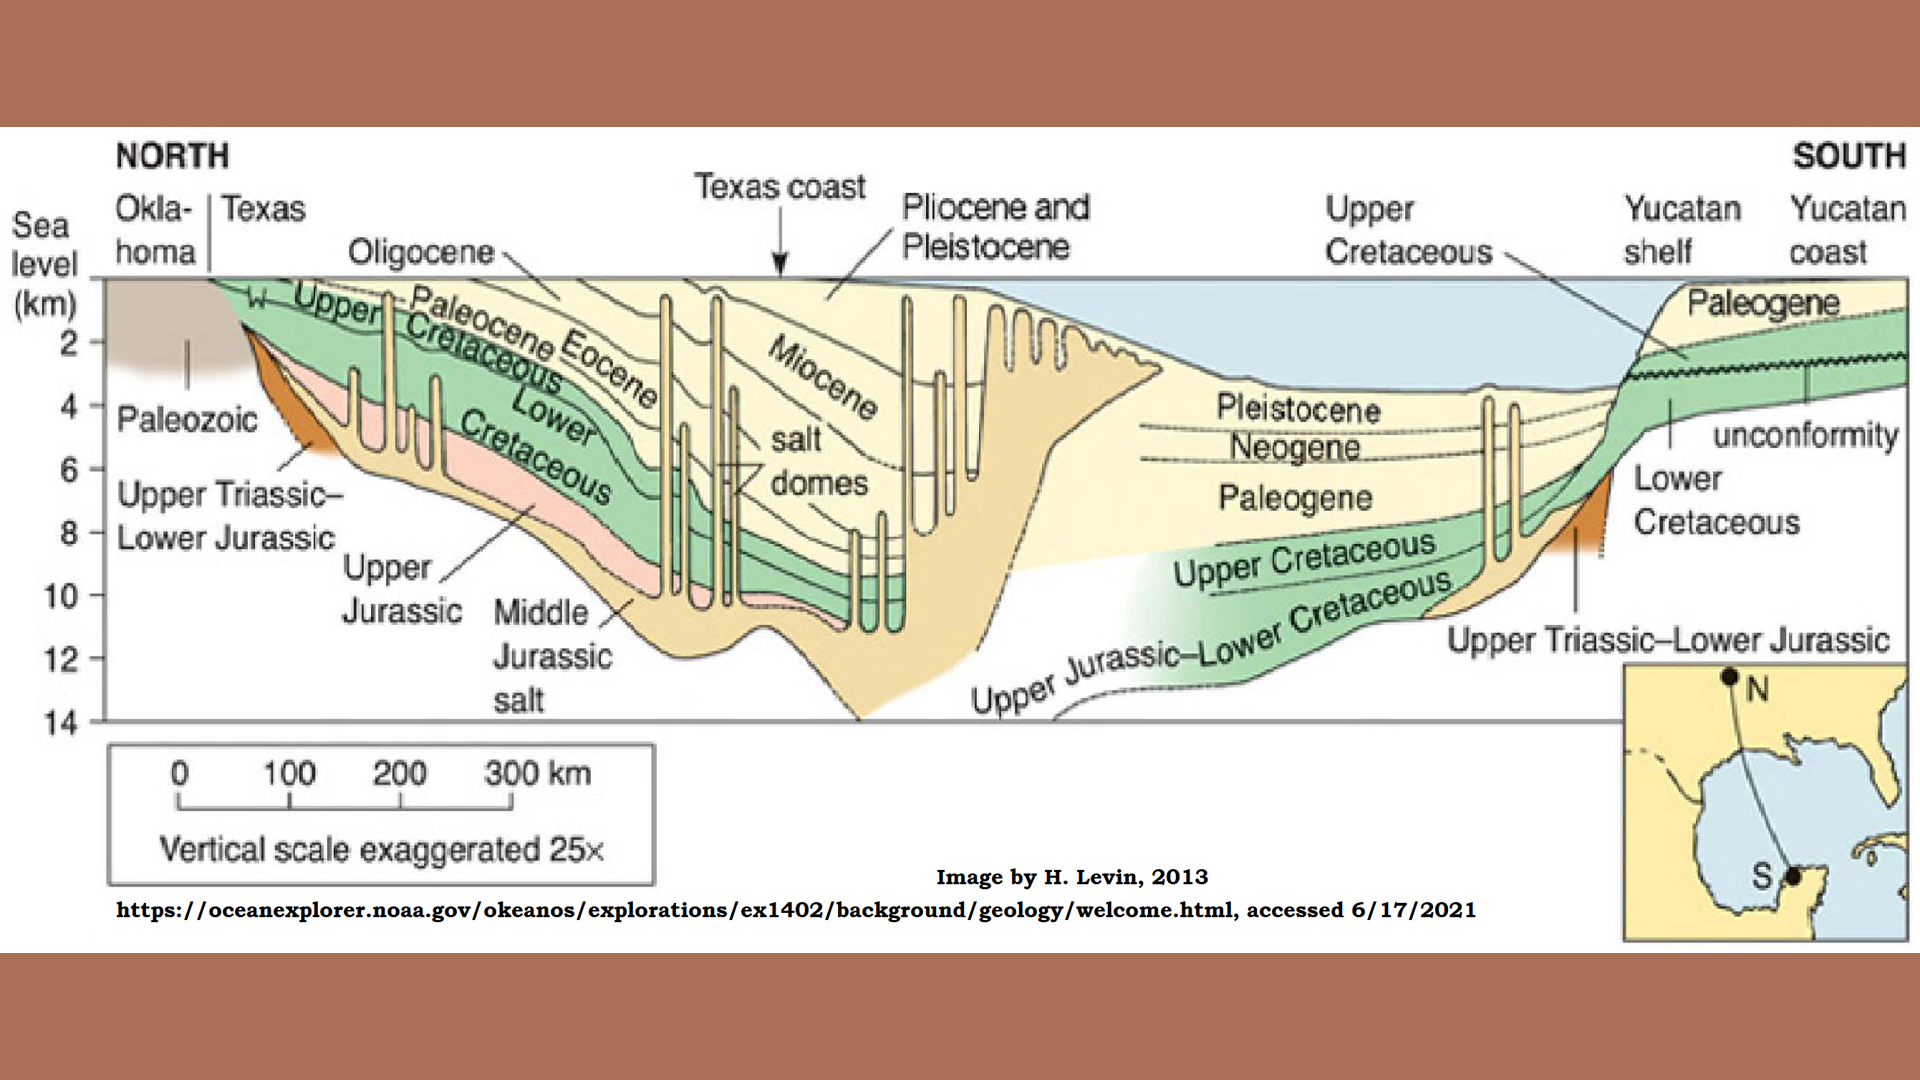 Figure 21: One more section from Oklahoma, west of the Sabine Block, to the Yucatan Peninsula. The section emphasizes the differences west of the Texas Salt basin and the Sabine Block. It is a very simplified section, but contains some very important information. On the north end there is some “Upper Triassic-Lower Jurassic” strata indicated. I propose this would be from an earlier crater that struck further west but left some strata incorporated below the first fallback from the Gulf of Mexico crater. This suggest, the cratering bowl was not excavated into the lithology, but the rim was pushed up from below like Meteor crater in Arizona (see Chapter 8). In the center of the section, the upturning and overturning of the strata with the emplacement of the Serranilla crater has been interpreted as a complete over-thrust of some of the Jurassic sediments. Against the Yucatan Shelf it shows some additional “Upper Triassic-Lower Jurassic” strata remains. Whether further research will substantiate this designation remains to be seen. The sections in this area show broken and rotated blocks of rubble, some of which have completely become engulfed in the up-thrust crystalline rock. The interpretation of origin of these xenoliths is totally dependent on the model being used.
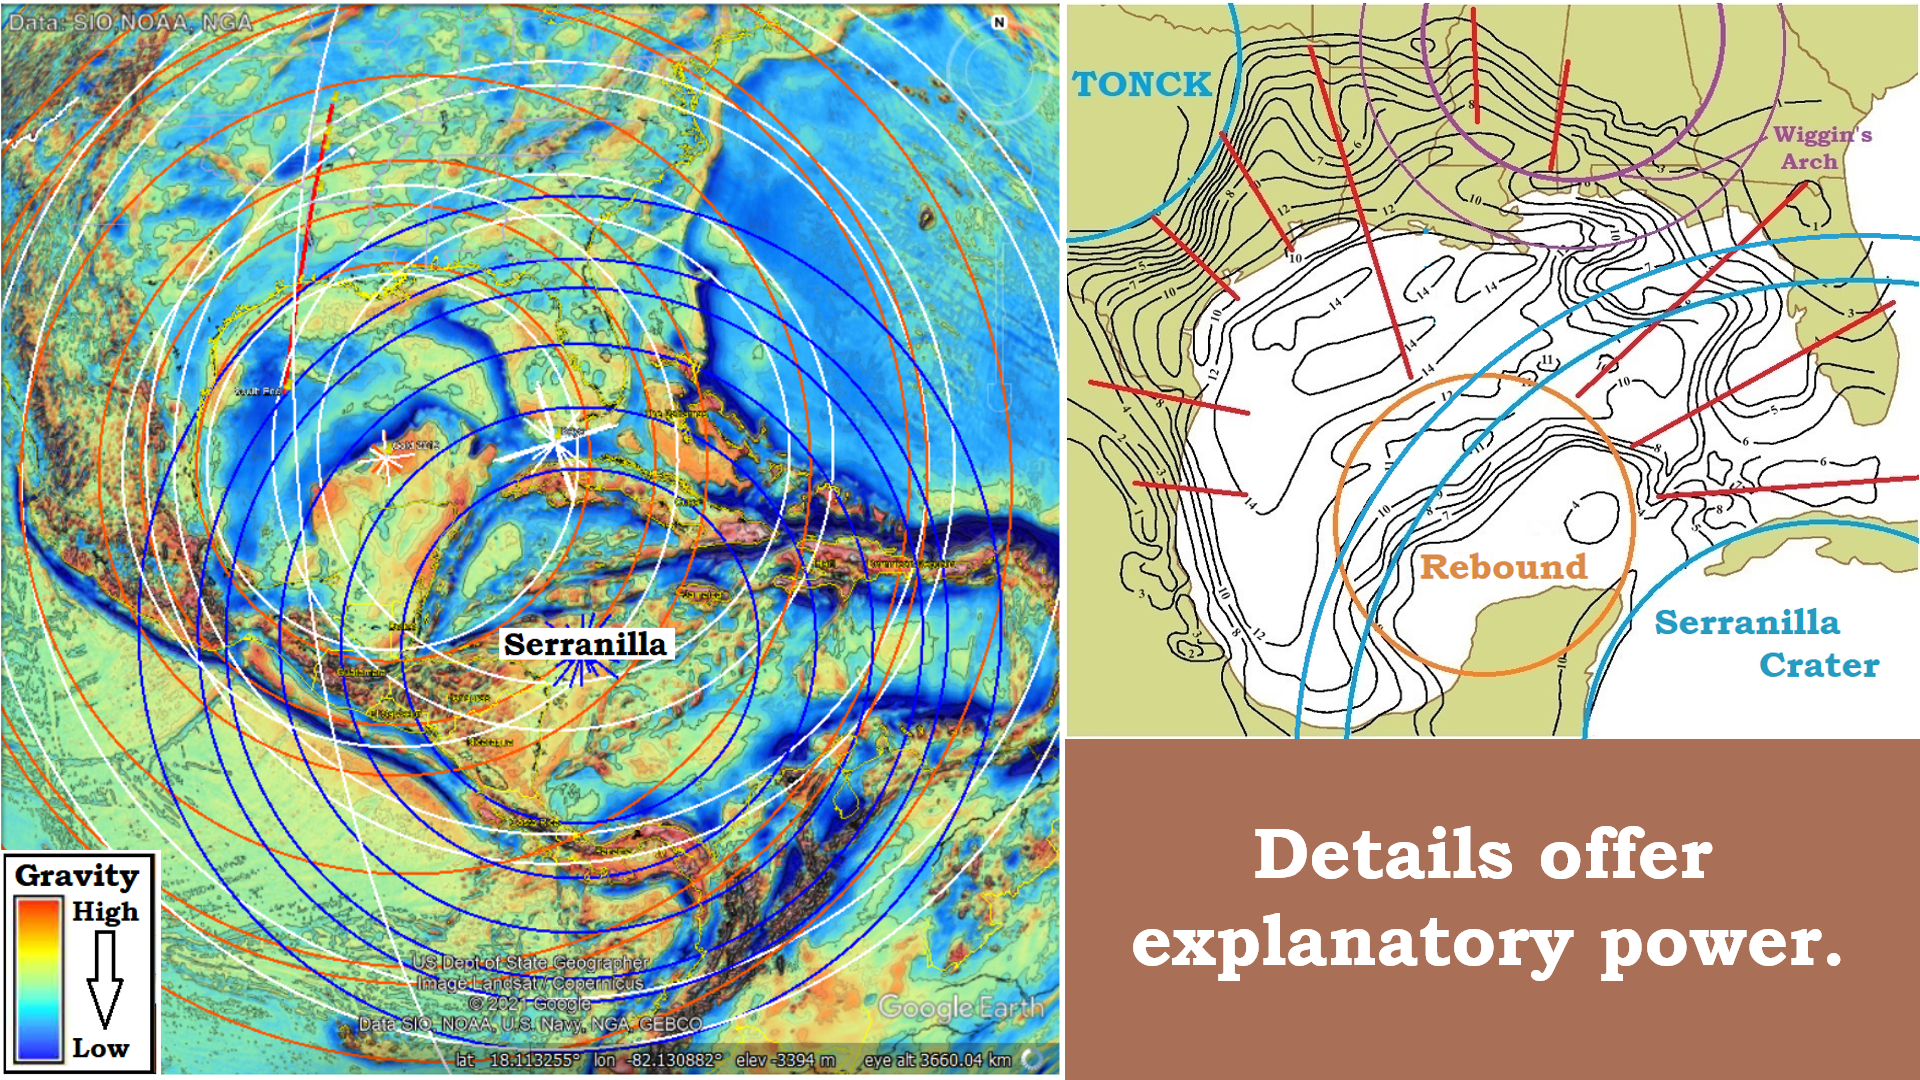 Figure 22: The rebound of the crater bottom happened relatively close timewise to the time of up-thrust putting the Serranilla crater in place.
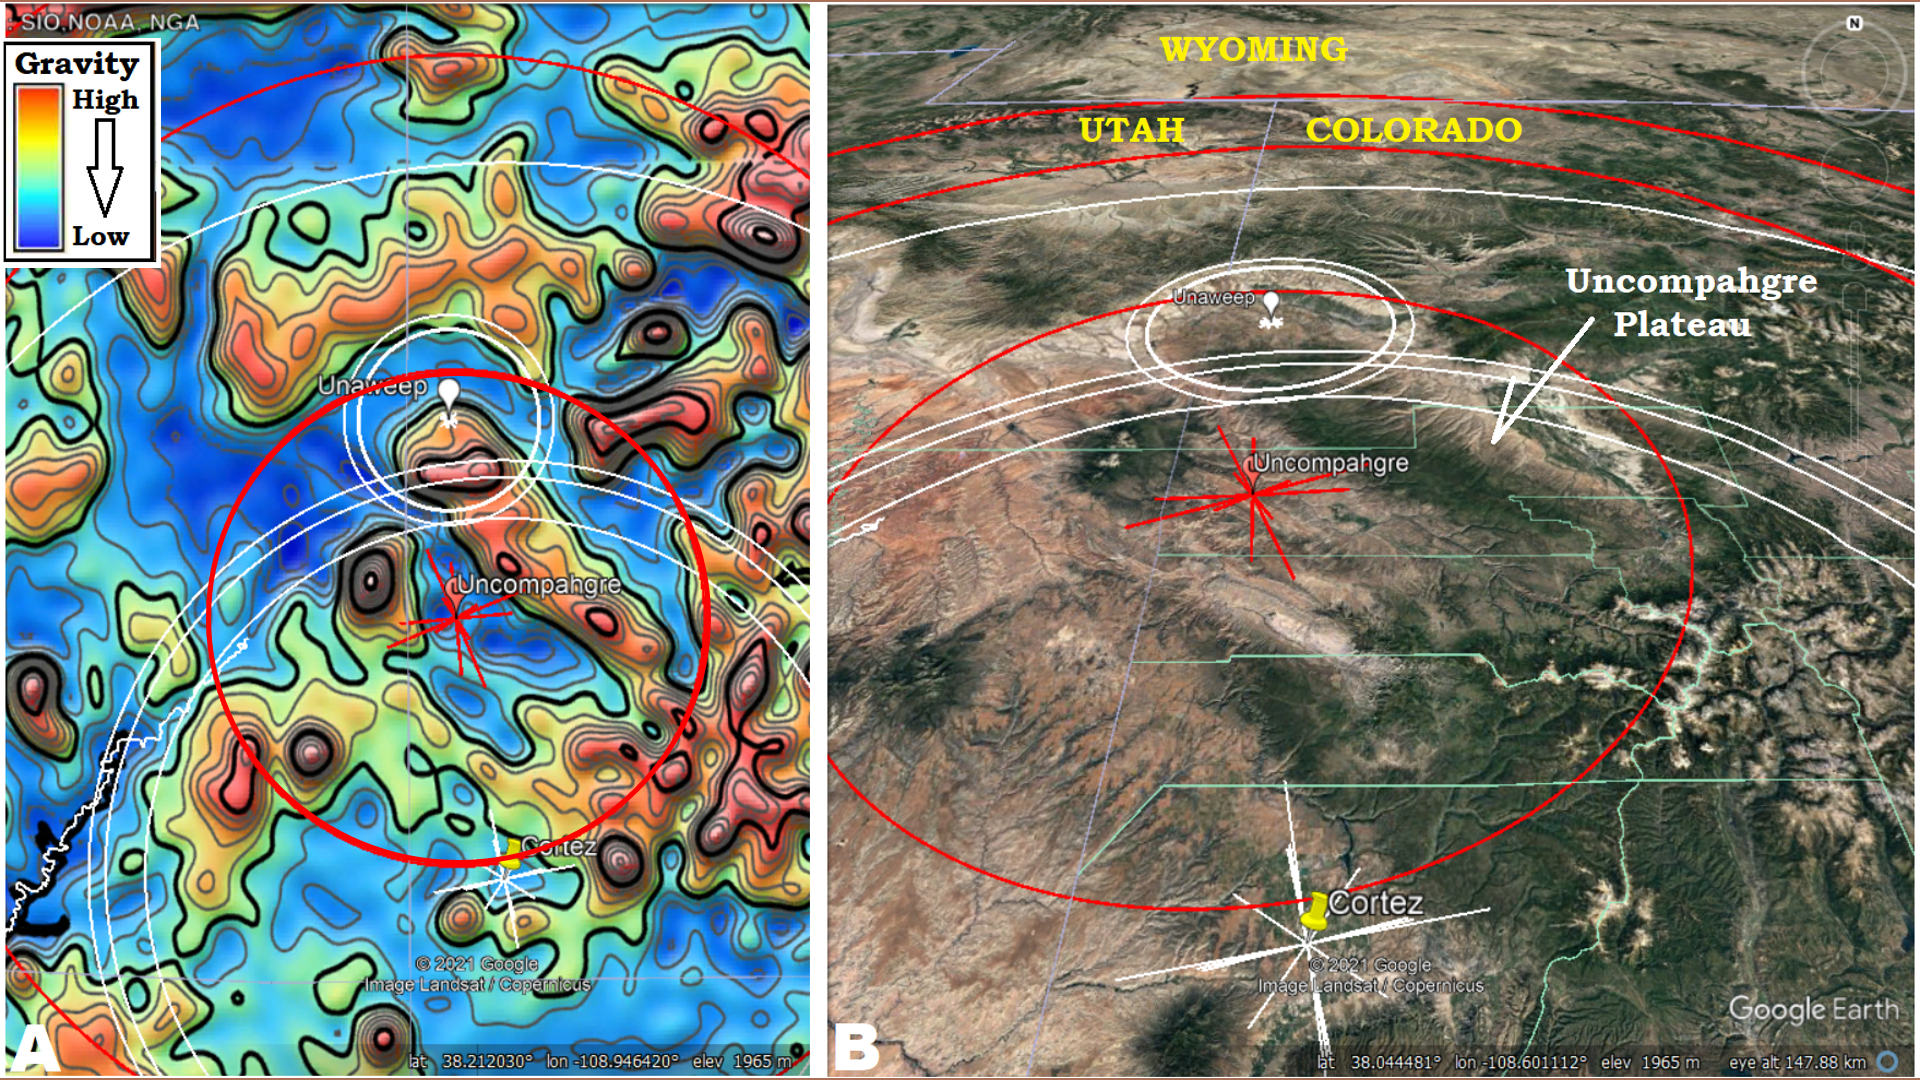 Figure 23: Understanding a large crater like the Gulf of Mexico involved sorting out the events of many craters that interacted with and in the gulf. Considering the interaction that proceeded and produced the cratering results for the Turner Gulch crater are nearly as involved. Once again, the more we know, and the greater detail to which we know it, the more ability we have to explain the lithology. Gravity and Oblique view of the Uncompahgre Plateau and Uncompahgre crater in red. The larger white ring belong to the Cortez and Unaweep craters.
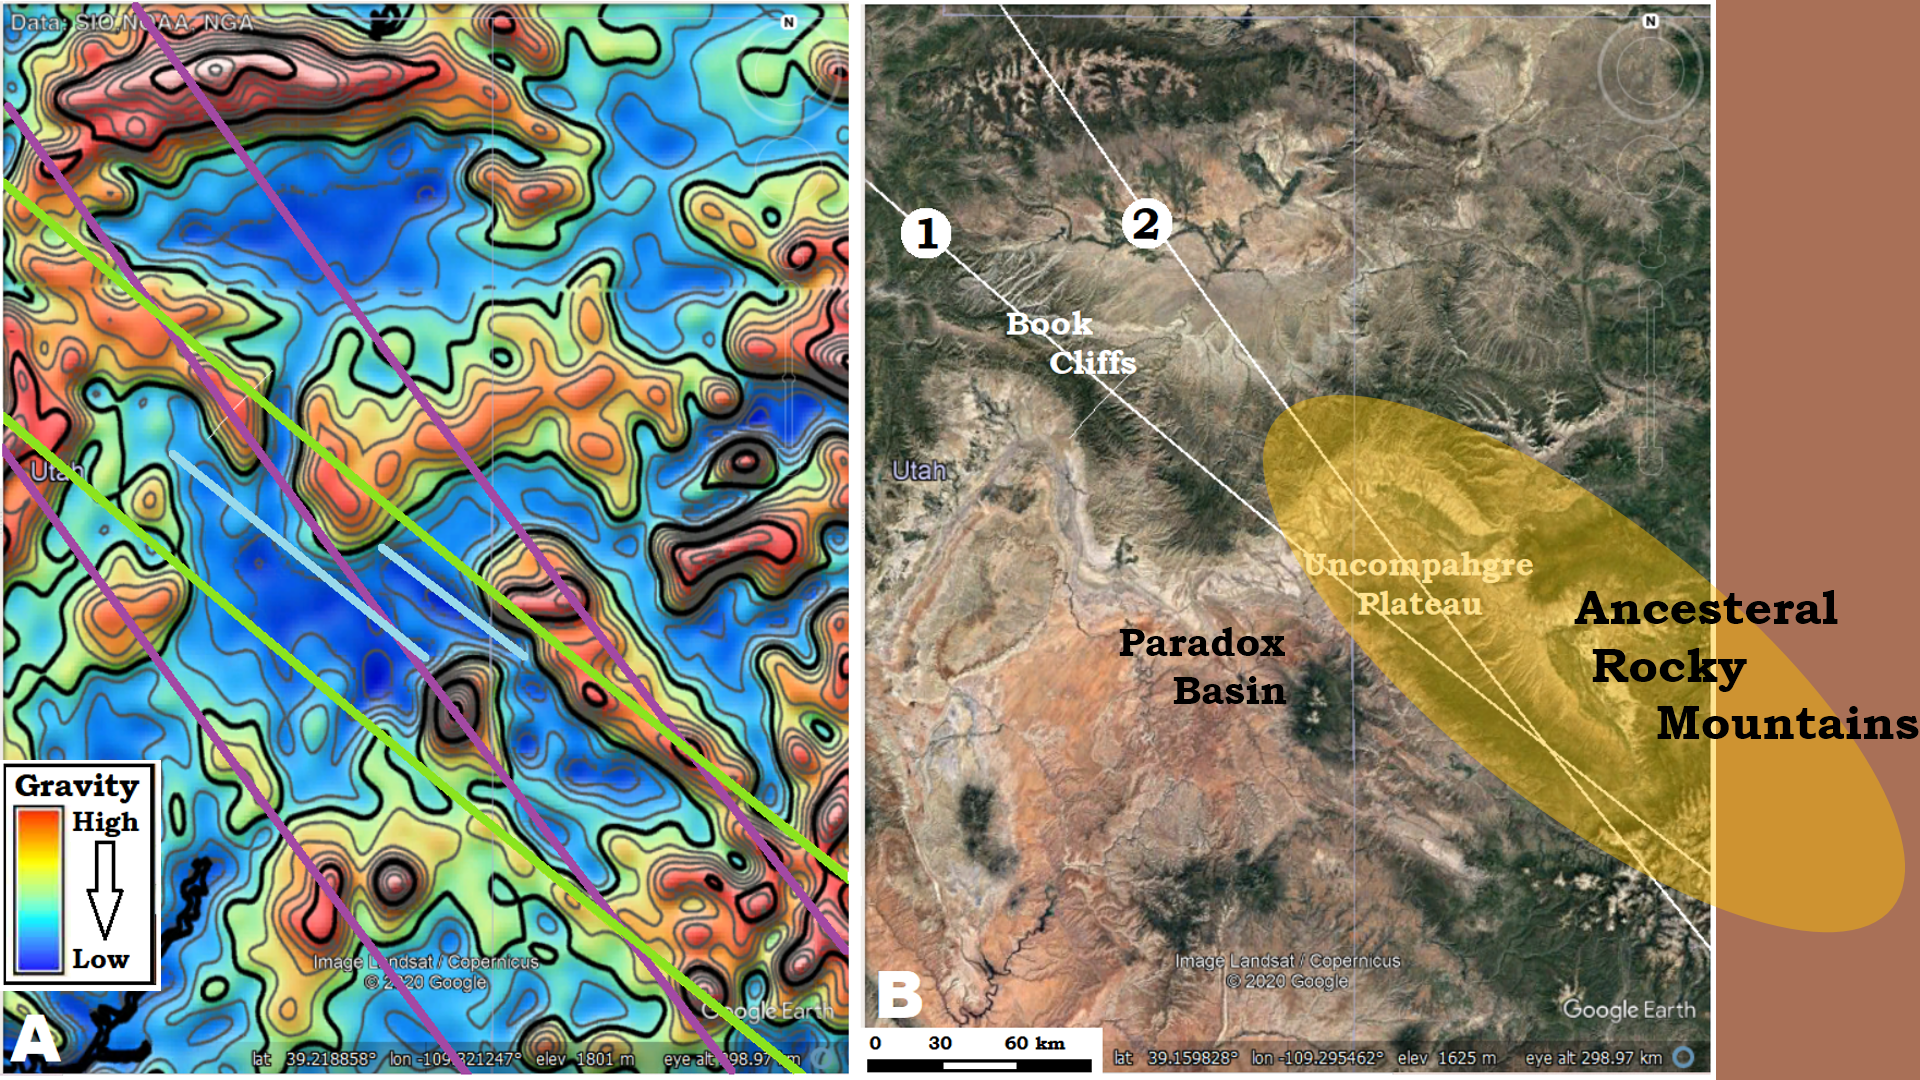 Figure 24: Secular geologist suggest the monoclonal gneissic dome Uncompahgre Plateau is all that is left of the Ancestral Rocky Mountain that eroded away to fill the Paradox Basin. By contrast I propose two CGRS are expressed in its structure. (1) is concentric to the Irminger shear center in the northern Atlantic Ocean, and (2) is concentric to the Tasman Sea, just east of Australia. The Irminger seems to be the first or primary CGRS to arrive as the Plateau thrusting up the southwestern edge, giving it a distinct slope to the northeast and placing the drainage divide at the top of the southwest edge. This is the wrong direction for sediment laden water to drain into the Paradox Basin on its southwest, and contradicts the popular explanations.
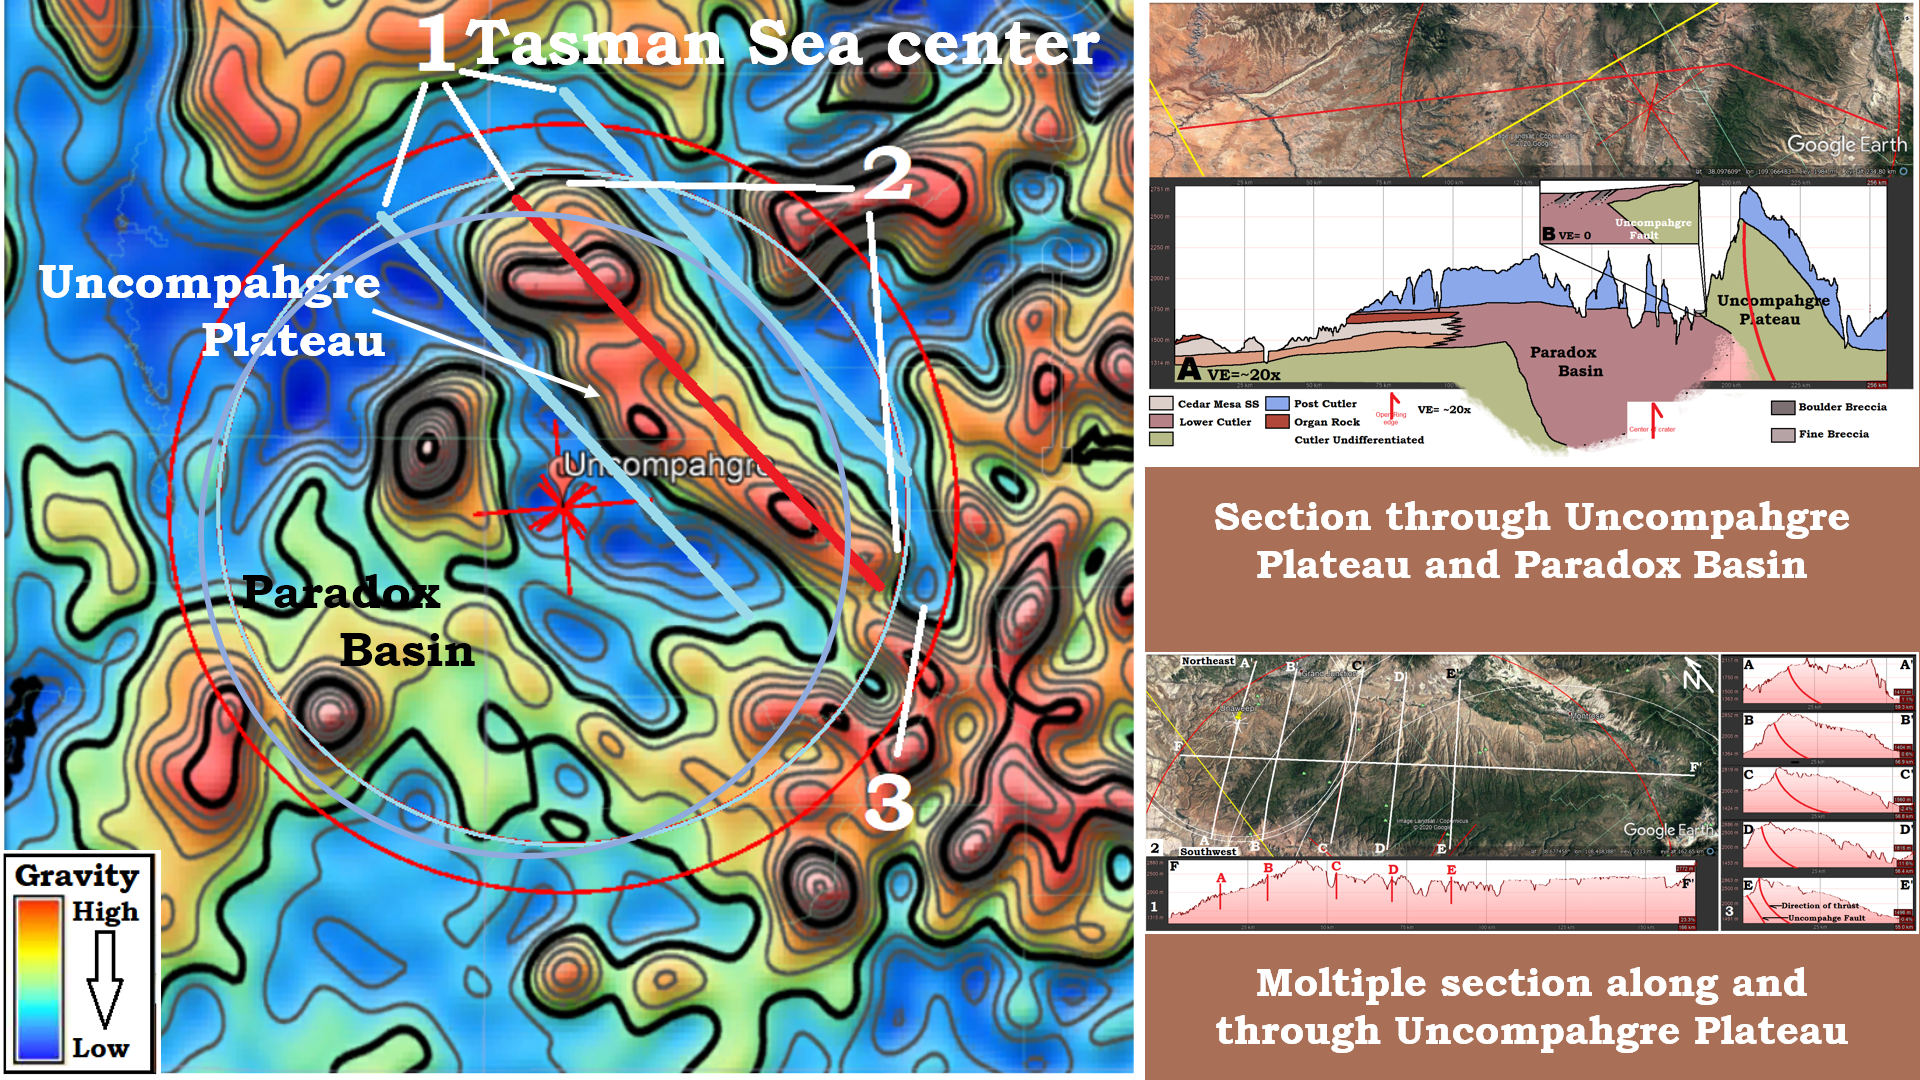 Figure 25: While the Uncompahgre Plateau may have gotten its profile from the Irminger CGRS, it got its linear shape from the Tasman Sea CGRS. The red linear down its center is a compression/shock-wave expression while the blue low gravity linear to either side is a Release-wave Valley. The Uncompahgre Plateau ends abruptly on both ends (2). I will propose that the plateau is a mascon for the Uncompahgre crater, like mascons on the moon (Chapter 10A and 16). The (3) separation between the blue-ring that defines the plateau’s ends and the red ring which is the Open-ring defining the edge of the uplift/rebound (Chapter 9). Wrapping the Open-ring around the Plateau provides the center’s location. Cross section emphasize the plateau shape in longitudinal Section F-F’, and the monoclonal shape in sections A-E with the direction of the Irminger up-thrust indicated in red curved lines.
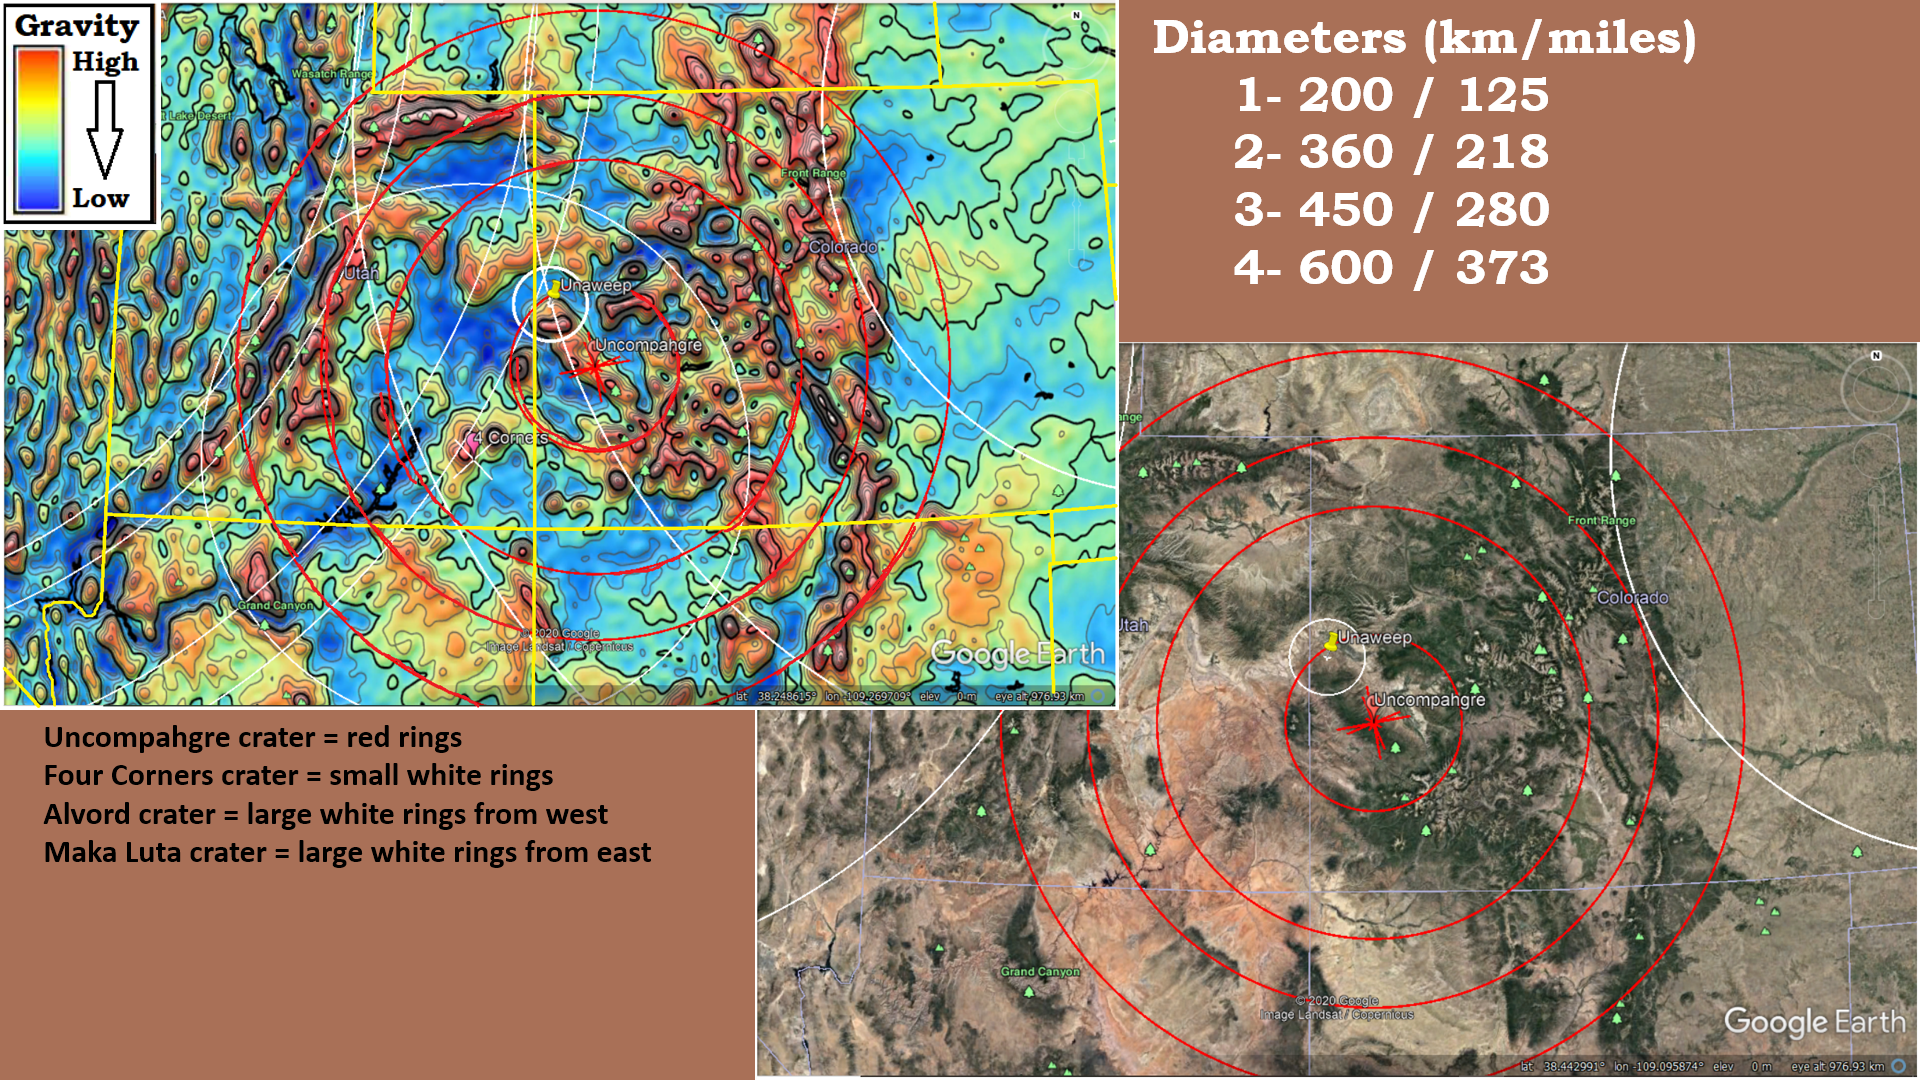 Figure 26: And, moving outward from there, the fourth ring shows a good conformation of a strong compression-wave seen in gravity. It was this ring I first picked out in the gravity map, and worked my way inwards to first identify the plateau as a mascon.
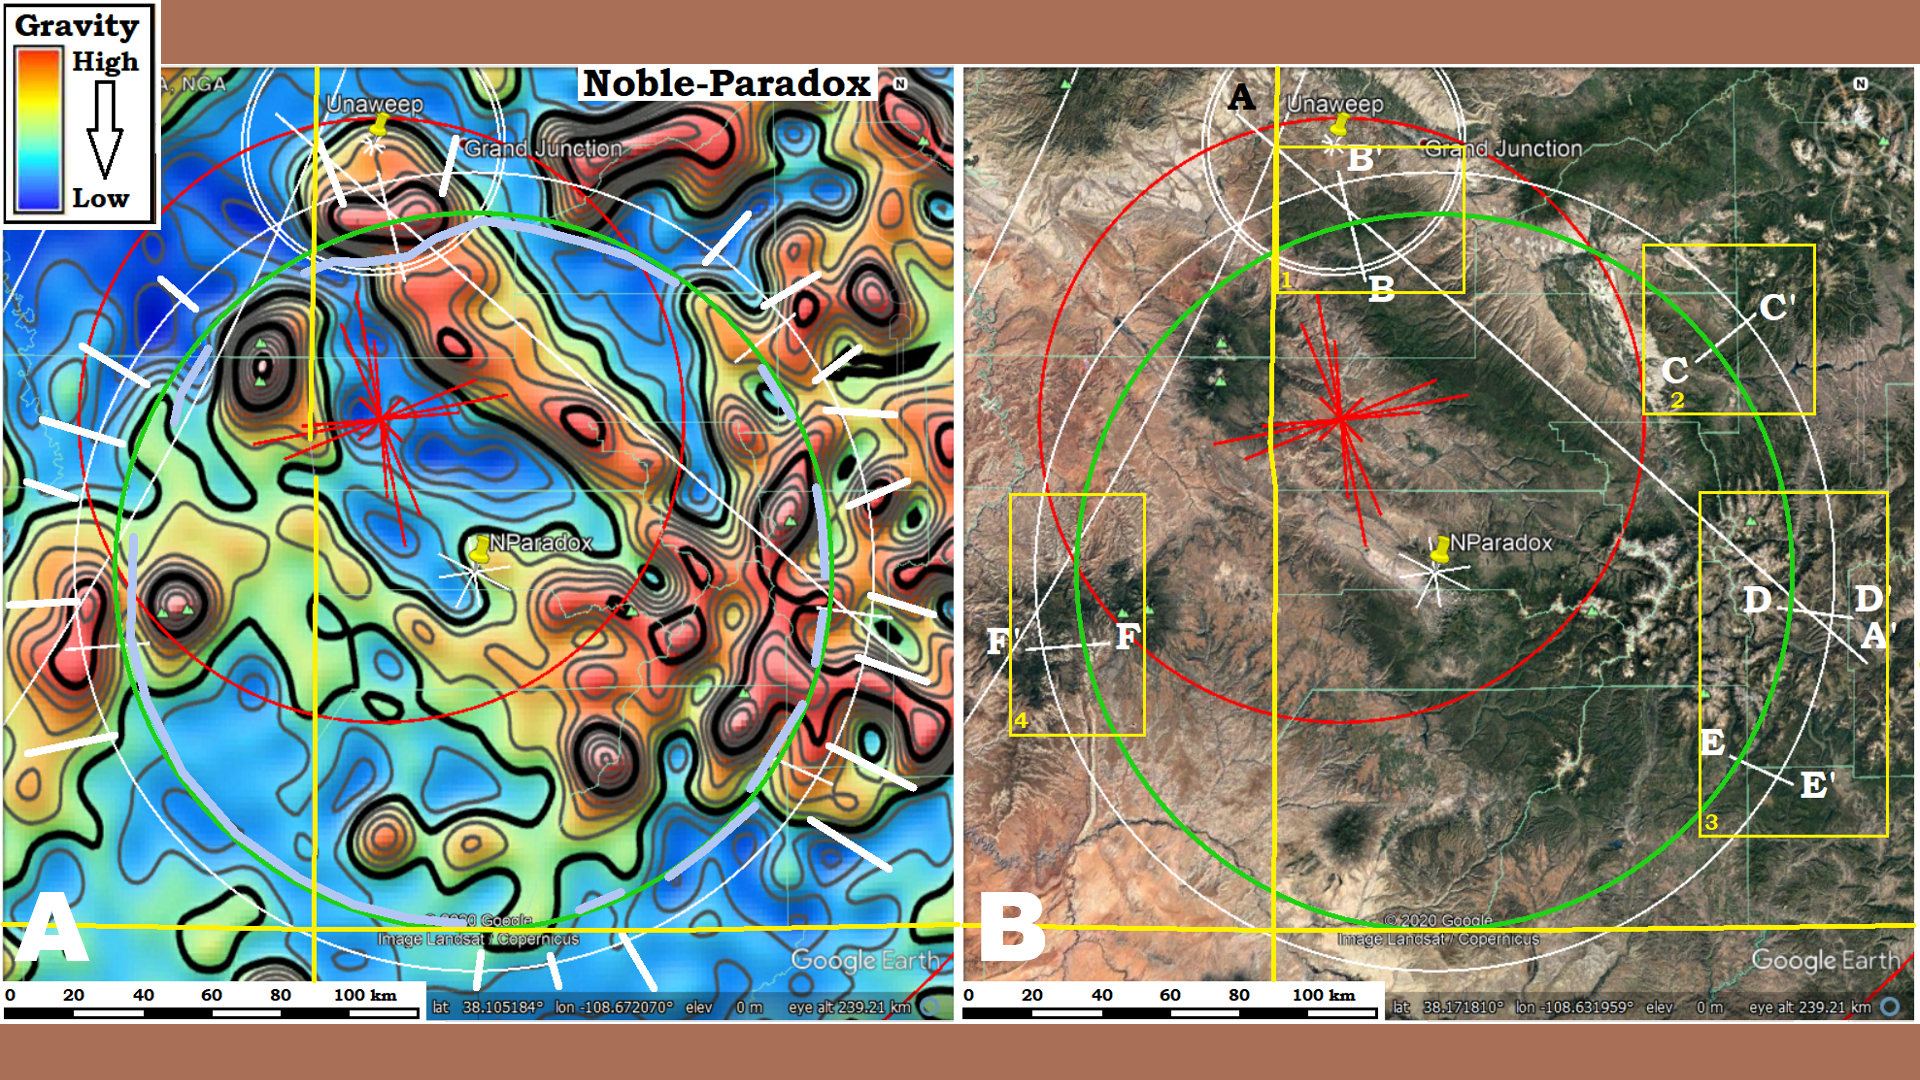 Figure 27: While we saw the Gulf of Mexico crater in Gravity maps and conformation in seismic sections and the lithology of well cores,, we want to see the smaller craters in gravity and topography. Everybody assumes earlier craters were hidden and obliterated by later cratering. This is only partly true. If we are looking carefully, many clues to the cratering history of an area can be plainly seen in topography as well as gravity, for the larger ones. The Noble-Paradox crater is a good example. Only about 120 km/75 mi diameter, the rings can be seen in image-A by points of change in the gravity measurements indicated by the inner end of the while lines. Pale blue sections on the green-ring indicates sections of lower gravity produced by the release-wave. In the topographic view, the rings are not nearly as visible, until be get down to the detail. A-A’ is the Irminger CGRS that defines the plateau, shown in Figure 25, but sections B-F are sections through low points on that release-wave where it had a good chance to leave an imprint.
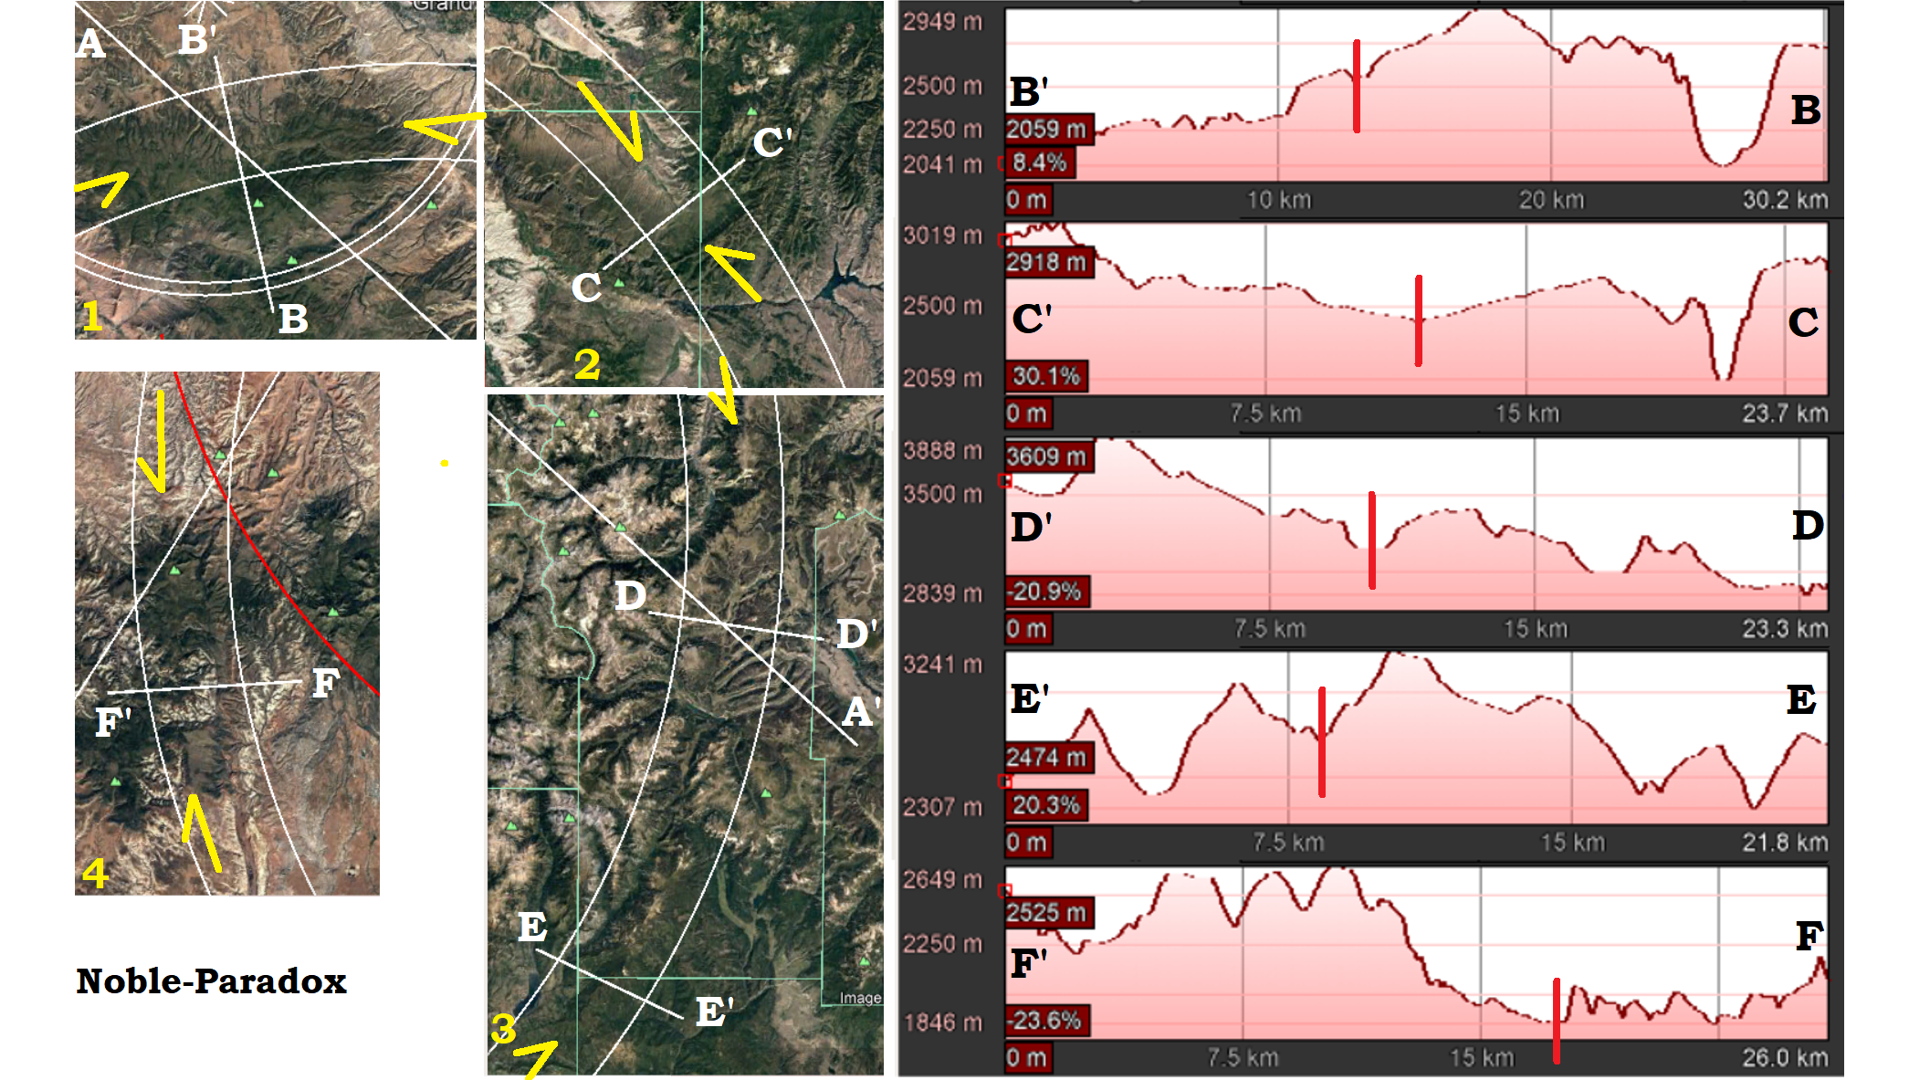 Figure 28: Looking at the four detail areas from Figure 27 a distinct line is seen in the topography between the two white rings and they all correlate to distinct troughs in the elevation profiles of the individual sections. Sections B and F that do not show the distinct lines, they still show the presence of a trough, though less distinct. No geologist would relate these different portions of a single ring trough if they had not first identified the ring of the crater, but now that it has been identified, it can not be unseen.
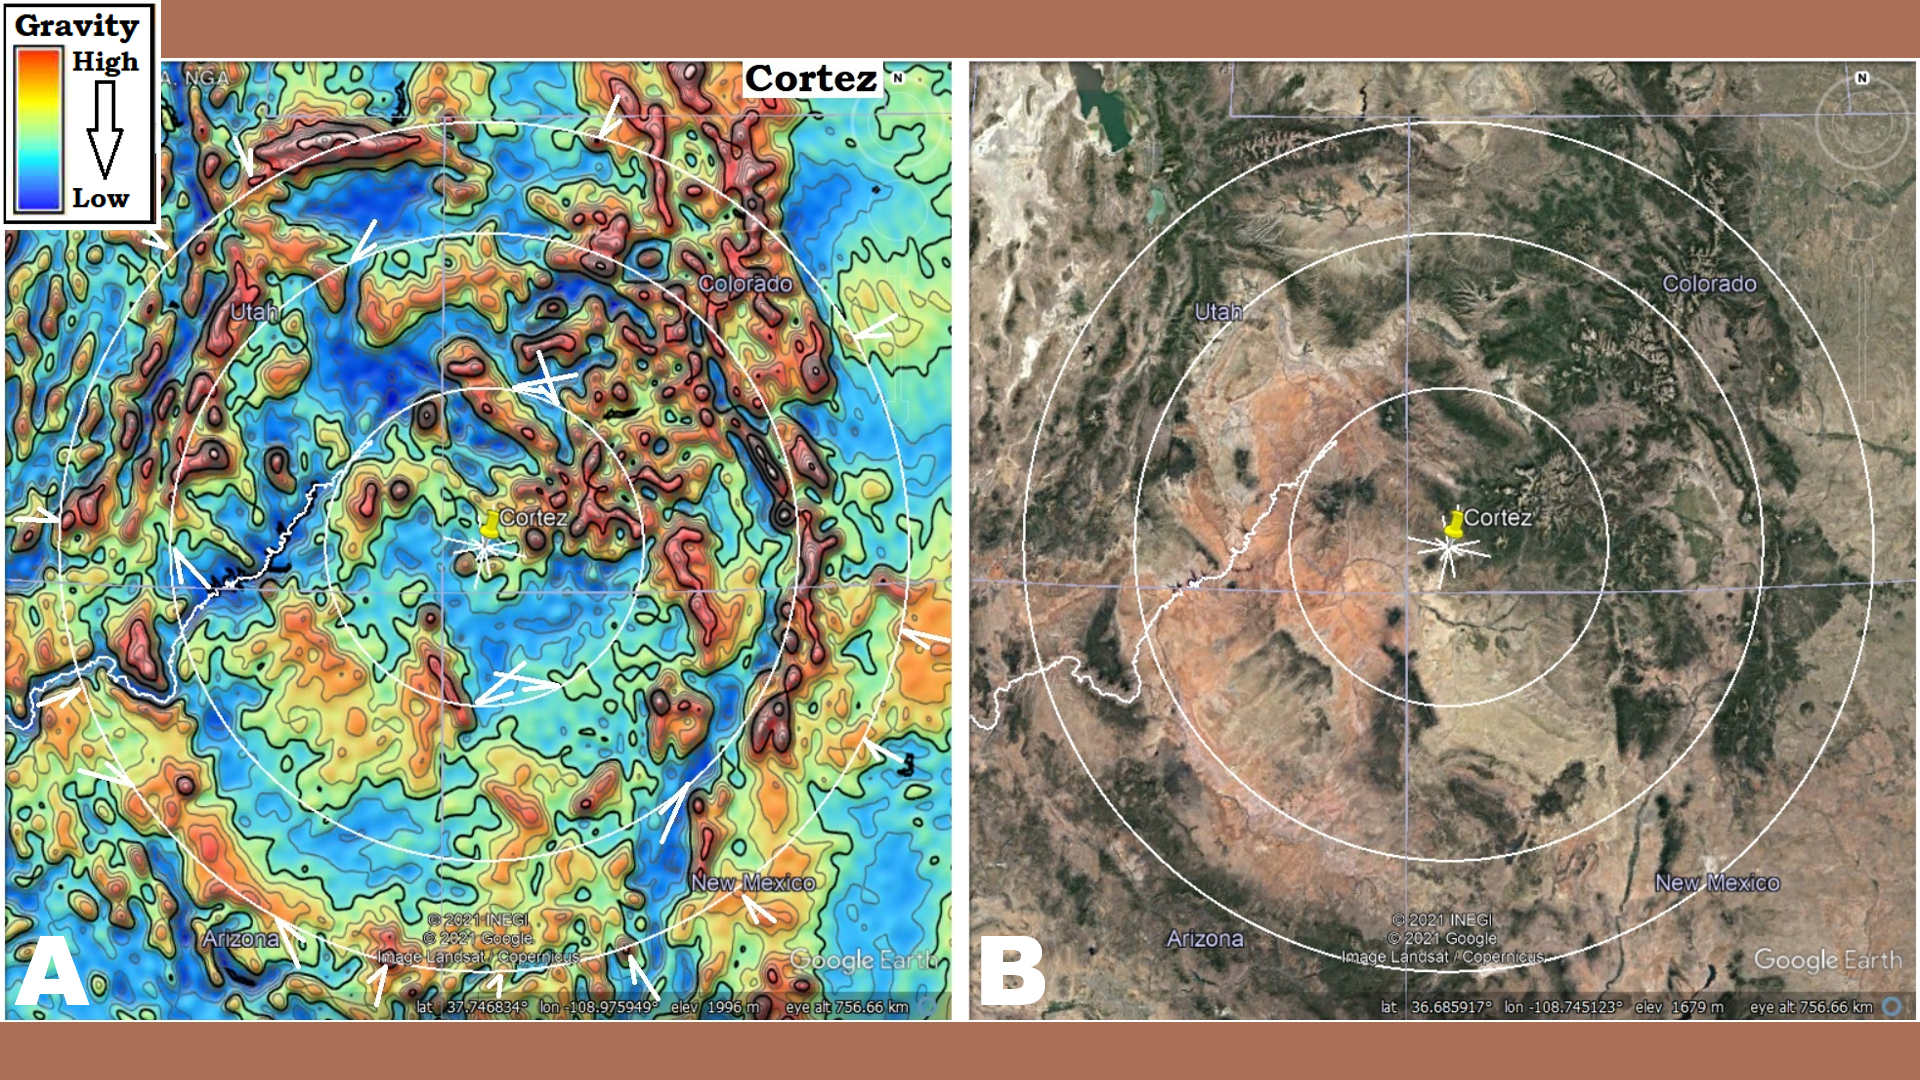 Figure 29: The Cortez is another crater that shows up in the same general area. Pairs of white arrows point to visible high gravity ridges of the rings. Open-ring = ~300 km/186 mi, OCR-ring = 580 km/360 mi, 2-ring = 800 km/500 mi diameter.
 Figure 30: An oblique view of the northern end of the Uncompahgre Plateau with a dark band corresponding roughly with the north side of the Unaweep Valley showing across the upper half of the image. Just below the middle, what looks like a flat topped hill with sloping sides can be seen. Image-B show circular lineaments of the Cortez crater correspond with many of the dark linears, as well as the location of the turner Gulch crater.
 Figure 31: If we look carefully other craters can be seen in the center of the same area. But, you say they are not obvious to you. Maybe that is because you have not looked for and located the details that make them visible.
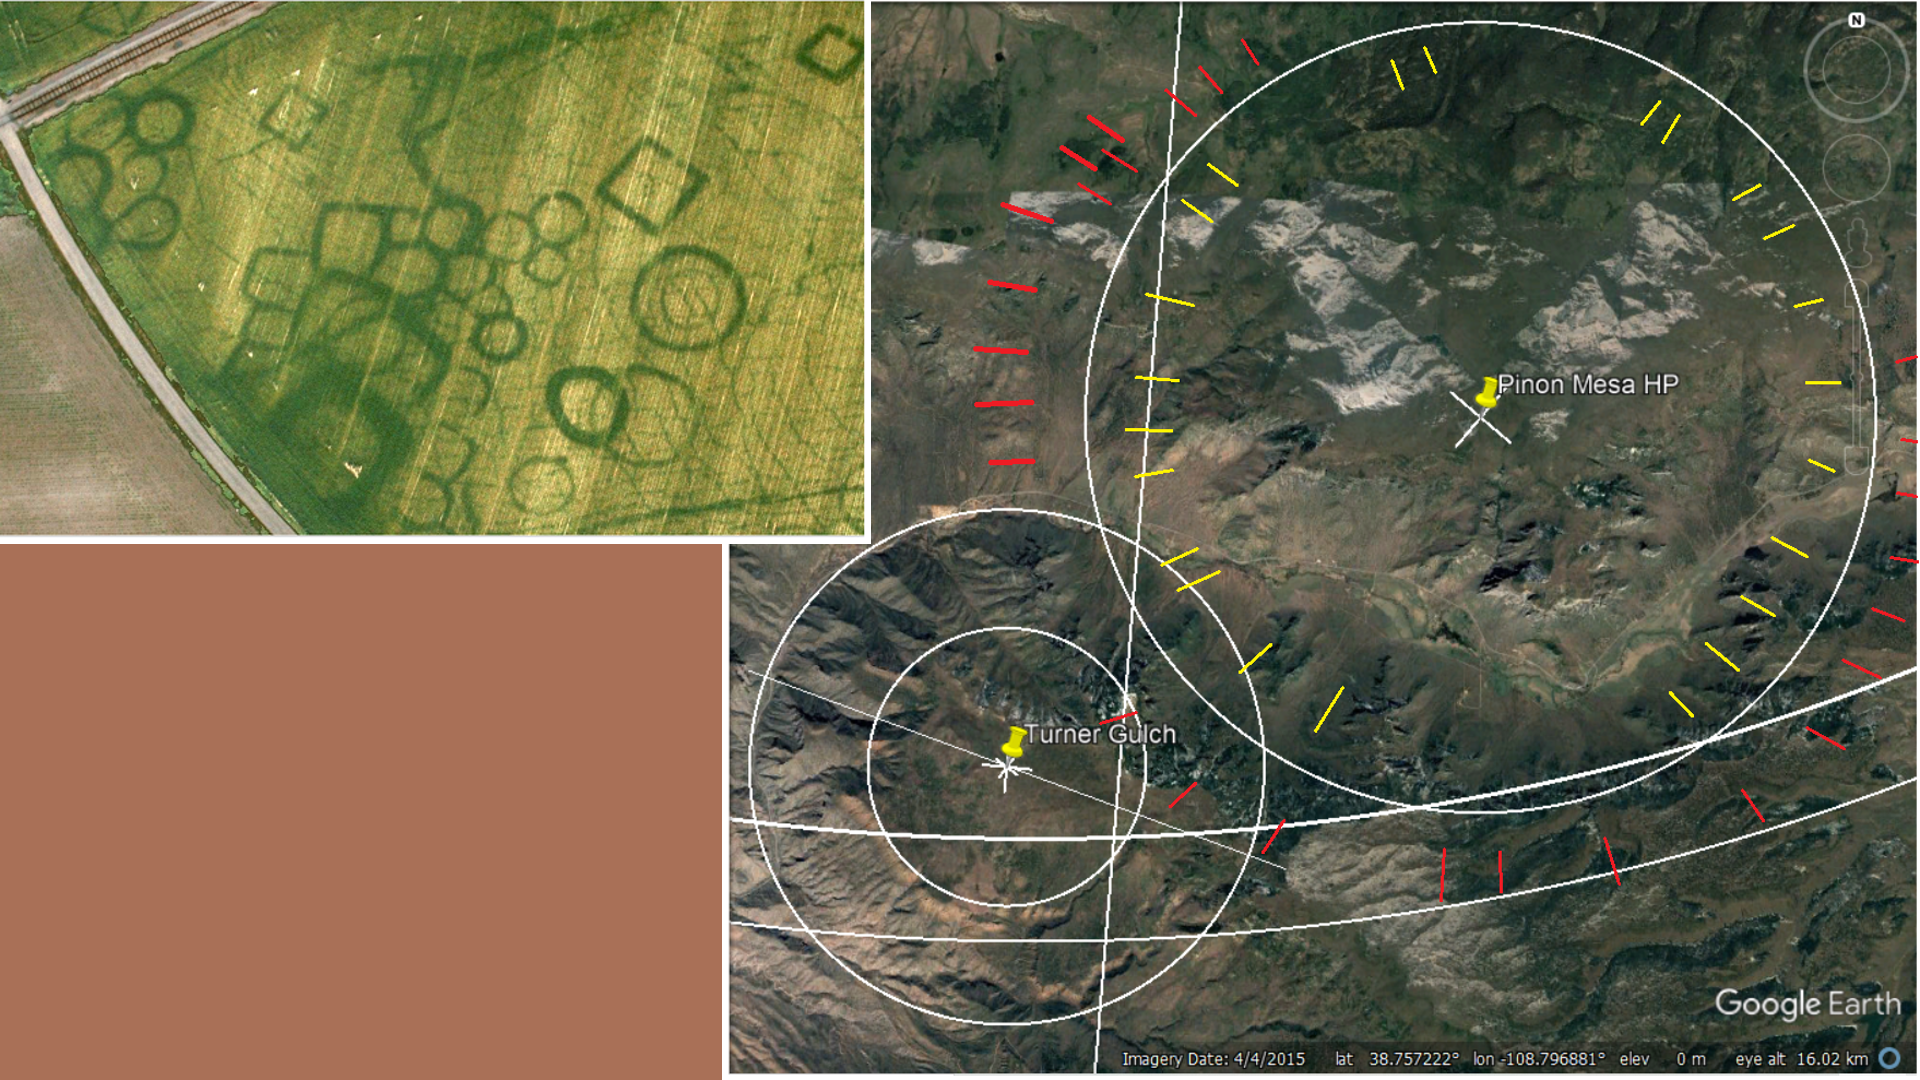 Figure 32: Crop-marks are a well-respected method for first identifying stone walls and fortification ditches under an agricultural field. These historic alterations in the landscape have caused conditions for greater or lesser plant growth or longevity that the archeologist can exploit to locate the historic traces. Similarly, subtle differences in density of the rock produced by the difference of expression between the compression of the shock-wave, and the resultant adiabatic dispersion within the release-wave, provide patterns that can be exploited in plant growth. Whether the circular ring under the white circle of the Pinon Mesa HP crater, indicated by the end of the red and yellow lines, is a ring of denser rock, or less dense rock? Whether it supports greater plant growth or is dark because it is barren? Or whether is has a mineral that restricts or encourages plant growth? These are all questions that need to be answered, but that the ring exist and has a probable connection to a shear point at its center seems obvious. I have given it a name for reference, and suggested it is most likely a small crater (not from the model used by NASA, but my understanding).
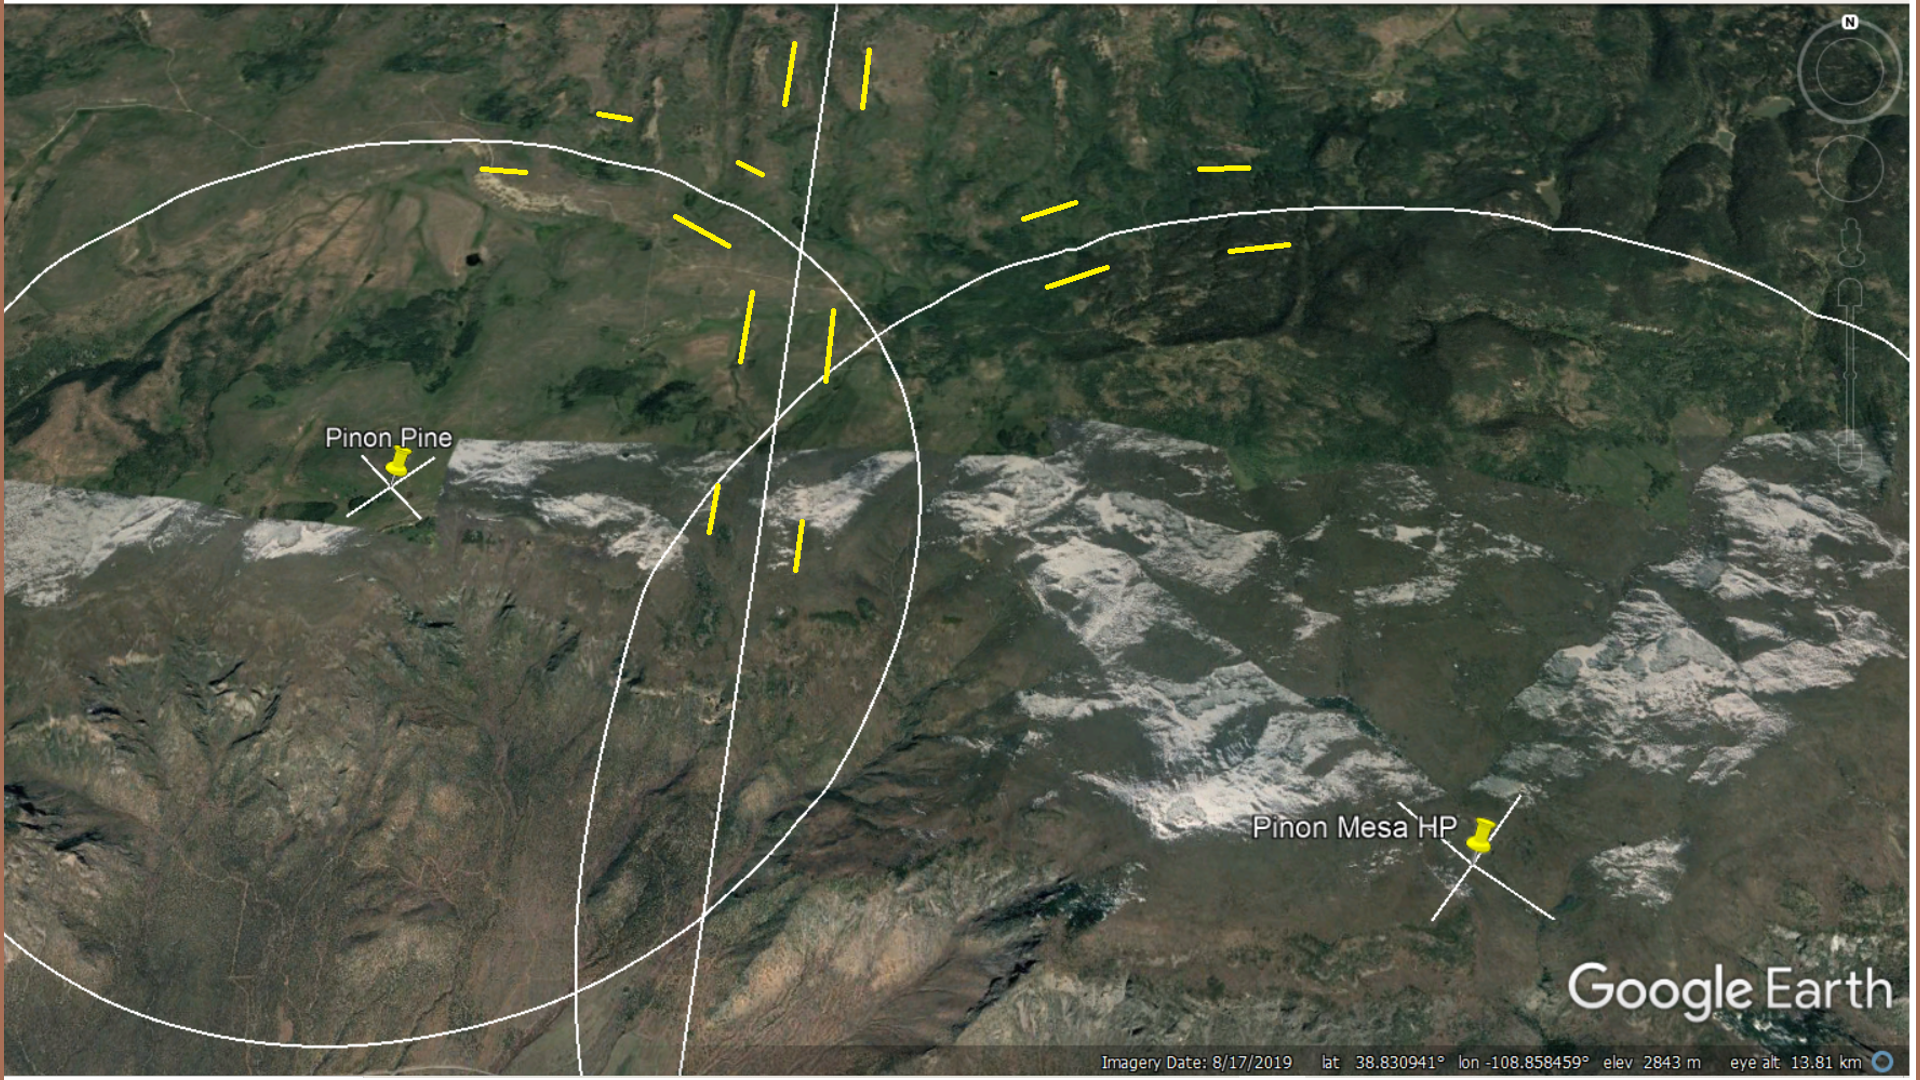 Figure 33: Yet these “crop-marks” are not unique to this single circular structure. The Pinon Pine circle to the west, and a line, which is a CGRS to the Ascension shear center in the South Atlantic Ocean, all left very visible crop-marks in the same area. Something was happening specifically in that area to encourage production of the tell-tell marks. I would propose the extra energy put into the plot of substrate by the Cortez and Payne crater, Figure 31, is certainly partially responsible.
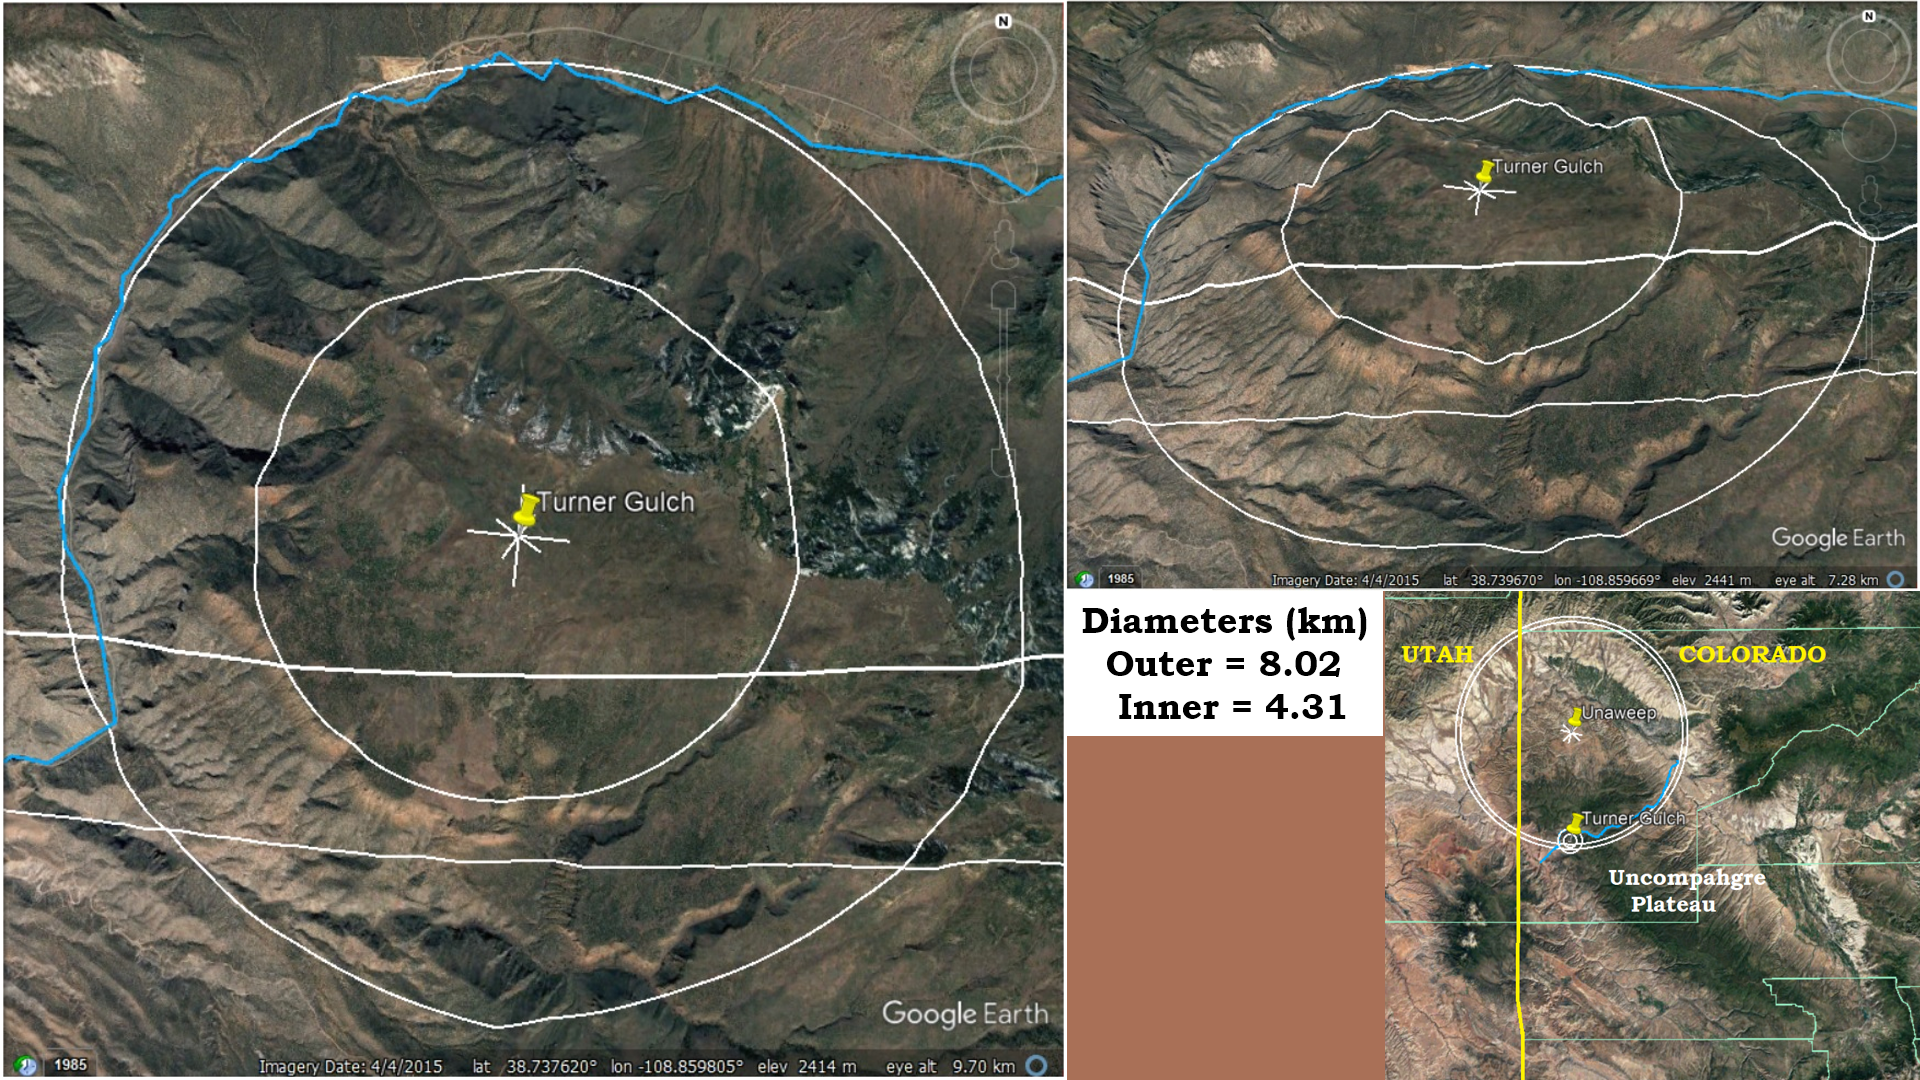 Figure 34: Many individual authors have speculated which river eroded the Unaweep valley across the northern end of the Uncompahgre Plateau. Chapter 1 in my book suggest the Unaweep crater’s release-valley was majorly responsible. That no river or flowing channel of water had anything to do with the erosion of the Unaweep Valley. This short slideshow has shown that once the Uncompahgre Crater had raised and isolated the Uncompahgre Plateau, several other craters, including the Cortez and Noble-Paradox craters, contributed to the total energy pattern expressed in the area of the Unaweep Valley. All of these craters are much larger than the Turner Gulch crater. The blue wiggly line is the path of the two shall creeks that presently flow from the center of the canyon to its ends. While the eastern half of the blue wiggly line conforms to the Unaweep crater’s release valley, with its white linear extension to the west indicated by the two parallel/concentric lines passing across the southern half of the Turner Gulch circles. But, the western end the Unaweep canyon does not conform to the rings of the Unaweep crater, but rather the much smaller outer ring of the Turner Gulch crater.
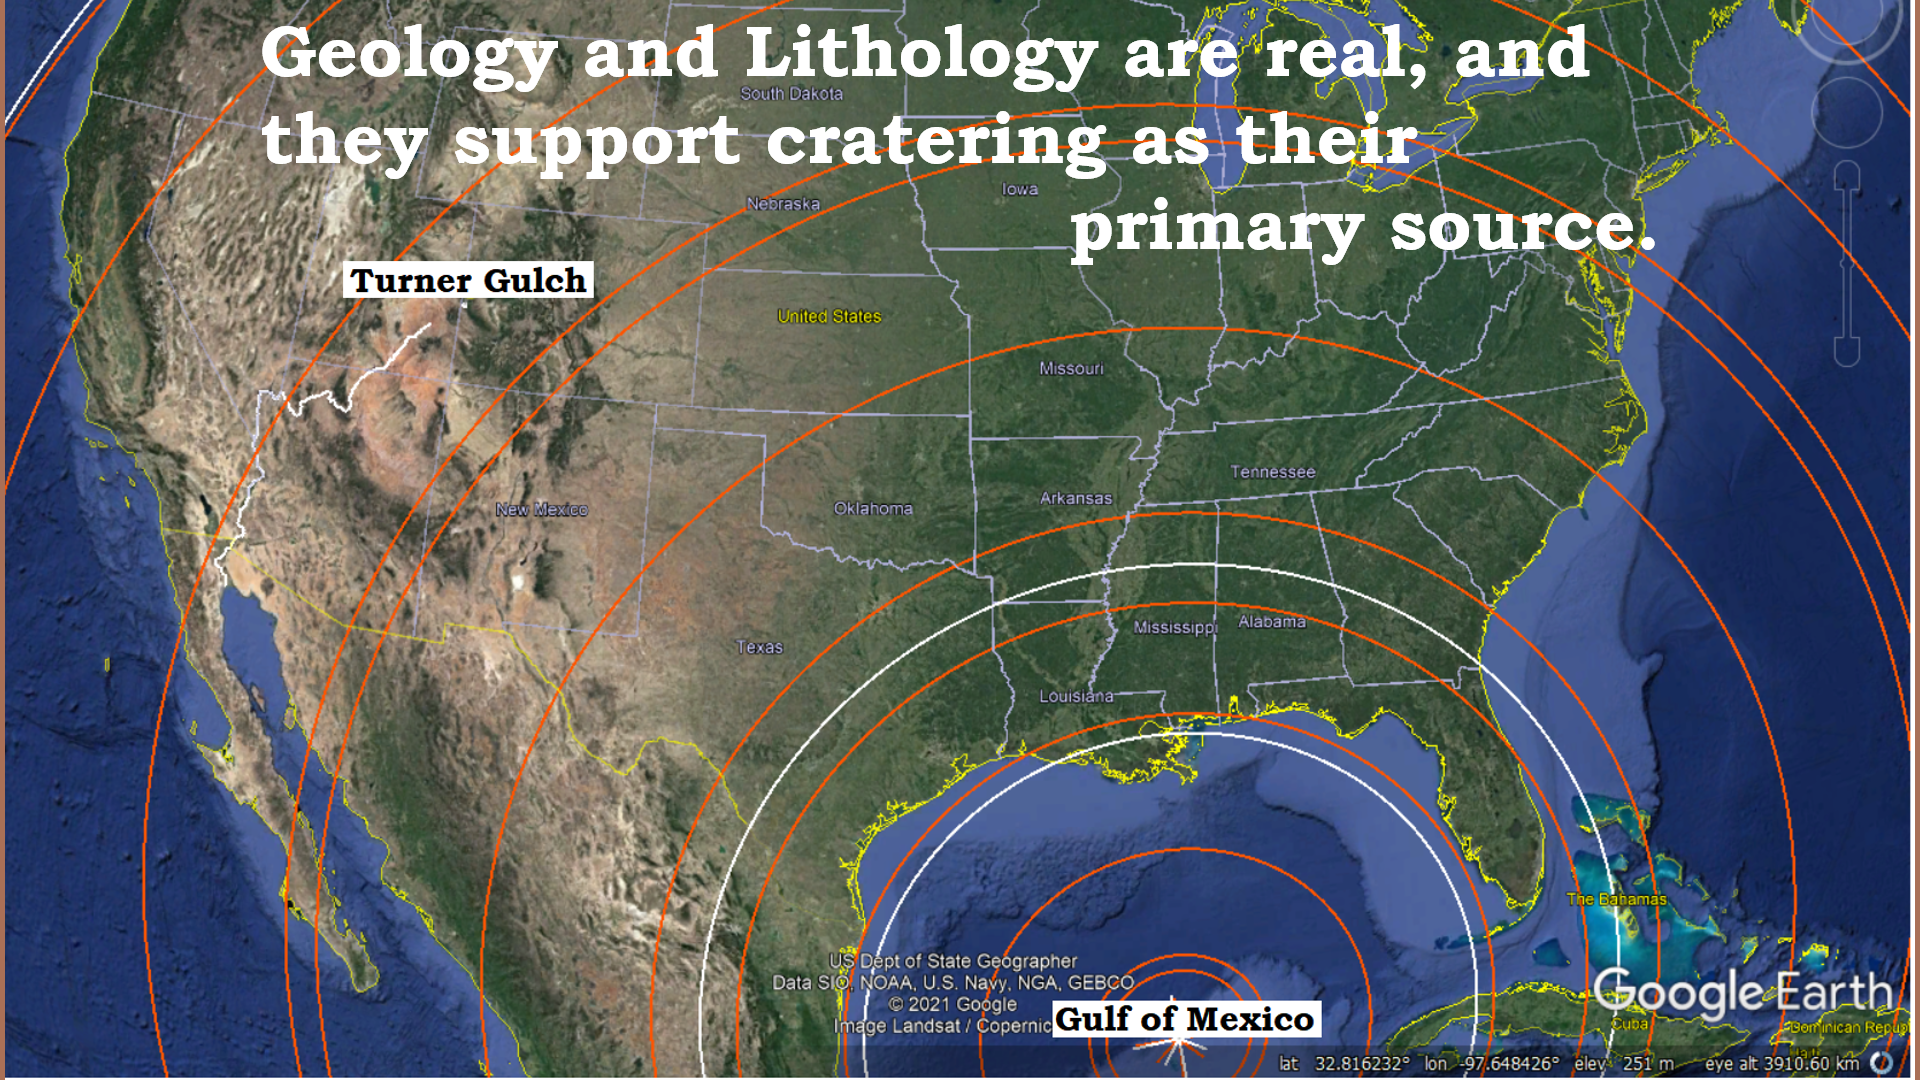 Figure 35: No matter whether the crater involved is as large as the Gulf of Mexico (4,550 km/2830 mi diameter) or as small as the Turner Gulch crater (8.02 km/5.0 mi diameter) when we understand the cratering behind the shear that produces the ridges and valley, the twist and turns of the mountains and river, we will start better understanding the lithology and all that it can help us understand about our Earth.