 There may be no other plot of ground so often used to illustrate many of the geologic processes espoused in textbooks than the Grand Canyon. Geologist talk about it like they have the processes all figured out. Is it just possible that they have gotten it all wrong? This presentation is going to suggest unimaginable cratering was responsible for everything we see in the Grand Canyon, from the rocks, the sequence, the faults, and the actual canyon. None of it got there by geological processes we can see happening around us today. We will question if some of the processes even work the way everyone has assumed they would. Gentle reader, do not be afraid to questions the rocks, the processes, even my model, but above all, question the assumptions both you and I have made. Our God is a God of mystery, but He is also a God of Knowledge. And in knowing, He is worthy of our praise.
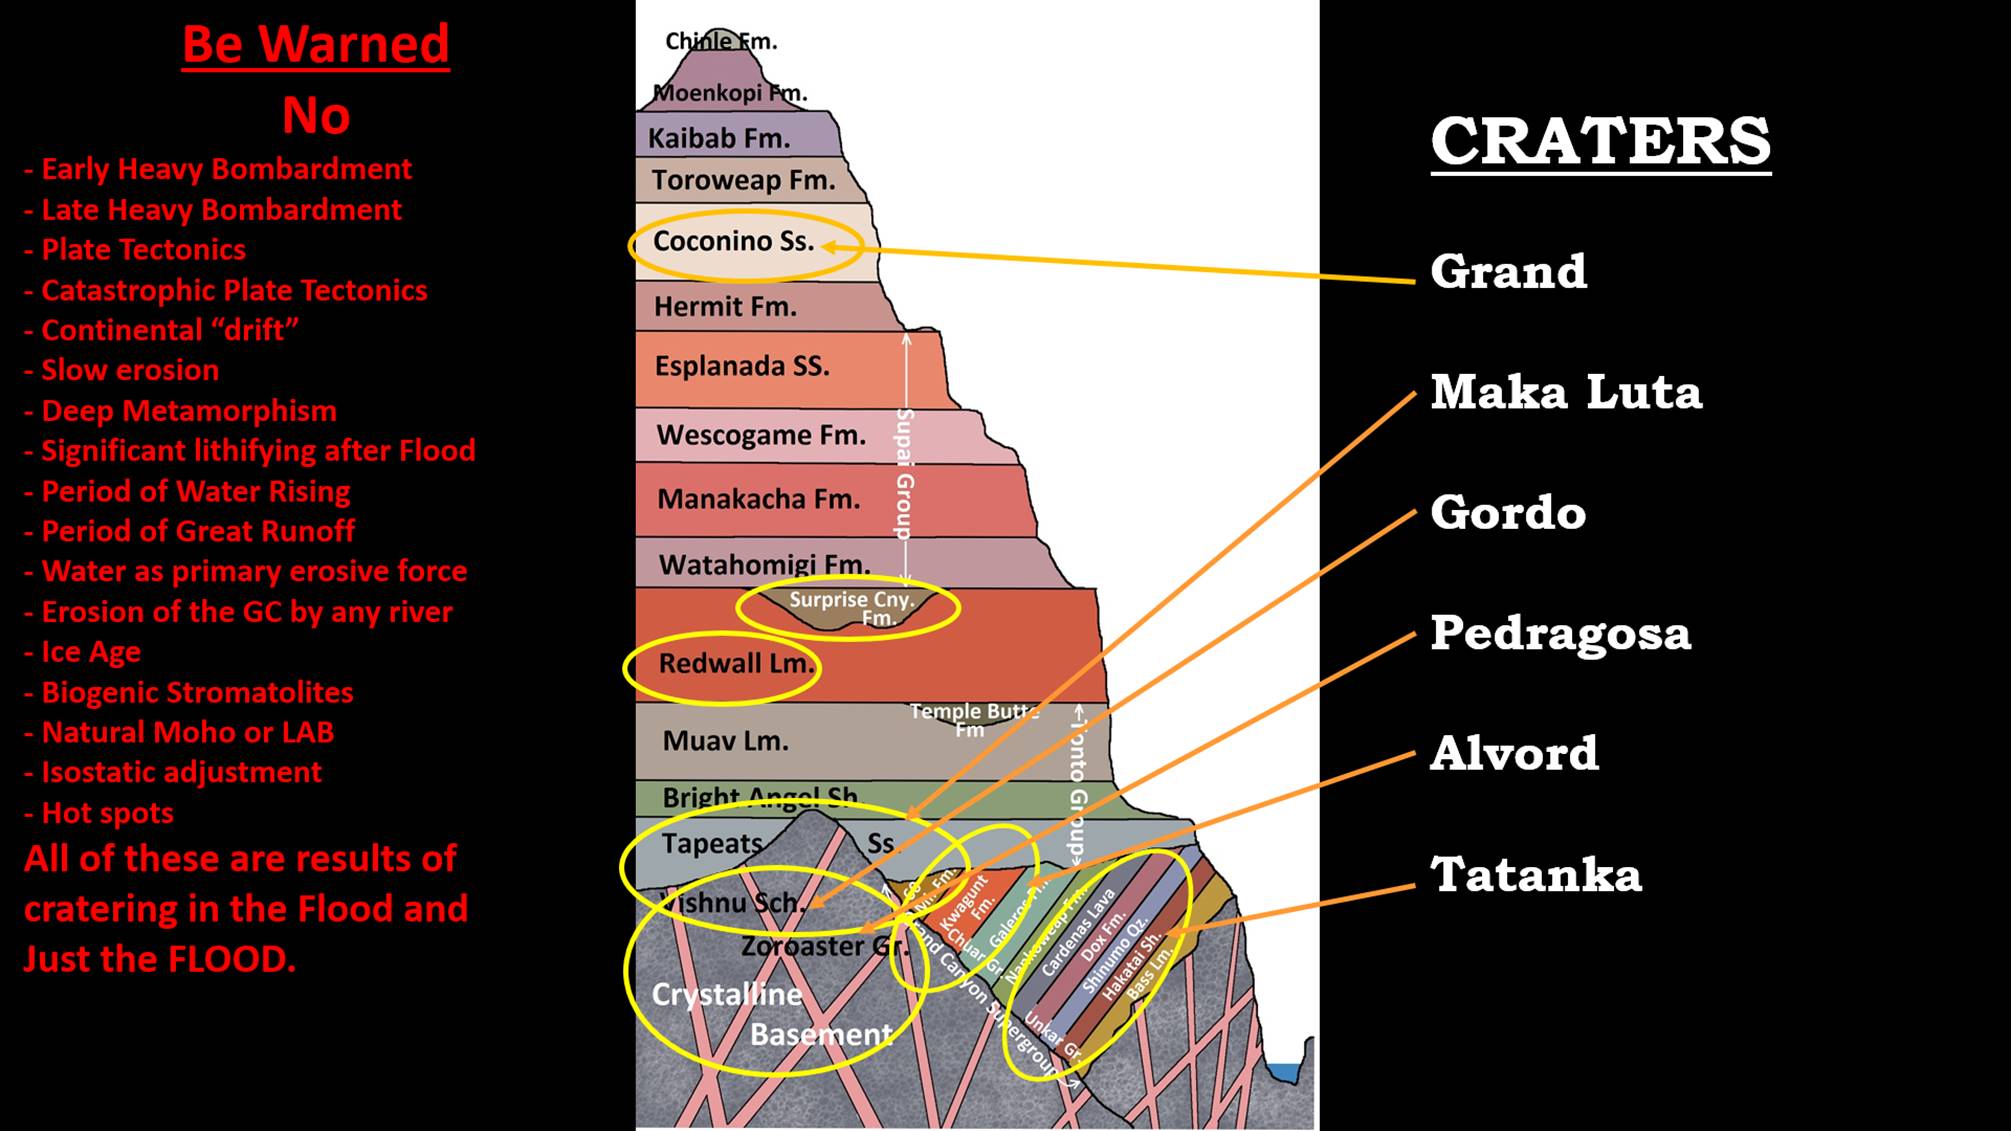 Figure 1: Any reader may question why a discussion of the Grand Canyon would start with looking at the northern edges of Canada. We share a common continent with the northern reaches of Canada, and we share the results of those early cratering processes. One of the earliest mountain building events was the Sevier Orogeny, which extends from northern Canada down to the Grand Canyon. While the canyon is not normally included in the orogeny’s events we will see that it springs from a common point of origin. While it would be convenient to start in on the deepest strata in the canyon, the Crystalline Basement, we must first look at the cratering process to define our terms and understand together the foundations of our discussion.
 Figure 2: How do impactors form their crater? Shoemaker in 1973 looked at the Meteor Crater and saw a hole very much like the Teapot ESS crater that had recently been blasted in the Nevada nuclear test site. But nuclear test are routinely buried in deep shafts so that the dirt fallback buries a significant portion of the radioactivity. Between step 6 and step 7, he envisioned the conversion between the shock wave to the release wave generating a lot of projectiles which were ballistically ejected in step 8. The fallback from this ballistic ejection builds a crater rim of fallback as well as largely filling the crater.
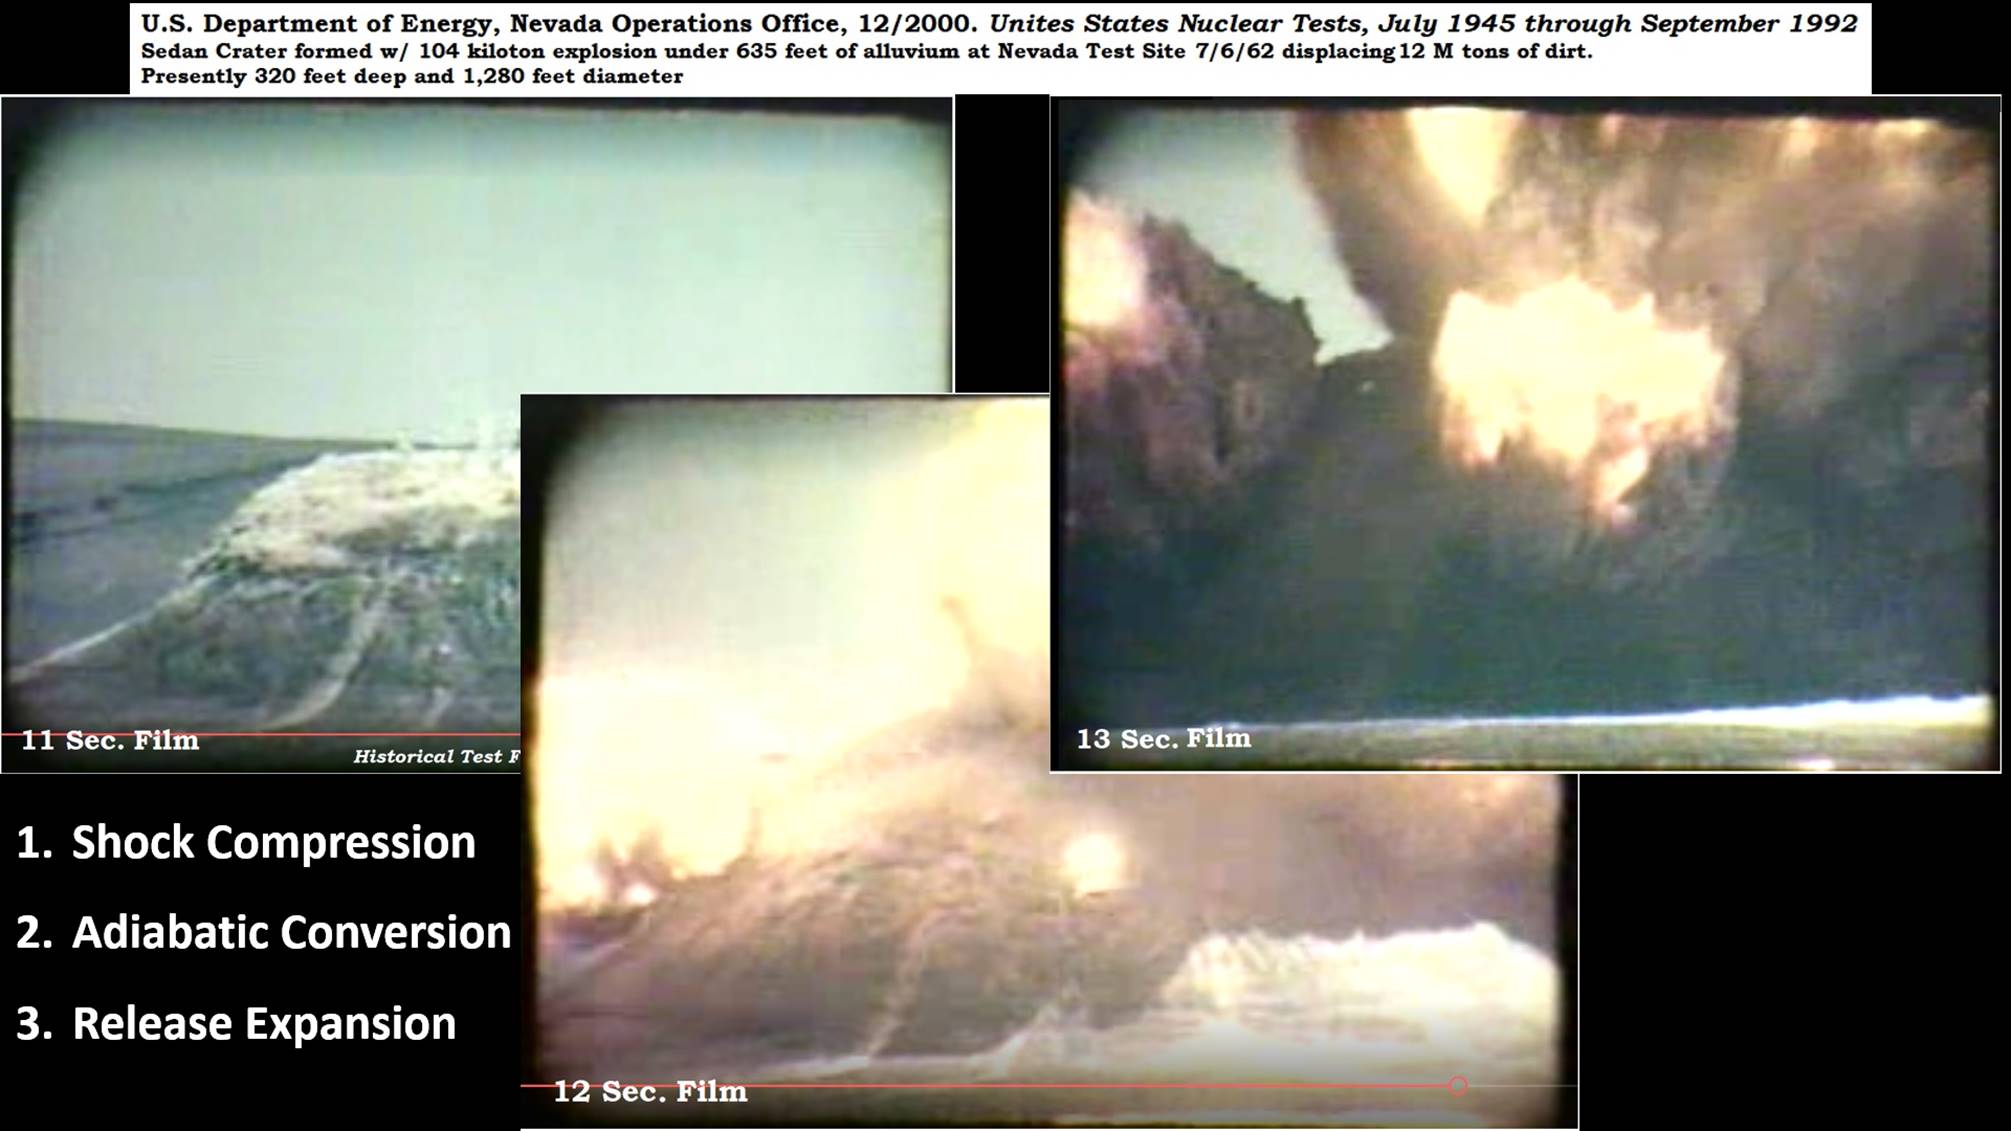 Figure 3: Looking at the documentary footage from the Sedan Nuclear Test in 1962. This test was conducted with a 104 kiloton explosion under 635 feet (194 m) of alluvium. Times on the images is running time. Narrator said the third image was approximately 3 seconds after ignition, so film footage was exposed faster than shown. Fist image, a matrix bubble is seen to be forming below ground, and in less than a second the bubble is seen to be bursting with flames of energy, until the heat release consumes the bubble shell. The Shock wave was sent out with the original ignition. As it converts to the Release wave tremendous amounts of the original compression wave is converted to heat because it is released to rapidly to travel in an orderly manner from molecule to molecule. This heat is the actual flames seen shooting out of the expanding bubble. Twelve mega tons of dirt were displaced largely because it was detonated at depth. The bombs over Hiroshima and Nagasaki produced NO crater because they were exploded slightly in the air for maximum destruction.
 Figure 4: In the Sedan explosion some chunks of superheated rocks produced steam or dust trails as the continued on their limited trajectory, designed to stay very locally to localize and bury radioactivity. The raising of the rim was not primarily a build-up of ejecta, but the sediments forced outwards into the substrate in the shock compression expression, the bubble seem swelling and rising in first image of Figure 3.
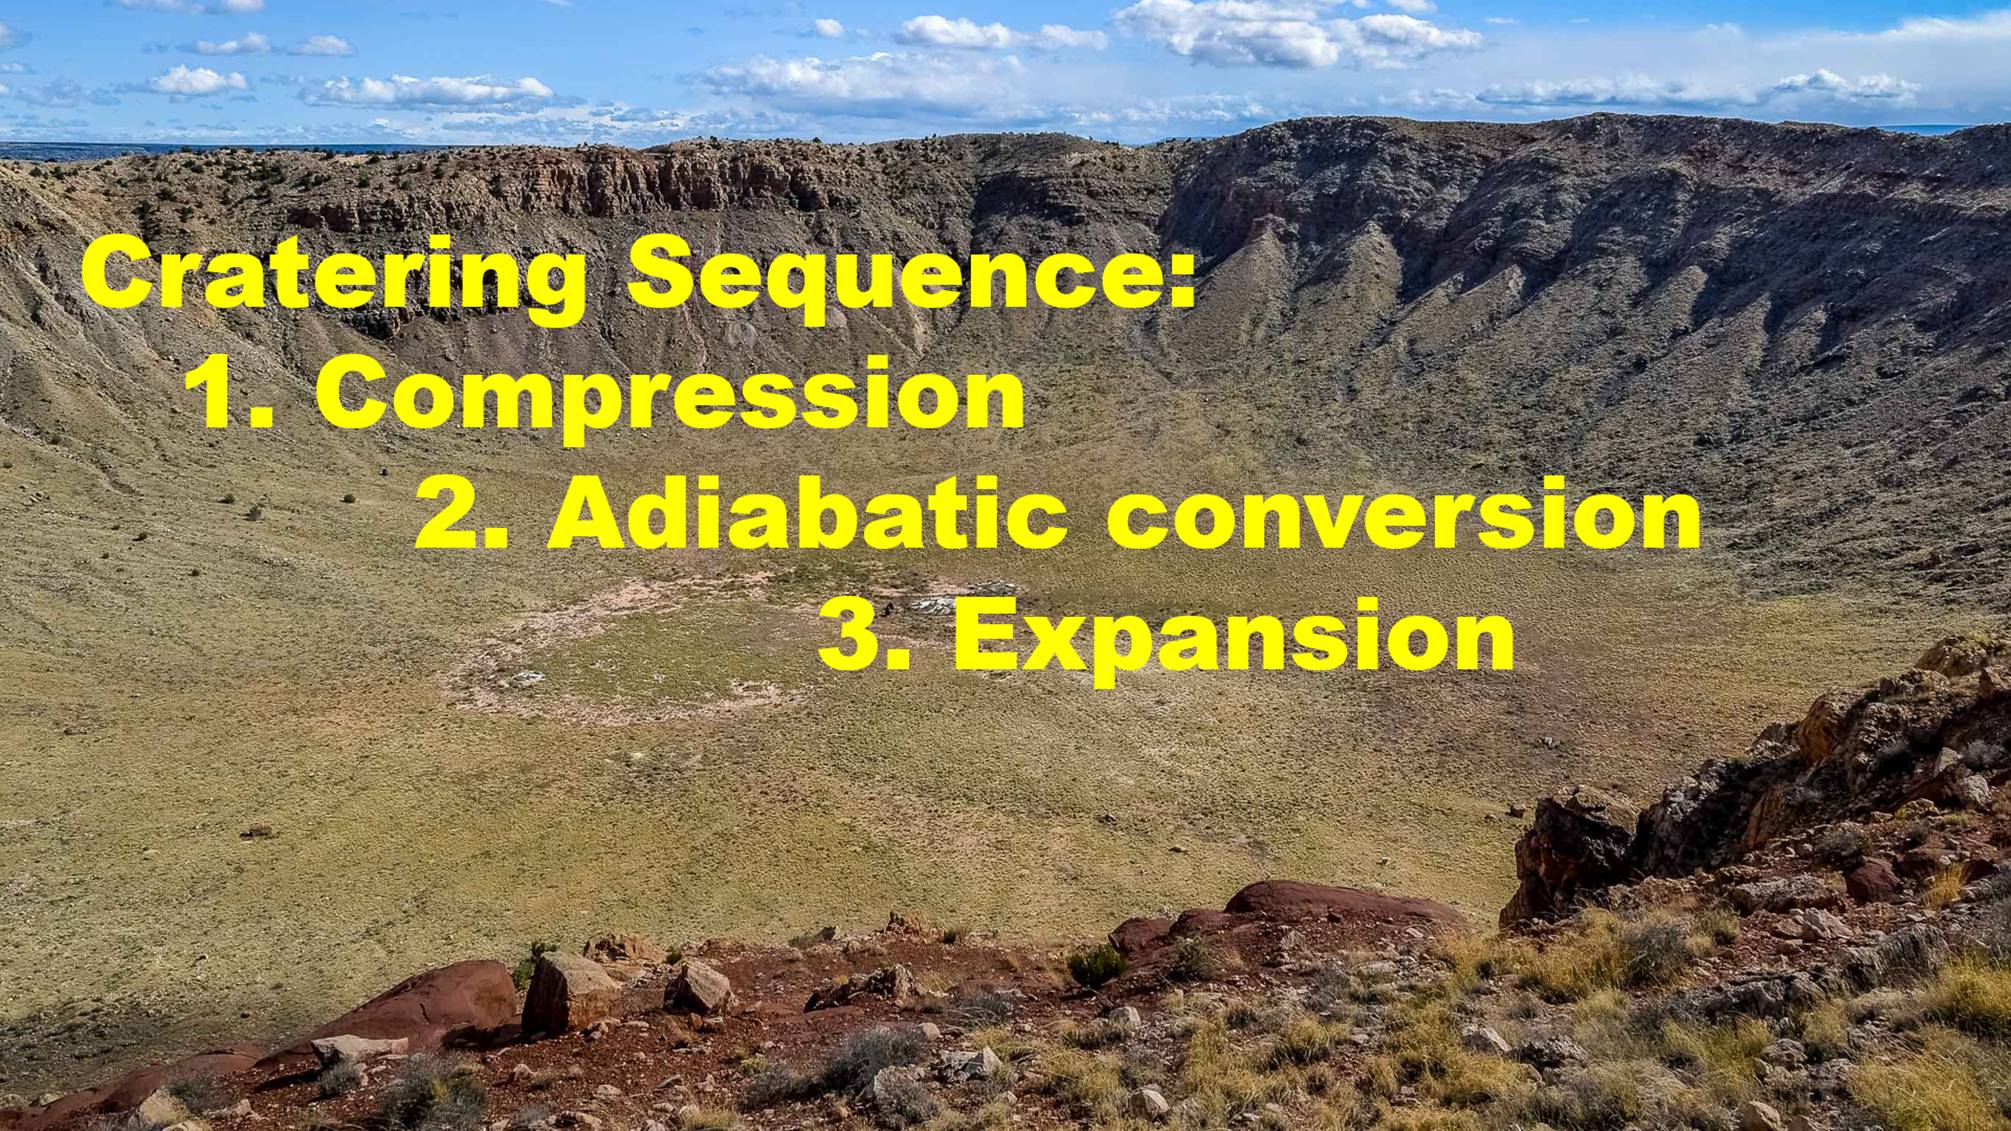 Figure 5: Central Arizona is the site of Meteor crater, also known as Barringer Crater; named for the family that owns it. Shoemaker developed his cratering model at Meteor Crater and NASA still uses it. Contrary to Shoemaker’s thinking, the rim was formed by lifting as compression forces some of the cratering material to retreat from the center of shear into openings between every particle of the surrounding substrate. A much thinner shell of earth than in the Sedan explosion formed at the far reaches of the expansion wave that then was pierced by a limited number of projectiles with a great release of heat. If we look outside Meteor Crater, this is a big hole, we should see some pieces of big rubble. We do not.
 Figure 6: The Google Earth view shows only a halo of small white rubble, extending to the northeast. This extension is called a “wind-streak.” Using Thermal Infrared image by NASA, the terrane is mostly Kaibab limestone (green) with many small patches of Moenkopi (blue), mainly to south and east. High silica Coconino (red) is the shattered white sandstone seen in Google Earth image. Most of the crater bottom and surrounding terrane still shows blue, the color for limestone in the infrared spectrum. That means the Kaibab limestone that originally covered the ground was compressed into the bottom of the crater, not blasted outward prior to the Coconino movement. The outer ejecta is primarily red in the TIR image and white in the Google Earth. The white ejecta is largely contained inside the blue arrow, and near the crater rim except where I have drawn linears through it. The linears represent fractures that opened up primarily along linear 1 and 2 through faults that opened up in the adiabatic conversion. I invite you to read Chapter 8 for a much more lengthy discussion of the evidence. The downward COMPRESSION forced breccia, produced by the ADIABATIC CONVERSION, down into the fractures. The resulting EXPANSION pushed up the rim and sent breccia out by the fractures beyond the rim through these linears. Primarily, the rubble is contained within the original rim, but the heat and pressure converted breccia radiates outwards by ejection through fractures. I expect this to be the pattern in all craters except the expression of heat/energy will be proportional to the size of the impactor and resultant crater. The crater bowl produced by some large craters would not be produced by ballistic excavation but compression, and the bottom (Moho) would be surfaced by recrystallized melt from that crater. While in college I witnessed the ignition of 13 sticks of melted dynamite in a grazed field of dry winter wheat. It blew the top and sides of the wooden box to splintered and compressed a 5 foot disk of earth with the box bottom about 6 inches, but left the wheat stalks under the lid only flattened on the surface.
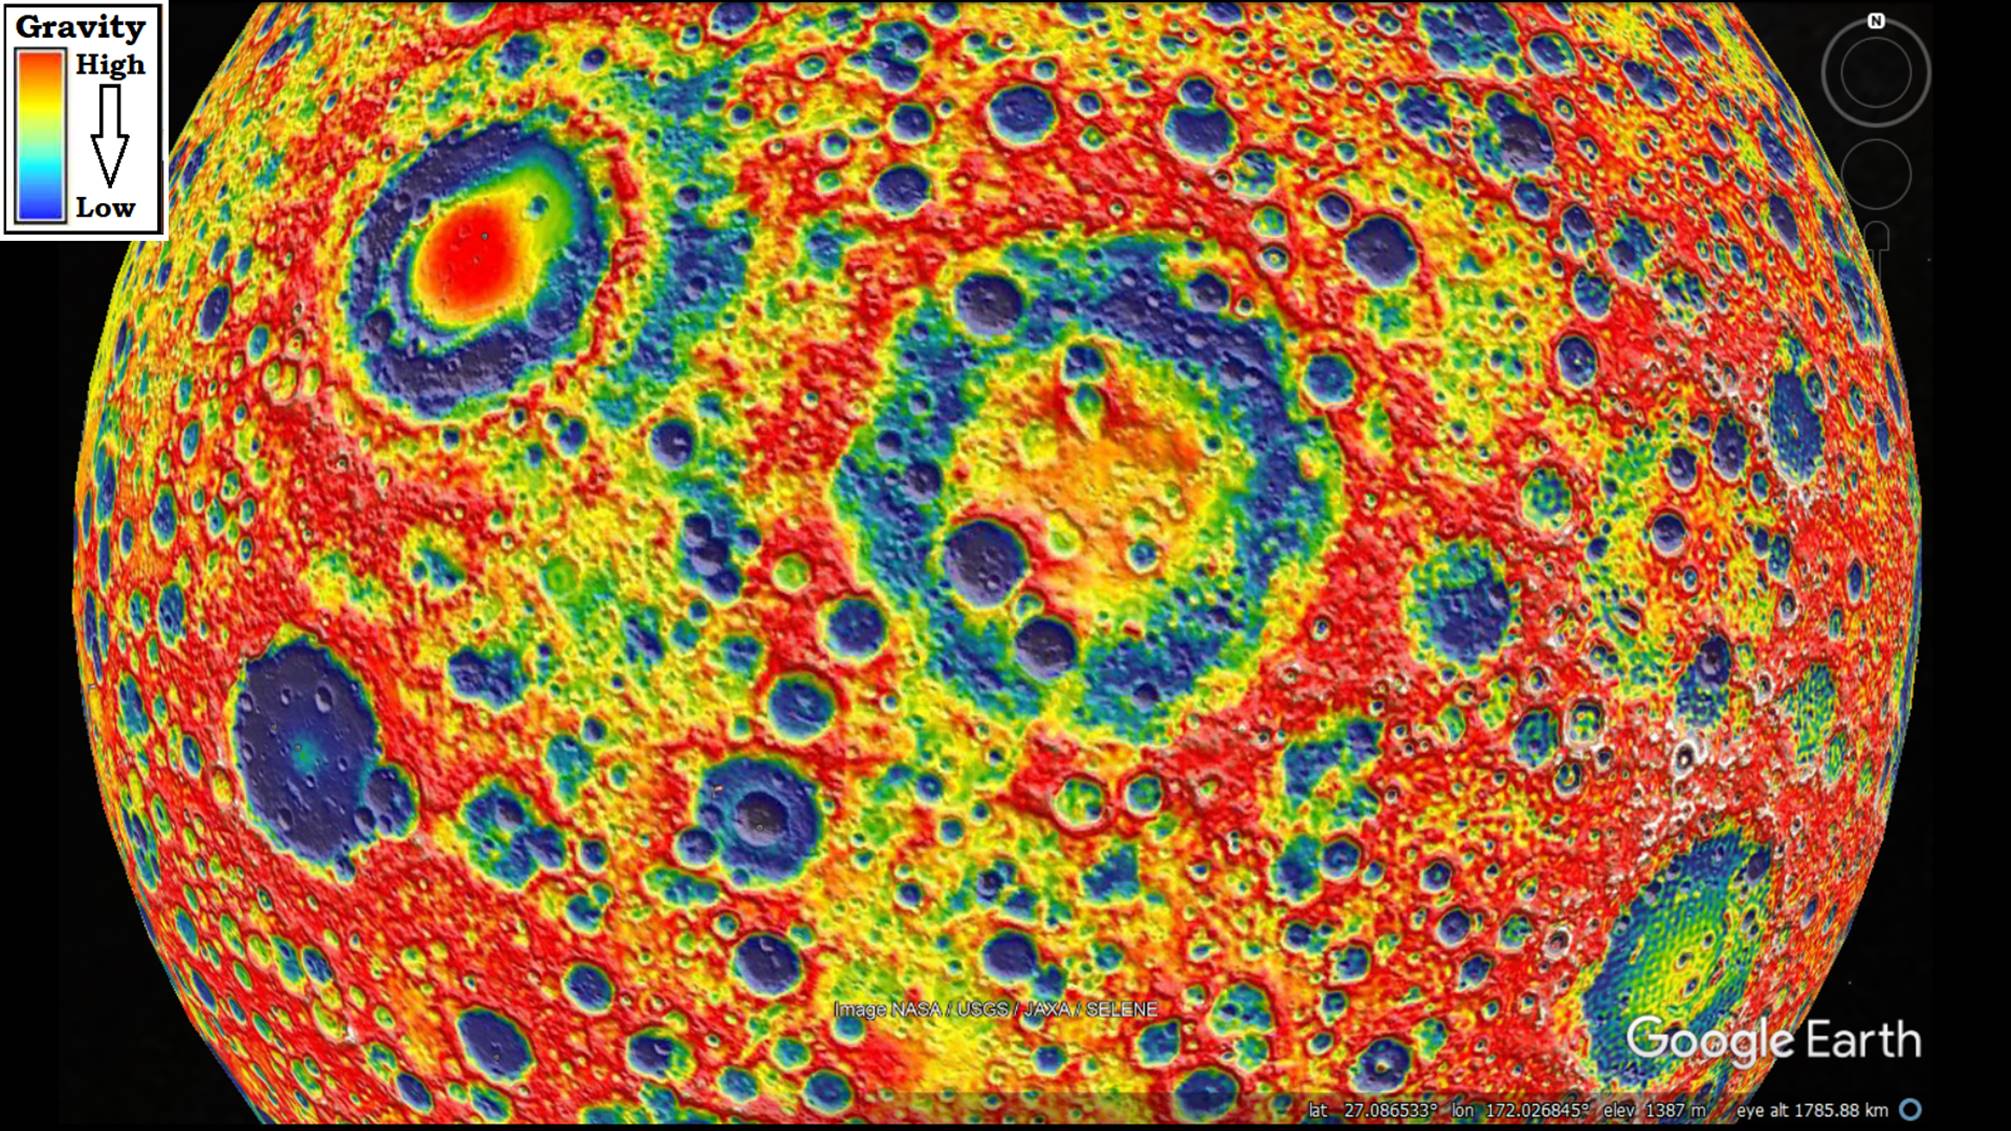 Figure 7: This is the farside of the moon. It is often called the “high-lands” much more like the continental areas of earth which are the earth’s “high-lands”. Much of this cratering study will use strangely colored maps of both the moon and earth. These are gravity map. Gravity maps DO NOT correspond to topography maps, but often they look similar. On a topography map a mountain may show high because its shape is tall, and in a gravity map it may show high because it has denser lithology (more gravity) than surrounding rocks. It is a subtle difference but extremely important because not all landforms with high topography have high gravity, and some low landforms have high gravity. The Compression/shock wave will produce high gravity whether it produced high topography or not. And by contrast, Expansion/release waves will produce low gravity whether they later are pushed to great heights. The bull-eye pattern seen on the moon are high compression/red gravity ringed with low expansion/blue gravity rings repeating outward.
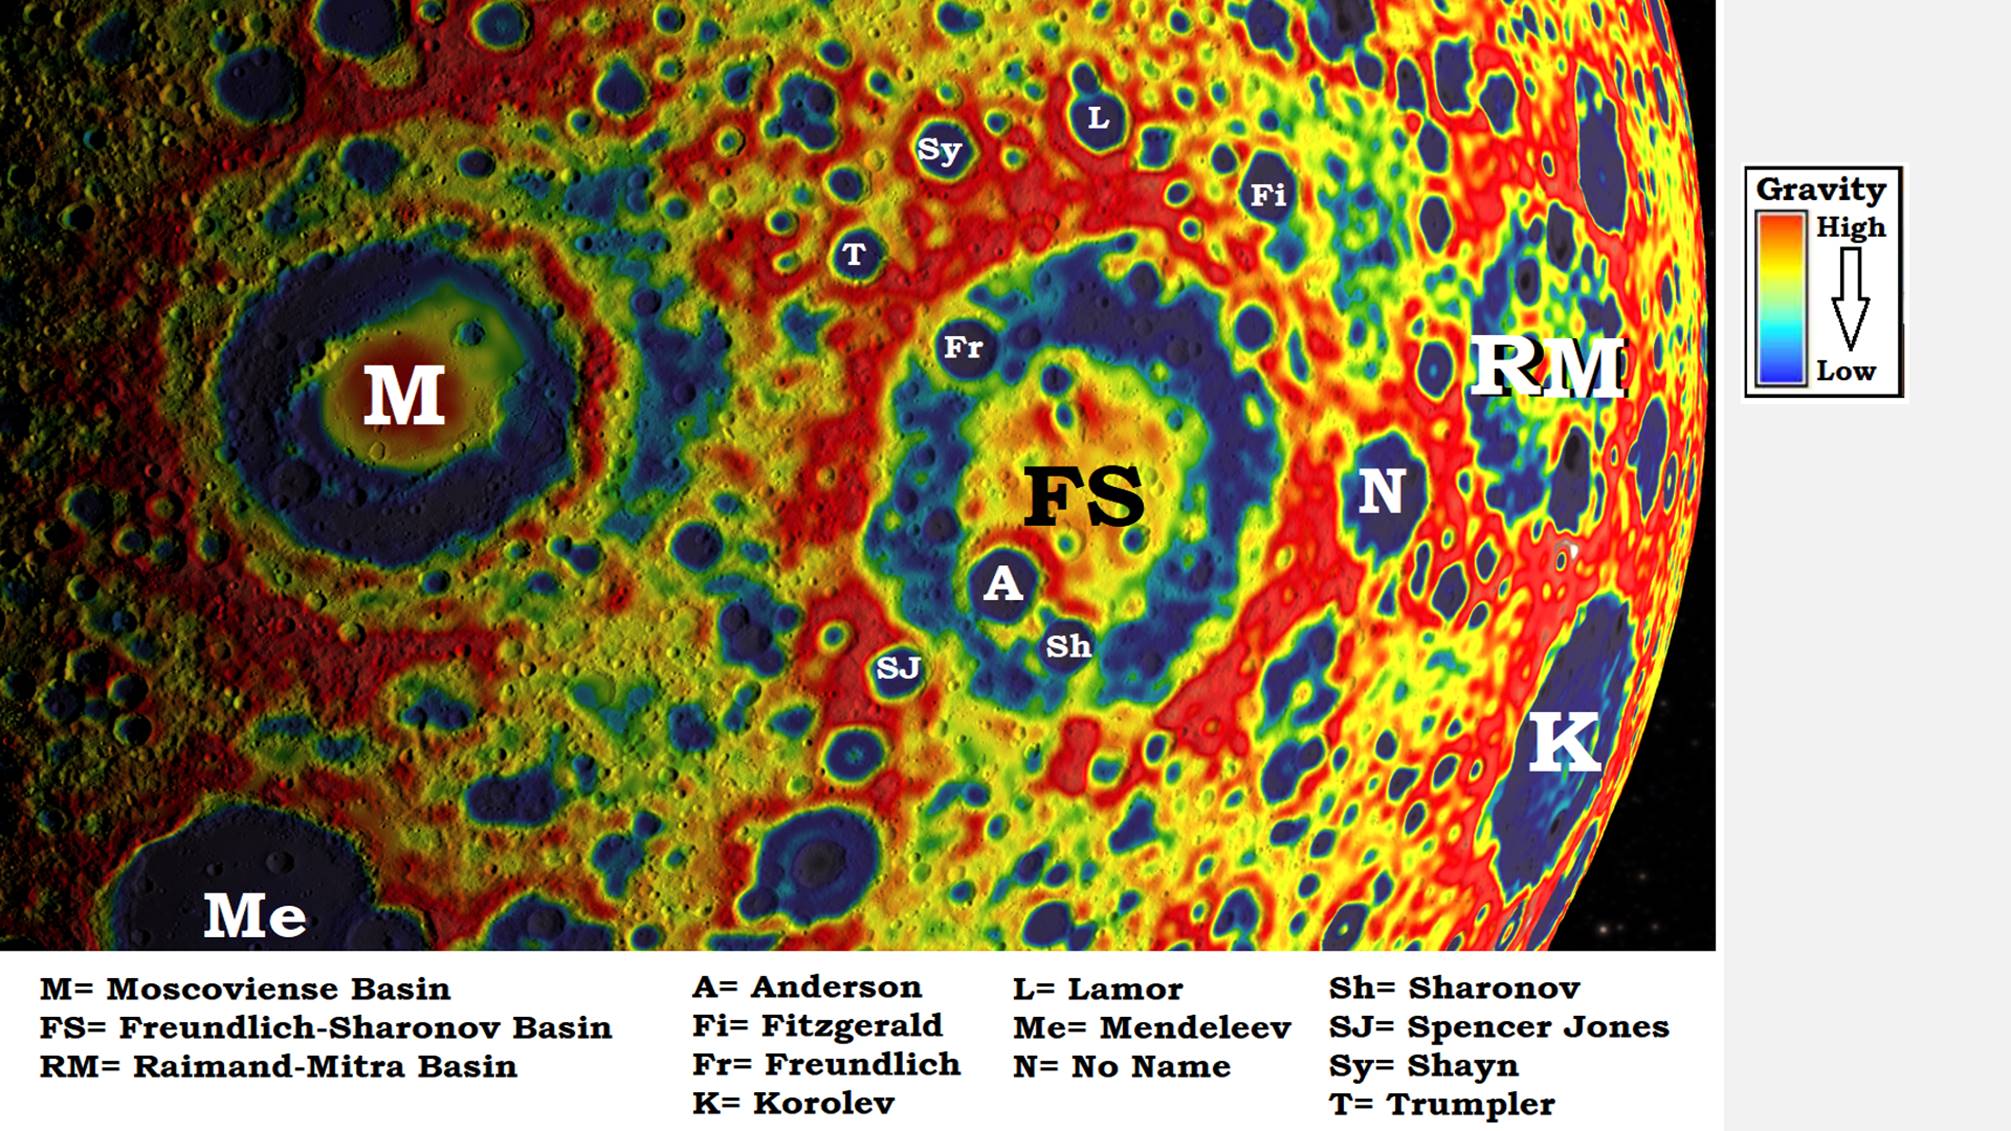 Figure 8: On the farside of the moon some craters are still designated basins because bureaucracy is slow changing names to show recognized craters. I may refer to them as craters, which they are. We need to first consider where to gather data. NASA provides three wonderful maps of the moon: GRAIL (gravity, seen here), Crustal Thickness, and Topography. If you are using Google Earth, you can paste these as pictures on Google Moon and the landmark names and distances will show up appropriately. A fourth map is very useful, Red Relief, that comes from the JAXA, Japan Aerospace Exploration Agency (their NASA), and can also be pasted on Google Moon. For Gravity on Earth, Scripps Institute of Oceanography (UCSD) offers a Global Gravity Anomaly overlay for Google Earth that you cannot do without. You will find web addresses at the end. First of all notice that nearly all of the craters, large and small, but especially the medium size ones, have a dark blue center. That is LOW gravity. But by contrast three of the largest, Moscoviense, Freundlich-Sharonov, and Raimand-Mitra Basins, have red centers. The red center is referred to as a Mascon, a mass concentration. These basins did not show up as individual craters until the GRAIL gravity map was produced, but it is now easy to recognize the red/denser/ high gravity rings from the blue/ low gravity rings between. We can deduce from this view that the normal center of a crater in not necessarily low topography, but it is low gravity until a mascon forms.
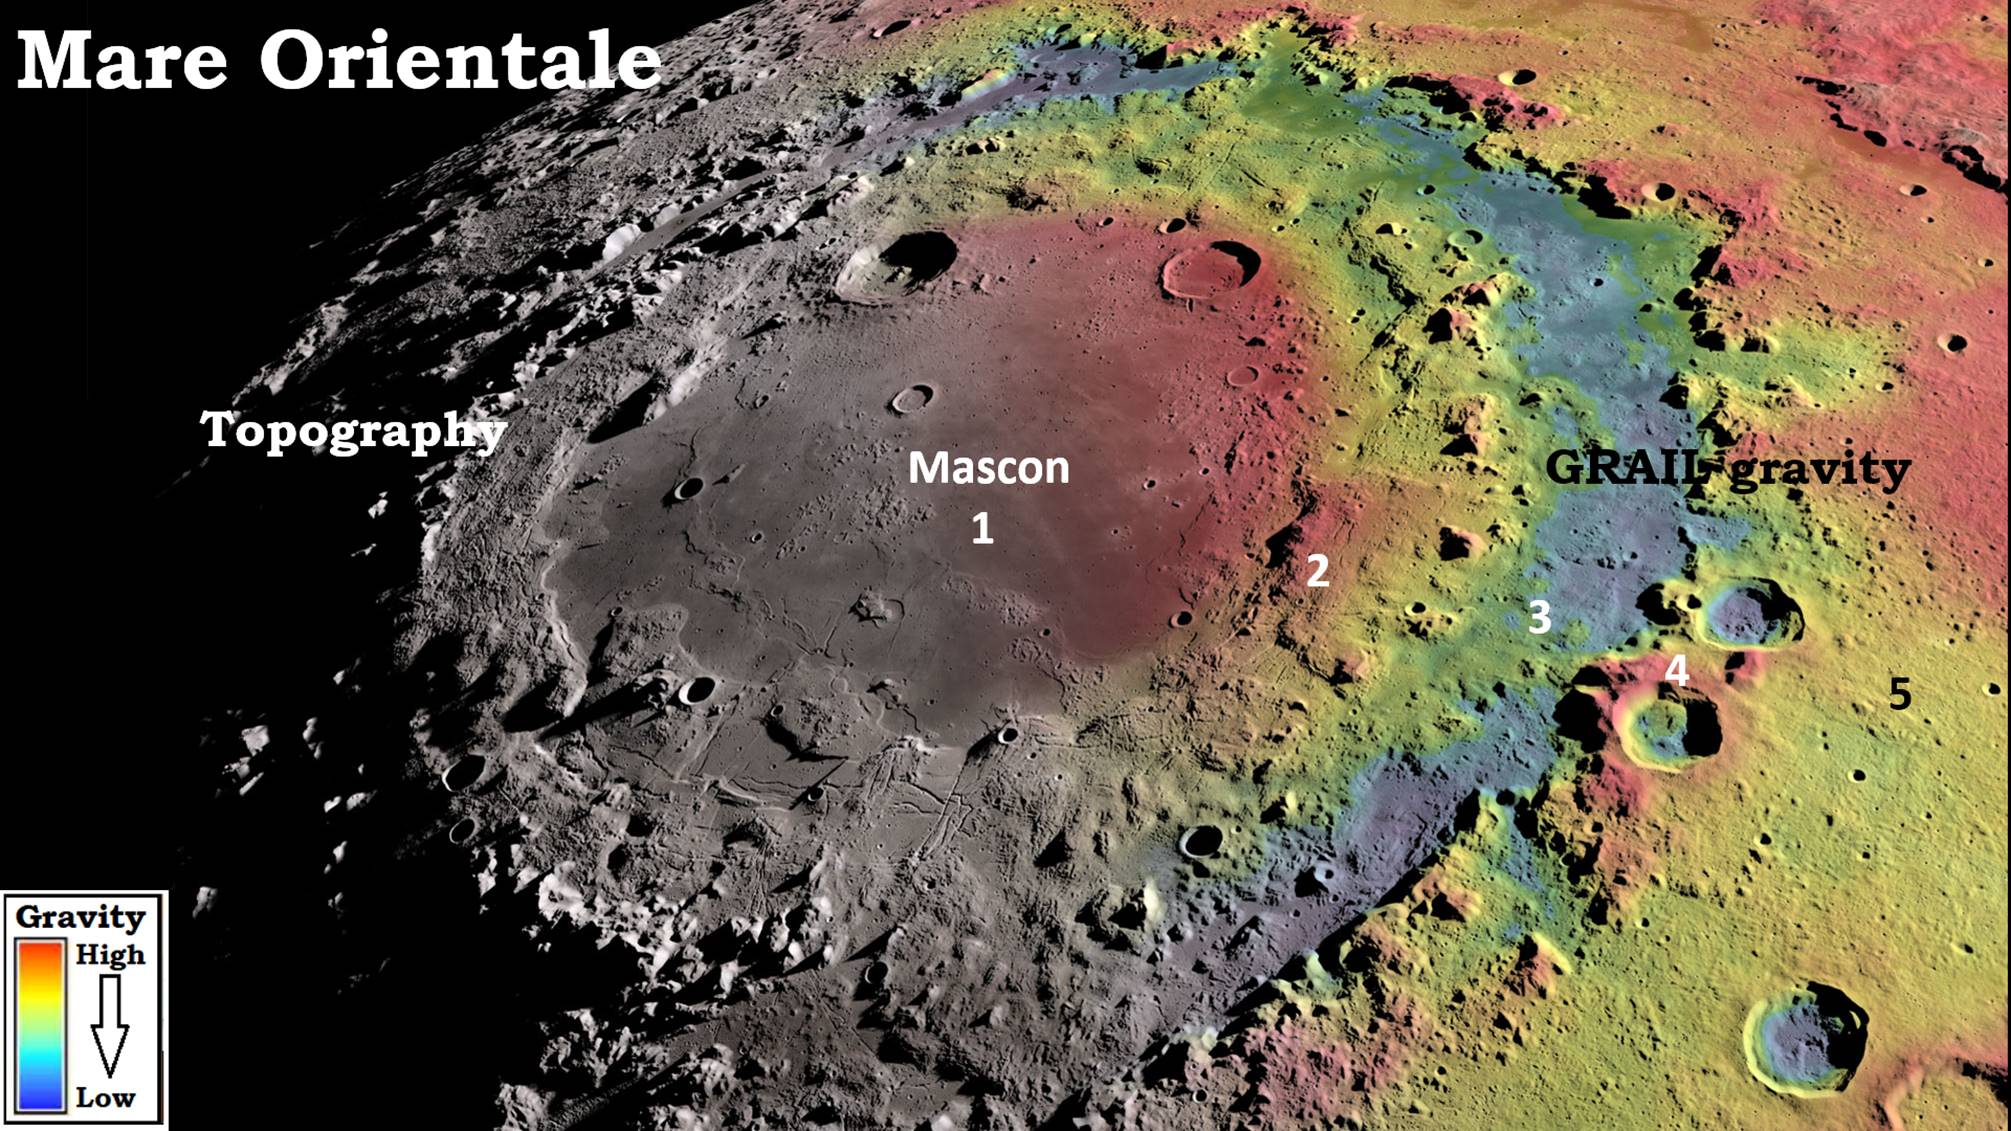 Figure 9: The first view the public got of the GRAIL data was pasted over the east half of Mare Orientale, a NASA produced image for Science Magazine. It shows the correlation between tall topography and high gravity, except at the center. The red 1-center/mascon is such high gravity it totally mask topography and other small changes in gravity. 2-Ring is red, yellow and green, so it shows high and lower gravity, more than the topography suggest. 3-Ring is low gravity, but it has topographic highs in it. 4-ring varies similarly to 2-ring. 5-ring does not show low gravity with blue. But. It does show lower gravity in a small circular area just below the “5”. It becomes a task of judging how comparatively low and how comparatively high.
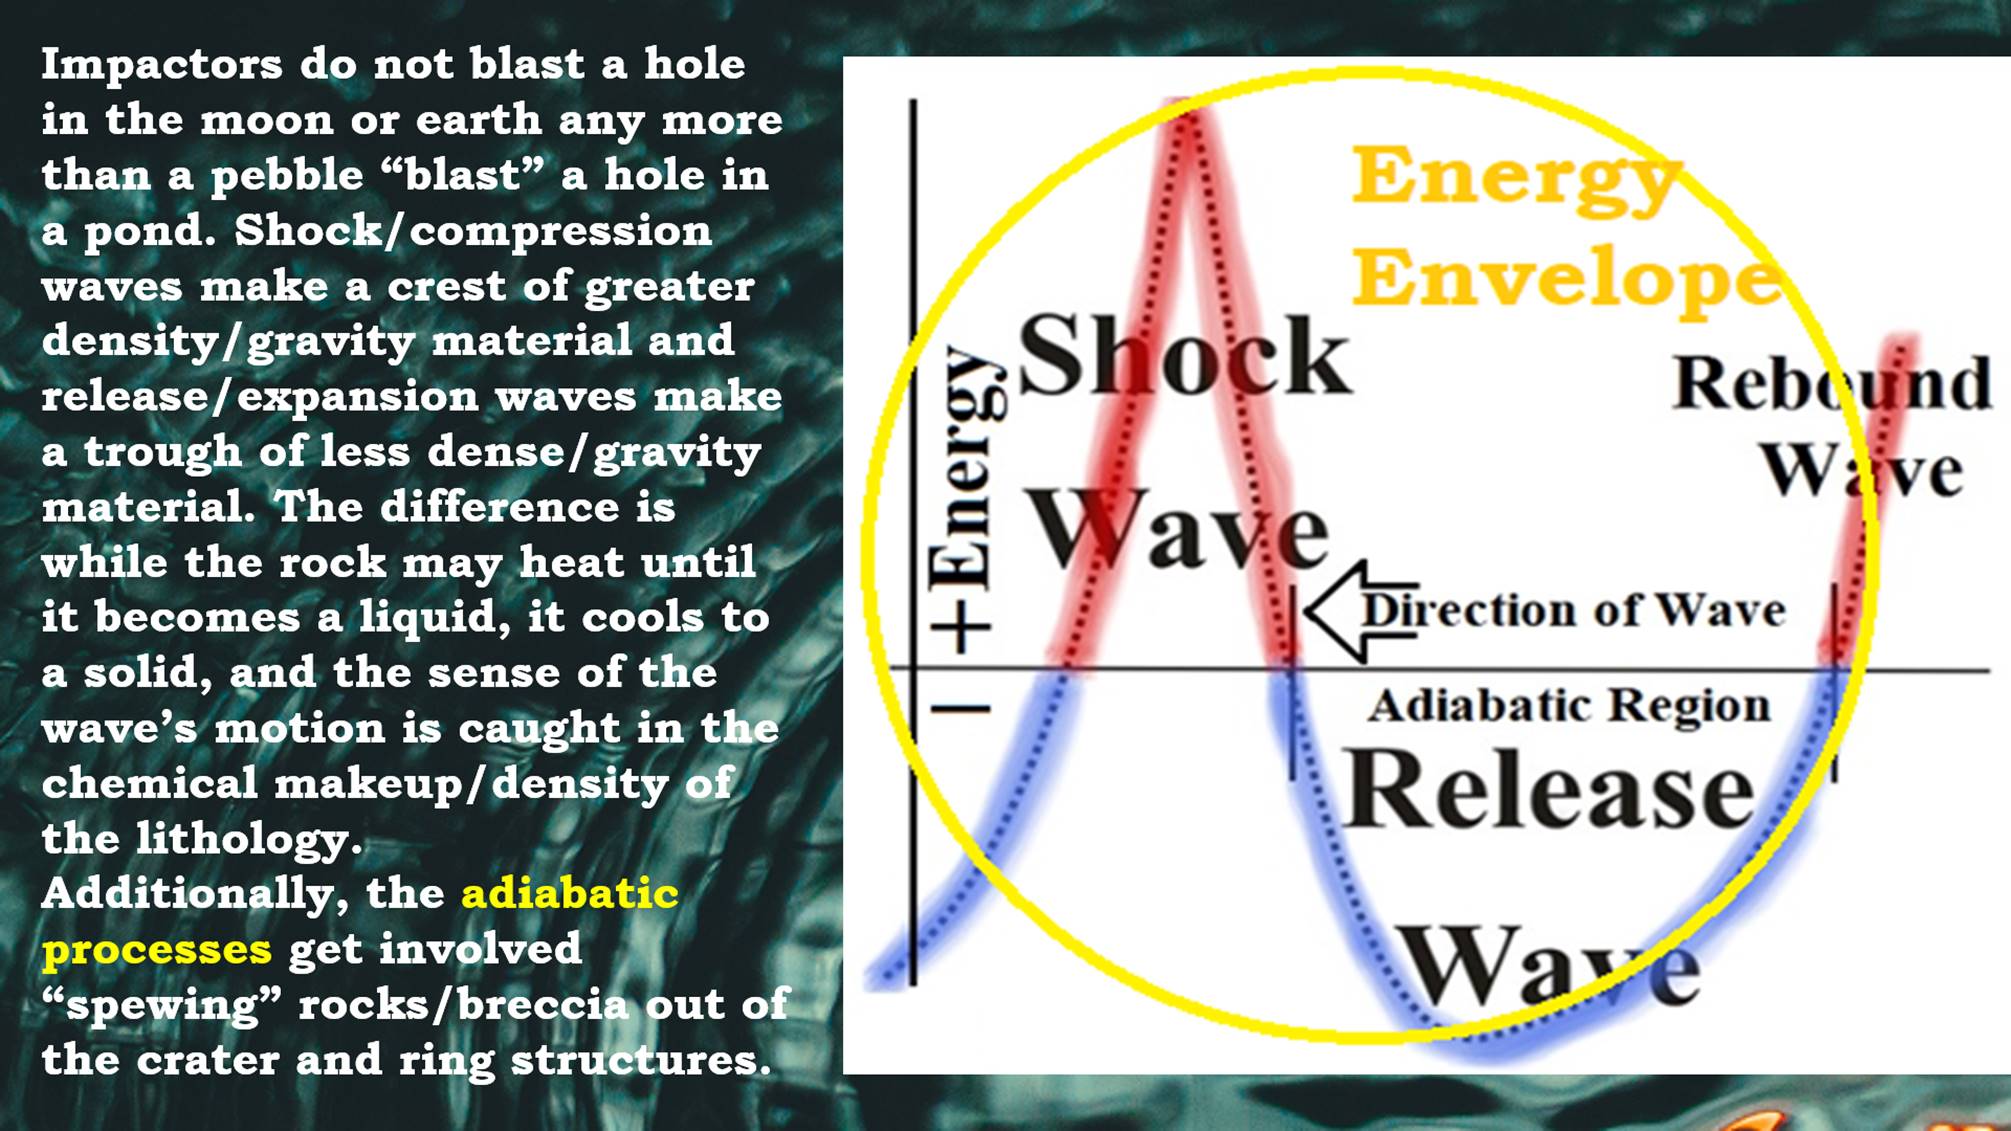 Figure 10: Energy envelope will be an important concept for seeing craters on moon or earth. When an impactor strikes a body it does not blast a hole in it, any more than a pebble “blast” a hole in a pond when it is thrown it. It will make a splash, but not blast-out a hole. Shock/Compression waves make a crest of greater density/gravity material and release/expansion waves make a trough of less dense/gravity material. The difference is while a rock may compress until it becomes a liquid, it cools to a solid, and the sense of the wave’s motion is caught in the chemical makeup/density of the rock. Additionally, the adiabatic processes get involved “spewing” ablated (rounded) rocks/breccia out of the crater and ring structures. An energy envelope will then consist of one expression each of the compression wave and expansion wave, generally a ring of red with a ring of blue inside of it.
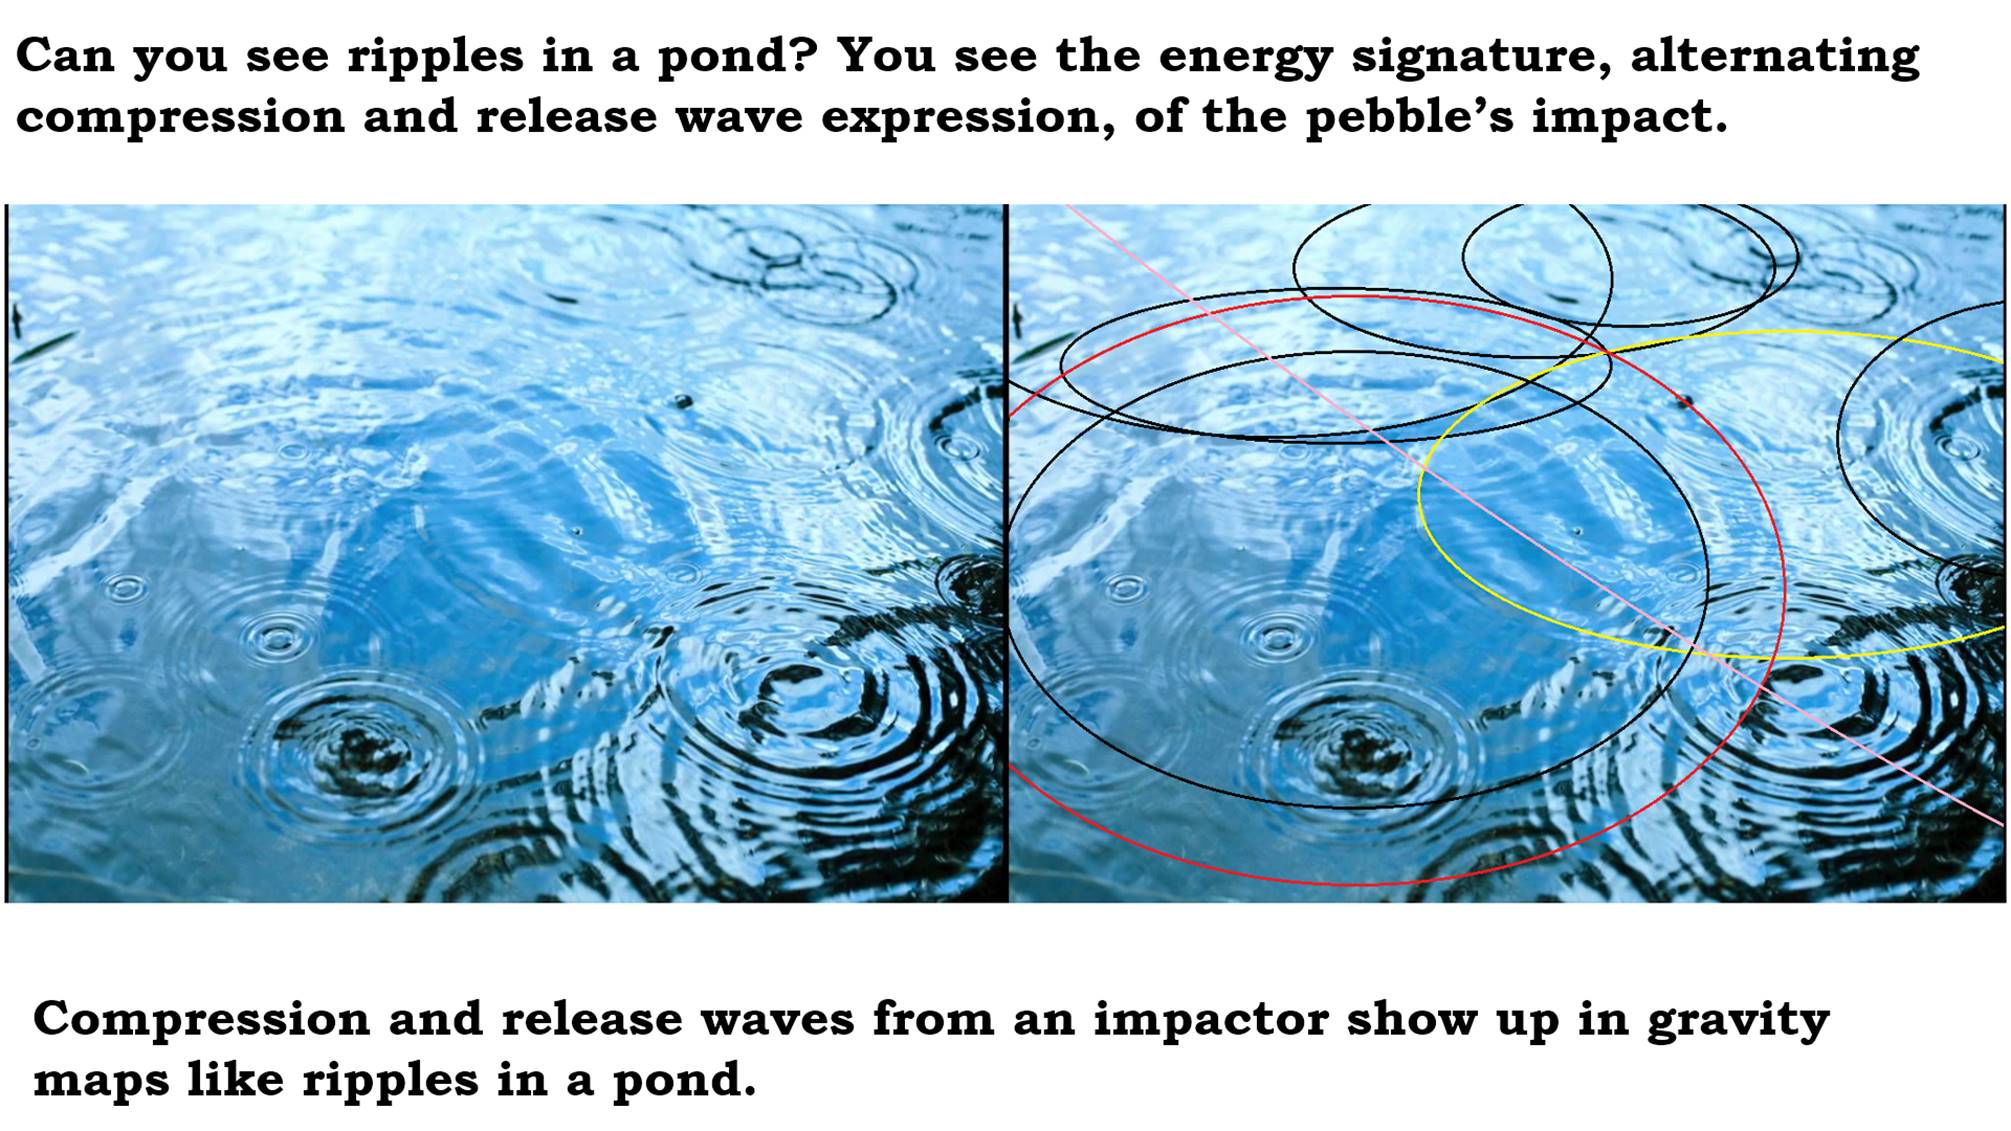 Figure 11: When you see ripples in a pond, you are seeing the energy signature, alternating shock/compression waves and release/expansion waves. This is an expression of the pebble’s impact energy. Look at the image on the left, how many ripples can you pick out? Can you see the one that is colored red on the right? We can all probably see the one in black inside of it, and if we look carefully we can probably pick out some expressions of the red-ring within and between other ripples. Can you see the yellow-ring? It is pretty obvious in the center and towards the right edge, but will probably take a little looking to see it along the far distant edge. Can you see the pink line? Again it is obvious in the center and becomes less so within the other ripple patterns. But, ripples show us one very important characteristic, other sets of ripples do not obliterate previous ones, they just add to their expression. Look at the obvious pattern in the lower right hand corner. When ripples overlap, they form a system of nodes, with the additive and subtractive combinations for the energy put into each water molecule. So, as it is a wave, the energy is not expended but it keeps on moving outward until it is dissipated and lost in noise.
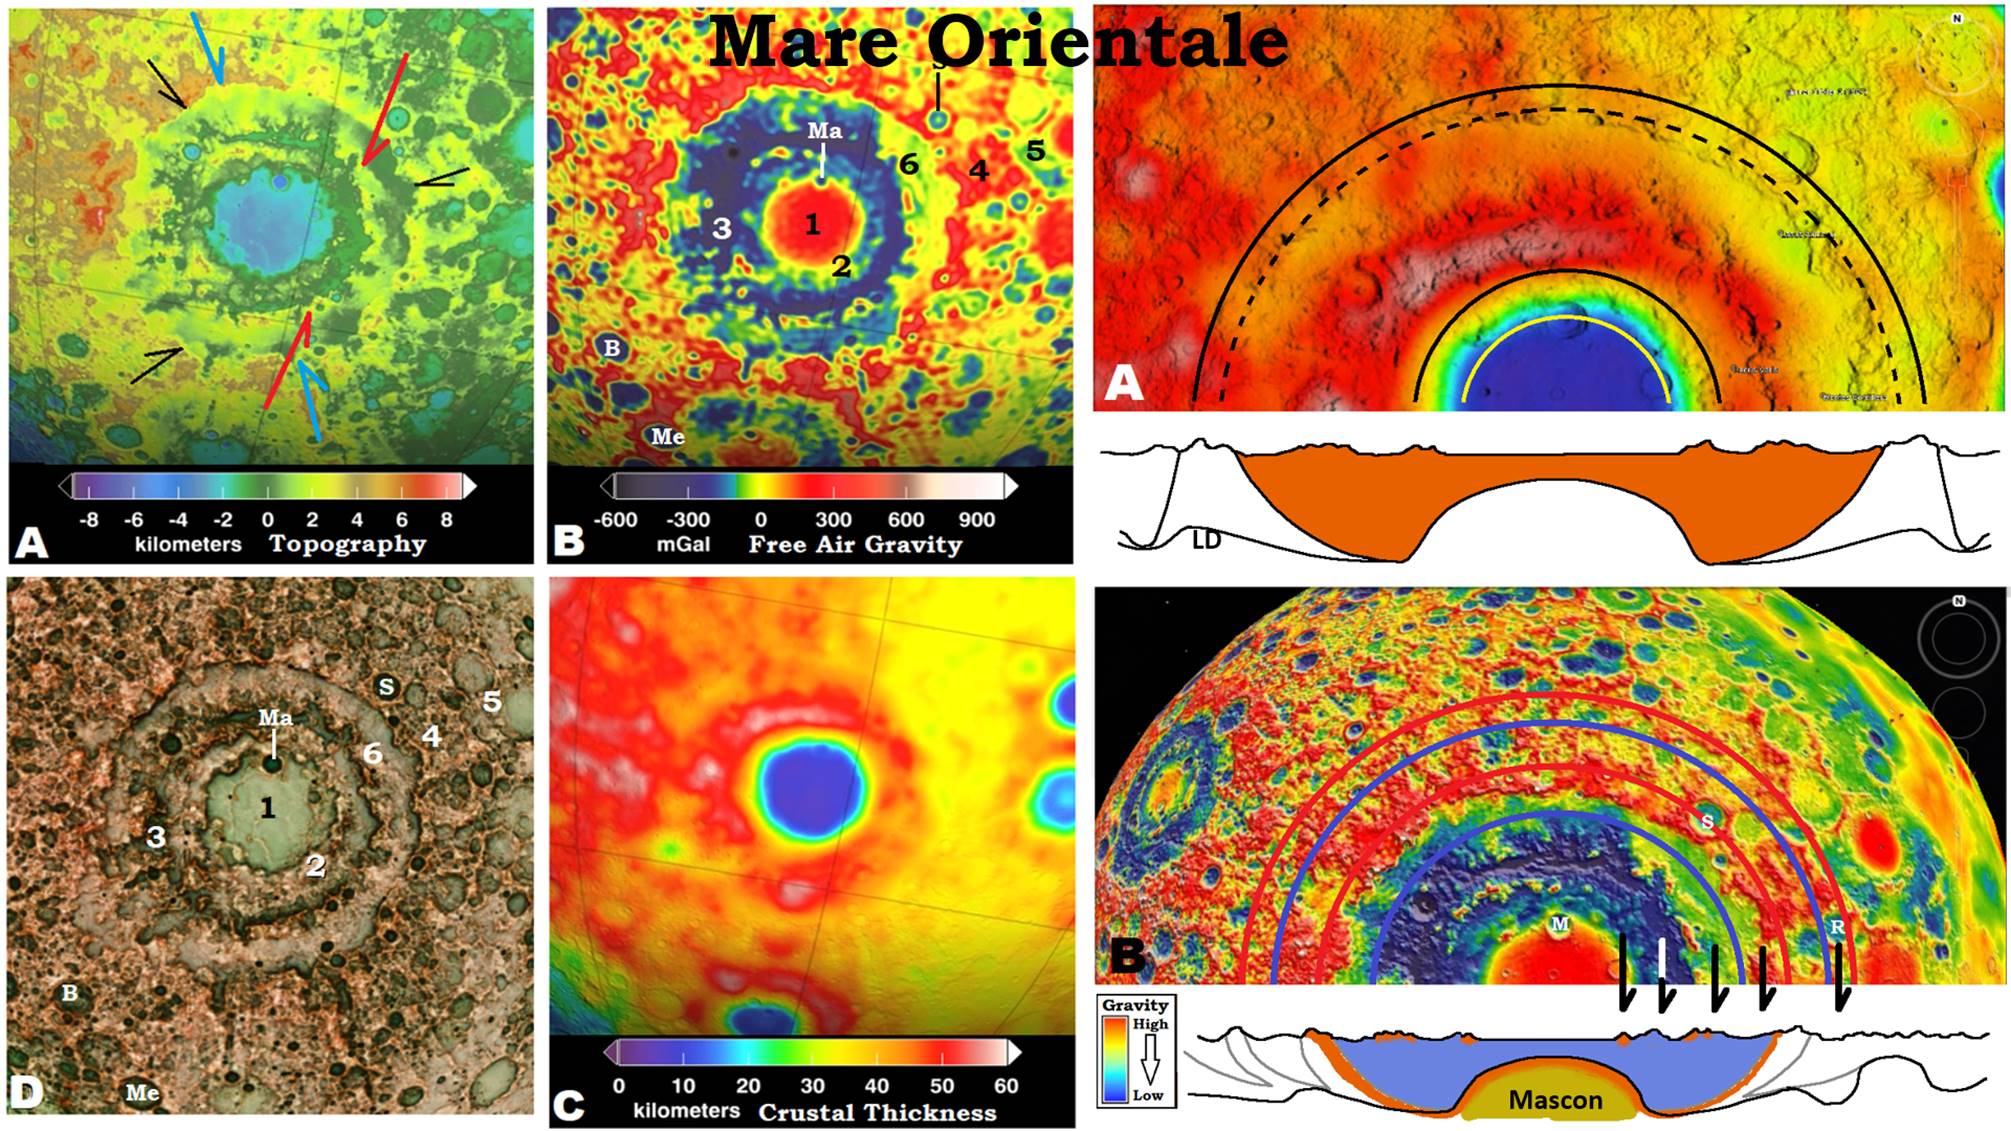 Figure 12: Looking at Mare Orientale in greater detail, (A) shows some linear ridges and valleys that cut across the first few rings. Most of these can be traced even further out with greater detail afforded by the zoom feature on Google Earth. The crater center is amongst the lowest topographic points seen, but Gravity in (B) shows it to be a mascon with the bright red/highest gravity center. Crustal thickness shows the center to be the thinnest crust in the immediate area with a red ring, thickest crust just inside 4-ring. So the densest crust is just outside the thickest crust. A possible structural cross section in shown at upper right, with the orange showing crustal thickness, and the Lunar Discontinuity (LD), equivalent to the Moho on earth, showing variation in depth between crust and mantle. With the gravity map in lower right, the mascon is indicated as probably a pull-up of the mantle in the rebound of the crater floor. (Chapter 10 and 16 in the book.) The five arrows represent where Hartmann in his 1963 book placed them.
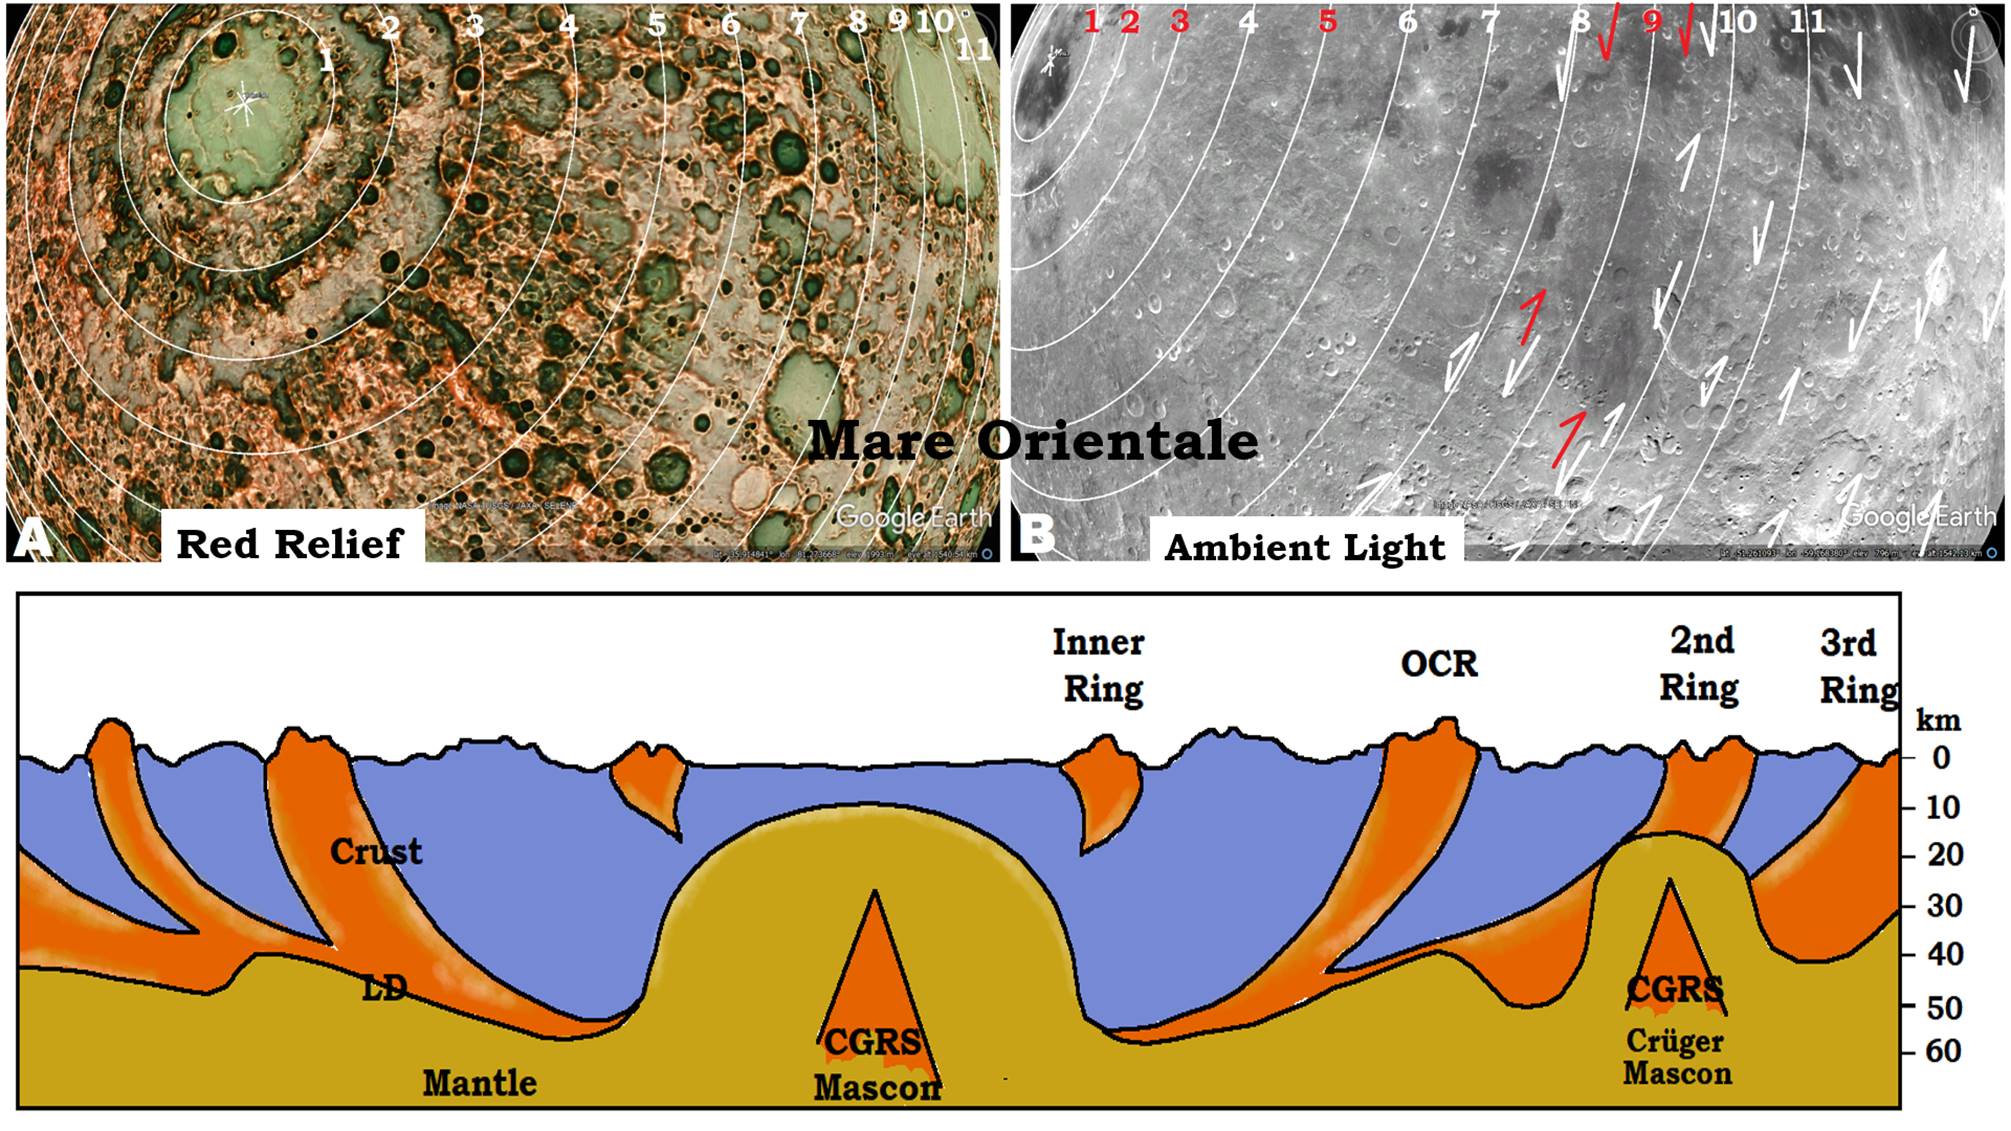 Figure 13: Moving on outwards, using Red Relief, which emphasizes changes in topography (JAXA), 11-rings are located and verified with Ambient light. These more distant annulus to the cratering event are referred to as Concentric Global Ring Structures (CGRS). Rings 1, 2, 3 and 5 of Hoffmann were verified, and several concentric linears in between them, and then extending even further out are added. I believe Mare Orientale’s 2-ring (at 930 km diameter), was the (Original Cratering Rim) OCR-ring, and the crater was possibly the last large crater in its area. Maybe this is why it left such a clear record in the topography seen with ambient light. The cross section of Mare Orientale is the most detailed I could draw with this information. Chapters 8, 9, 10A, and 12 give much more information how I developed these cross sections. Scale on the right represents the depths. Regrettably, I have better information on lunar craters, so I cannot provide nearly this clear a picture of earth craters, until we look at some smaller structures (Uncompahgre crater, ~460 km diameter OCR-ring [Original crater rim]).
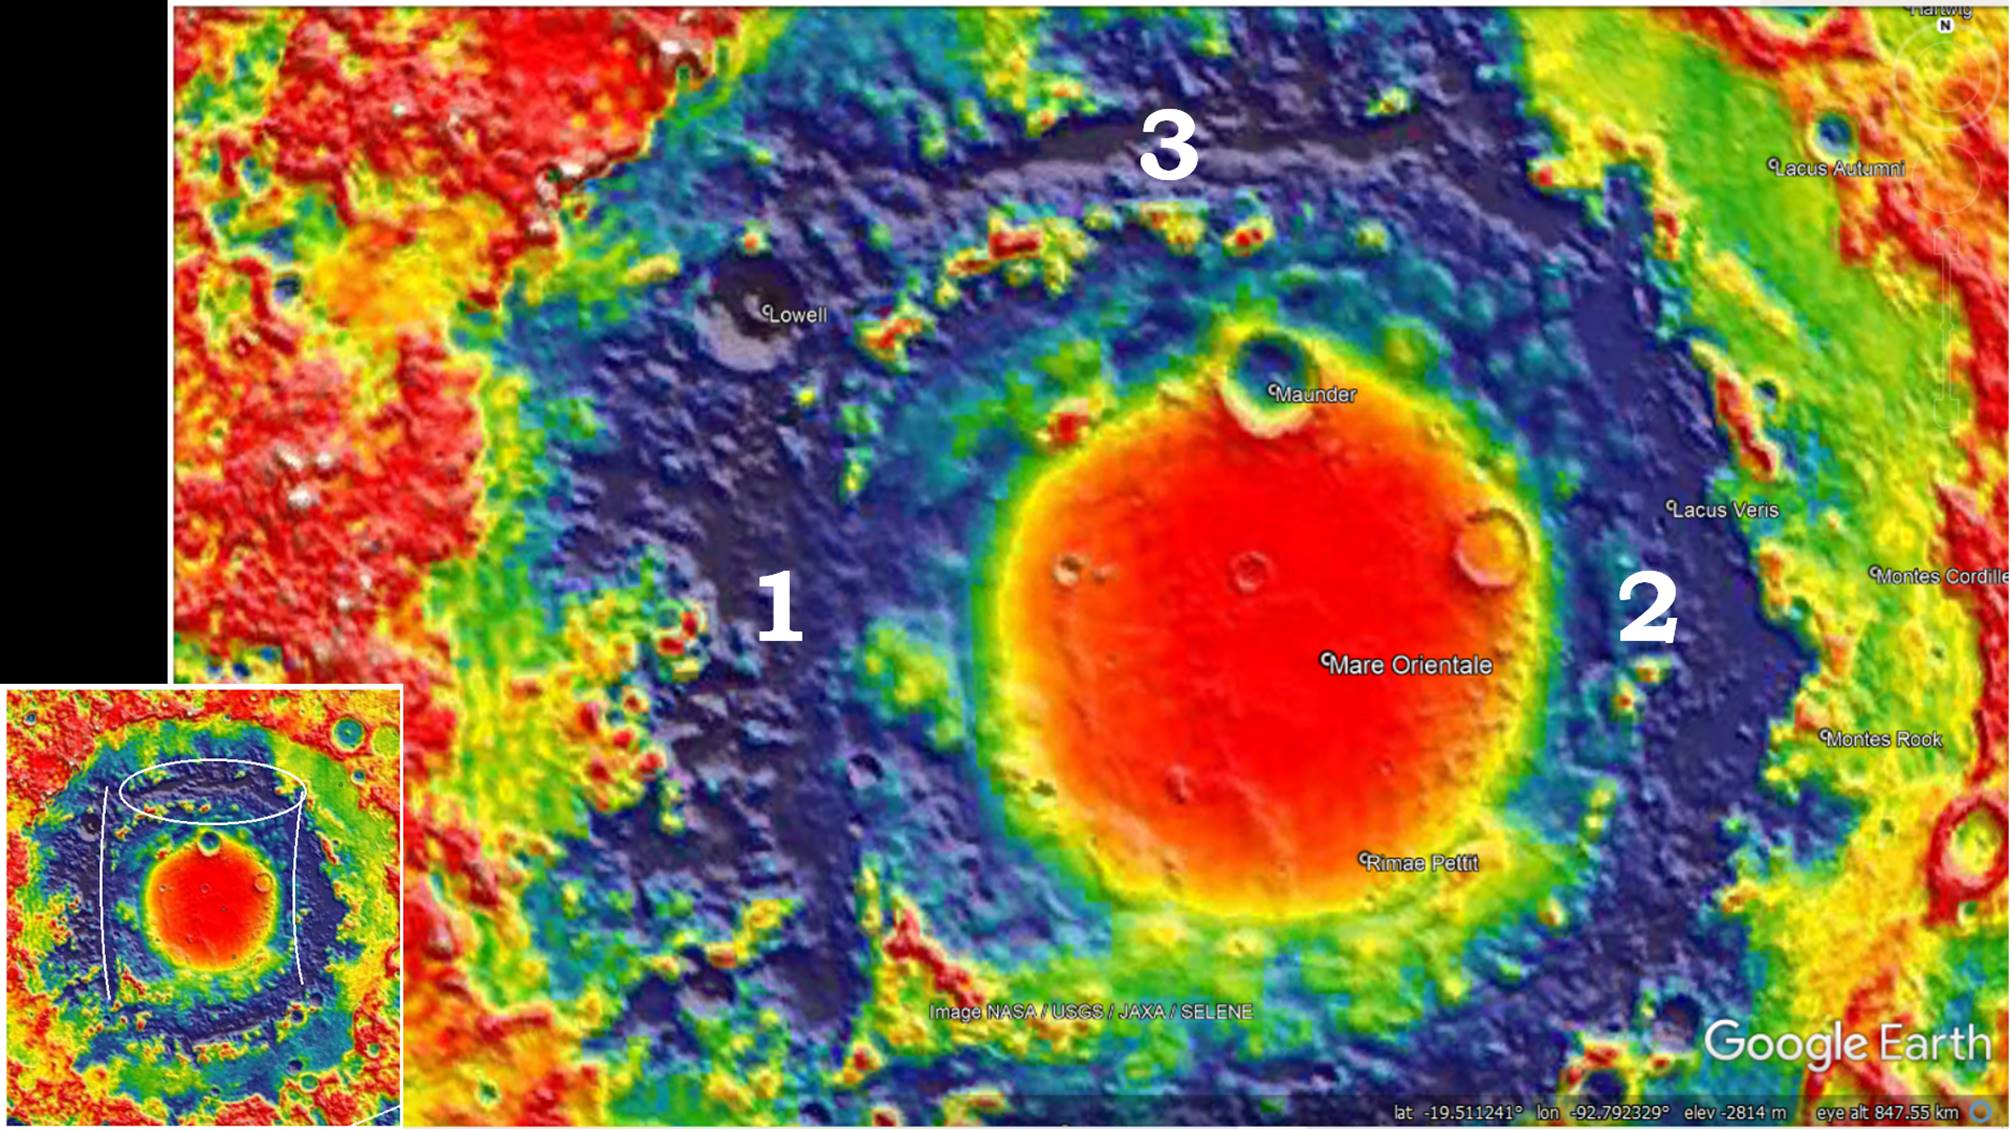 Figure 14: Looking closely back at Mare Orientale’s blue/low gravity center, outside the Mascon we see 3 distinct blue linears. “1” is the most distinct, but “2” has some green to orange in its center. I will classify both of these slightly arced linears as Release-Valleys similar to the Unaweep Release-wave Valley of Colorado (Chapter 1). Linear 3 is also a release valley, and its wiggly line reminds me of the Grand Canyon when viewed in Gravity map. This has been a rapid review of the cratering process and how to read gravity maps, but before we get to the Grand Canyon we need to cover some more preliminary information about my model.
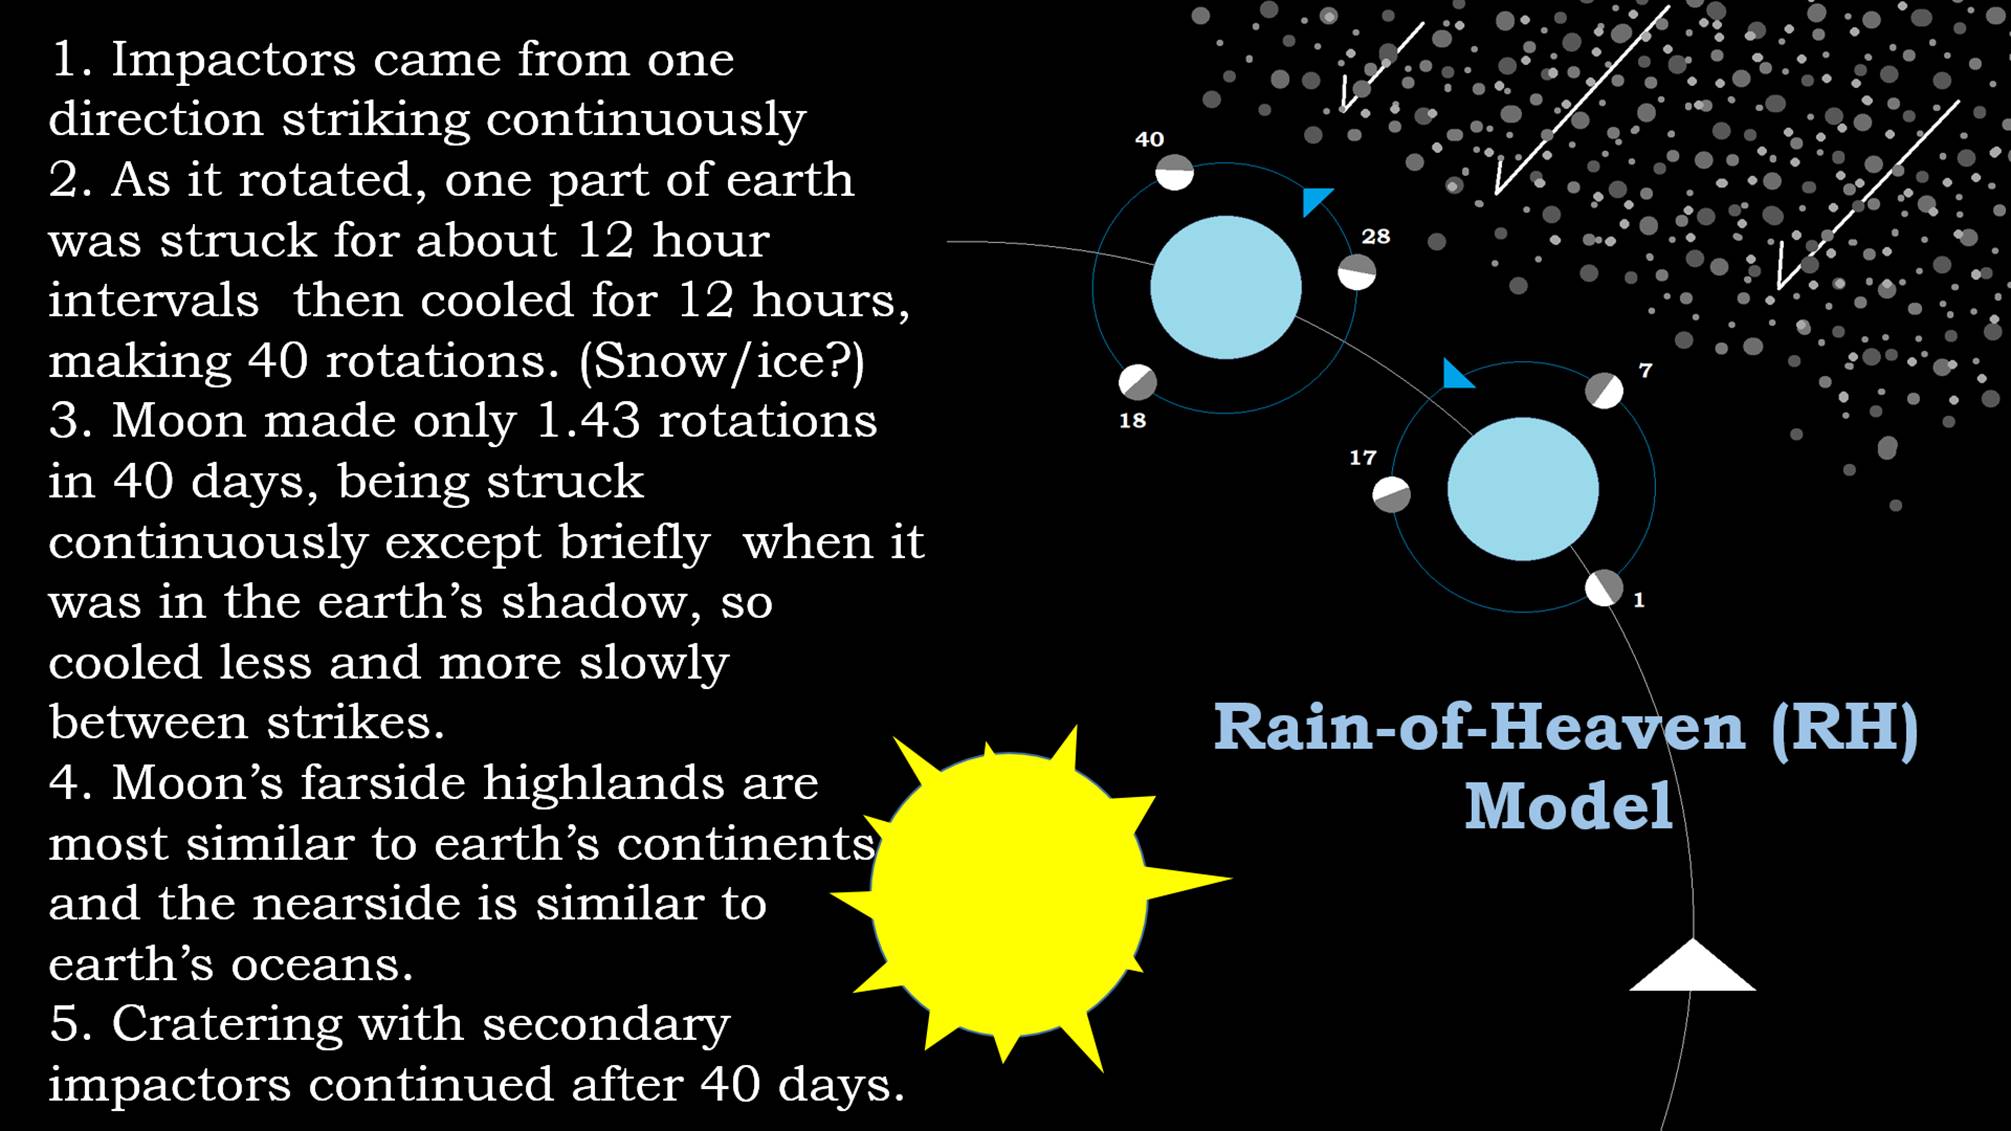 Figure 15: This is the bare-bones, “Cliff Note,” version. I will call it the “Rain-of-Heaven” Cratering Model. It contains only 5 points at present. 1. Impactors came from only one direction striking continuously from when the “Windows of Heaven” were open until they were closed. As I assume these impactors were headed for the sun, this means that all cratering took place at night. If the Taurid Meteor Shower is the remnants of this rain, the Flood likely started in our Fall Months. 2. As it rotated, one part of earth was struck for about 12 hour intervals then cooled for 12 hours. Making 40 rotations, dividing the Flood into 40 distinct intervals of cratering on earth. As the first impactors were some of the largest, possibly much water was blasted into space where it was flash frozen and probably fell as ice during the day partially cooling the substrate. 3. Moon made only 1.43 rotations in 40 days, being struck continuously except briefly when it was in the earth’s shadow, so cooled less and more slowly between strikes (here the light half of the moon represents it nearside, and the gray half represents its farside. Small numbers represent the approximate juxtaposition of the moon’s sides to the earth and to the arriving impactors on that day’s number.) 4. Moon’s farside highlands are most similar to earth’s continents and the nearside is similar to earth’s oceans. Therefore, continents are determined by the amount of cratering in that location. More craters = continents, less craters = oceans. 5. Cratering with secondary impactors continued after 40 days, finally ending about Abraham’s time frame with Sodom and Gomorrah. Possibly allowing for some significant post-Flood catastrophism.
 Figure 16: If the moon’s bombardment started in the vicinity of Mare Orientale, made a full 1.43 rotations; it would rotate through the highlands, across the front side lowlands and then back through the highlands. If this concentration of impactors for a second time in the same area resulted in a greater percent of alkaline magmas, this would correlate with returning over the same crust results in bringing more alkaline material towards the surface where it can be accessed by the cratering process. Such a concentration of alkaline material will account for earth’s continents as well, not basalt vs granite which is usually cited.
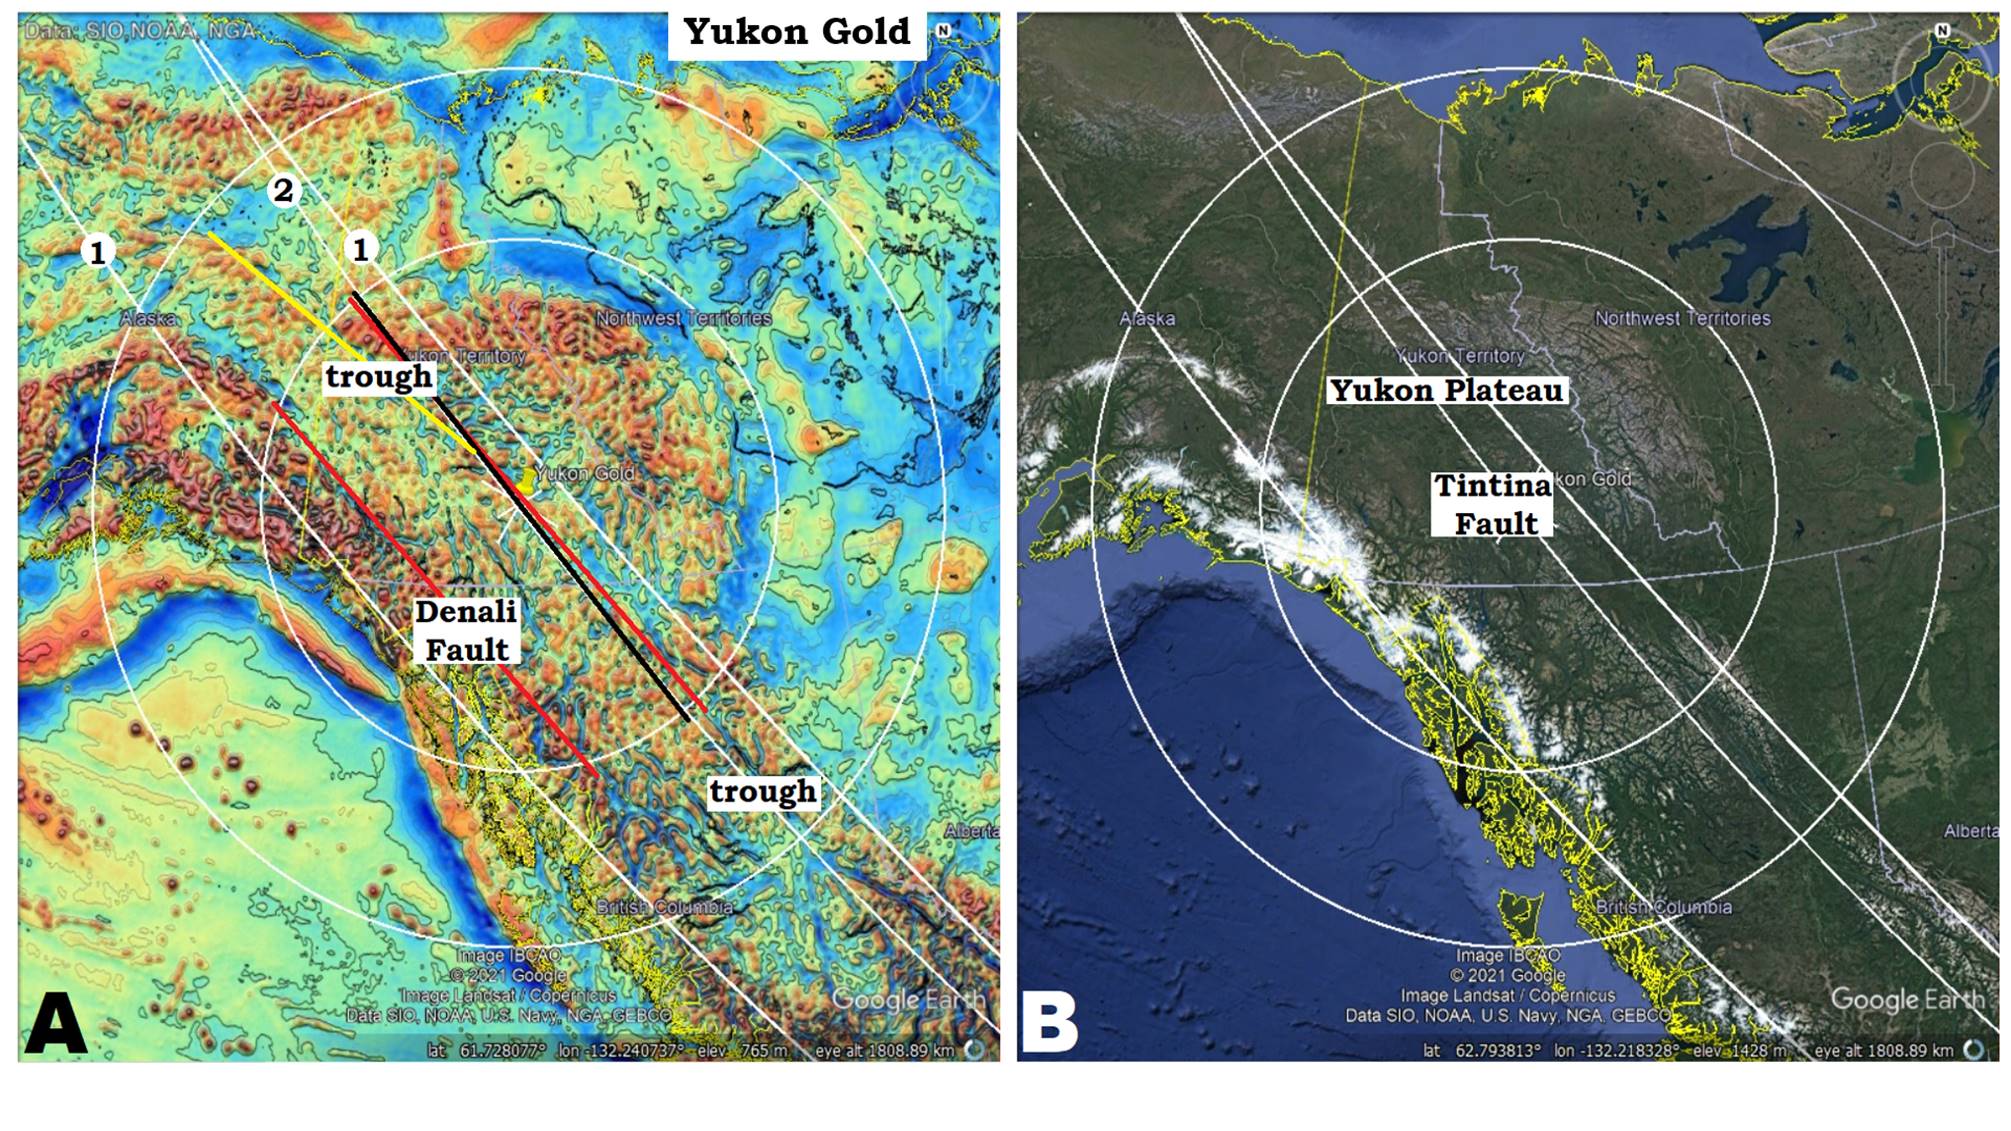 Figure 17: This is a gravity map of the earth. In this presentation I will usually pair it with a Google Earth Landsat image so that you can relate the gravity map to familiar mapped locations. If you are going to work in cratering, you will have to learn to recognize the important landmarks while in gravity maps. The Yukon Gold crater anchors the northern end of the Sevier Orogeny. It extends from Alaska to British Columbian, and includes most of the Yukon Territory inside its inner ring. You can see the thin white circle outside of the obvious blue half ring. If this was ripples in a pond, you would have no problems recognizing the ripple pattern from this much information. The Yukon Gold crater is recognized for it “energy envelope” (alternating high and low gravity) seen in the gravity map. The slightly arced linears are distant CGRS/annulus from (1) the Tasman Sea crater and (2) the Azores crater, The Azores crater caused the Tintina Fault, and the Tasman crater caused this portion of the Denali Fault.
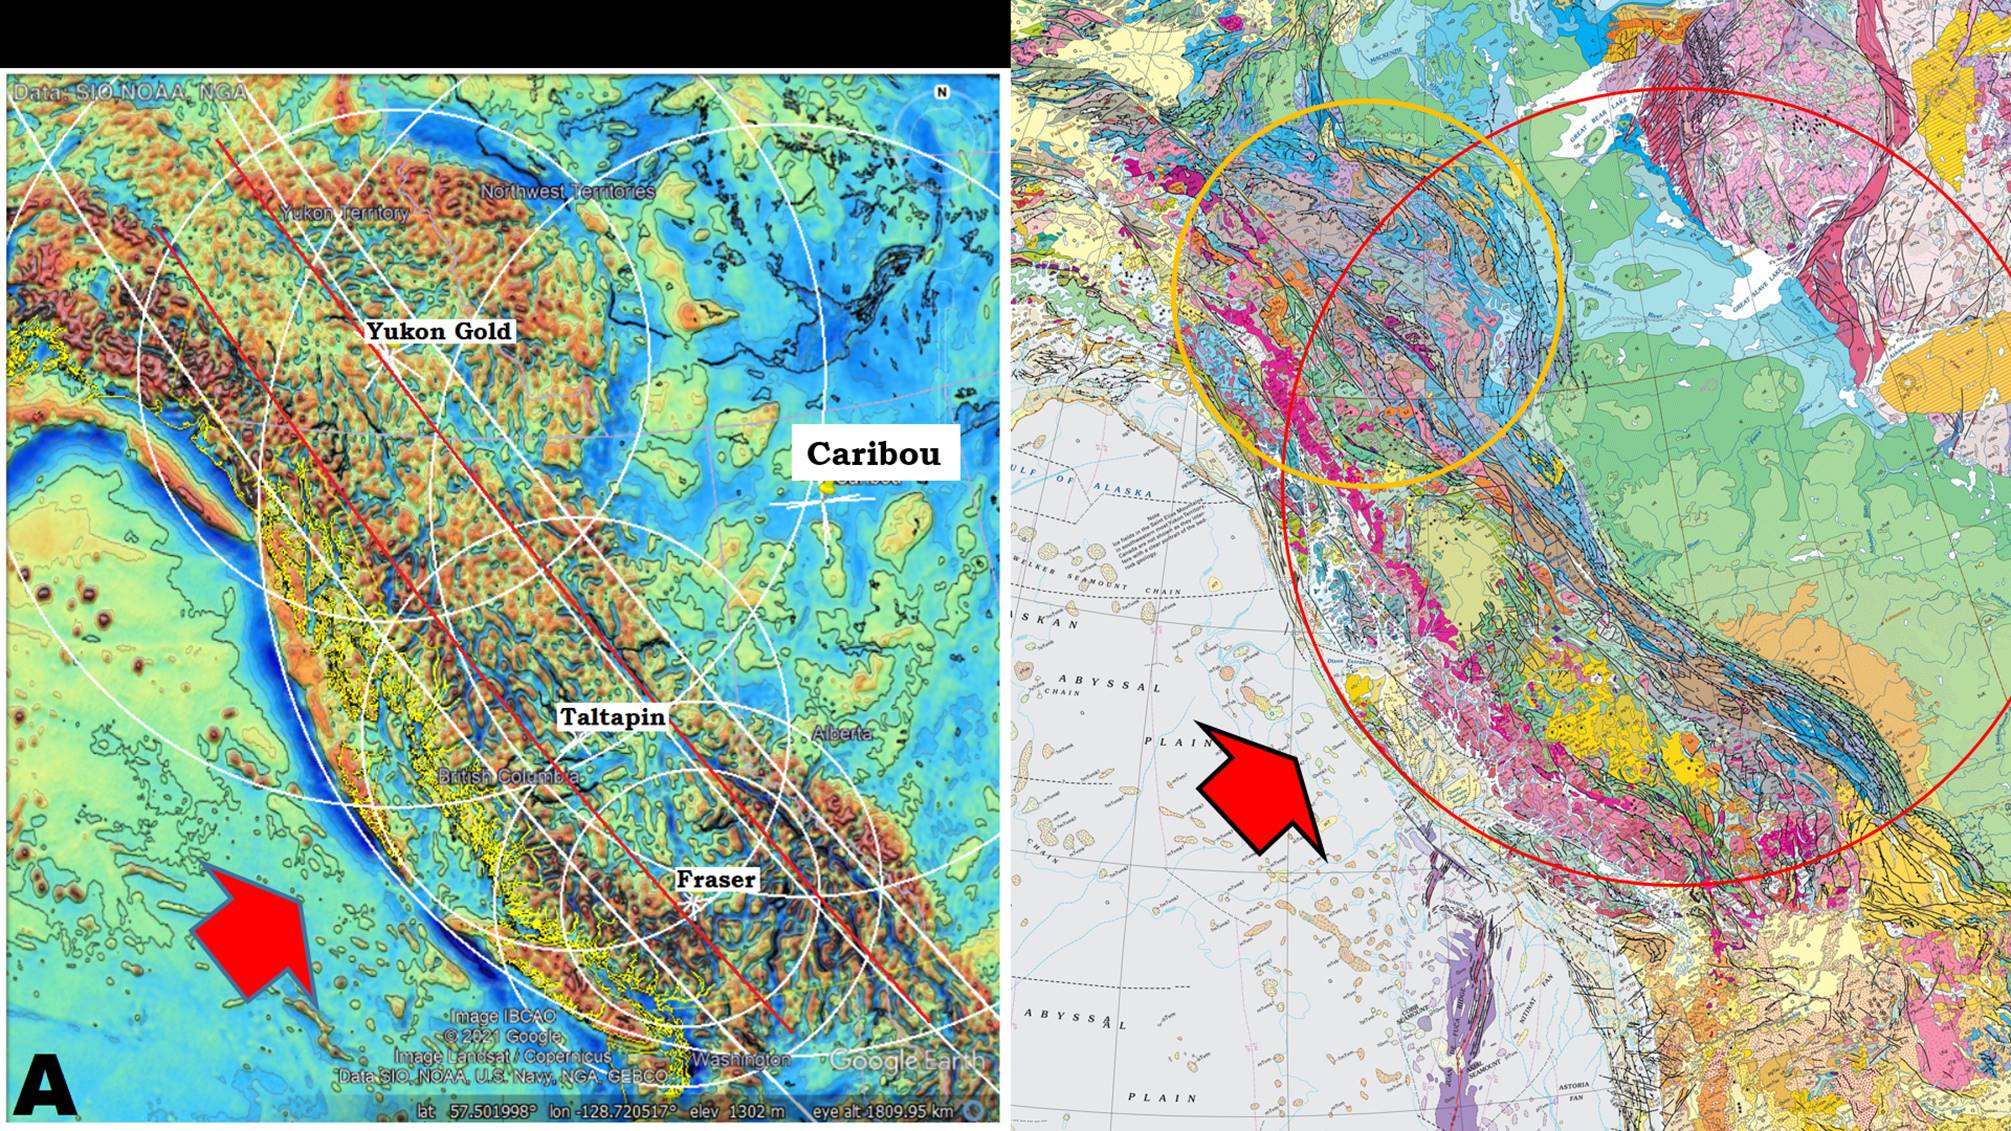 Figure 18: Now that you have seen the Yukon Gold, can you see the much larger Caribou crater? It is most obvious with its projection off of the continent into the Pacific Ocean. The Taltapin and Fraser craters are much harder to see, but as you train your eye, they also become visible. Can you see diagonal lines going through the mountains of British Columbia? That is Concentric Global Ring Structures (CGRS) from the Tasman Sea crater. They are also the source of one of the Mid Continental arches touted in some geologist analyses, extending down through Colorado. For this mid-continental arch, the source of shear lies 12,000 km (7,500 miles) away. Is it any wonder I will not allow any continental/plate or any other significant movement in the earth’s past. It just doesn’t work. Admittedly, I located the crater before I recognized the linear of the arch. But could this be a coincident that the plate moved into precisely the exact location to fit? By the way, I have located 20-30 of these distant correlations. In my book I document at least 8 covering the entire State of California. Is it a coincidence that the Yukon Gold and Caribou crater rings are reflected in surface geology in the right-hand map? I think not. Cratering not only determined the topography but also the lithologic makeup of the topography.
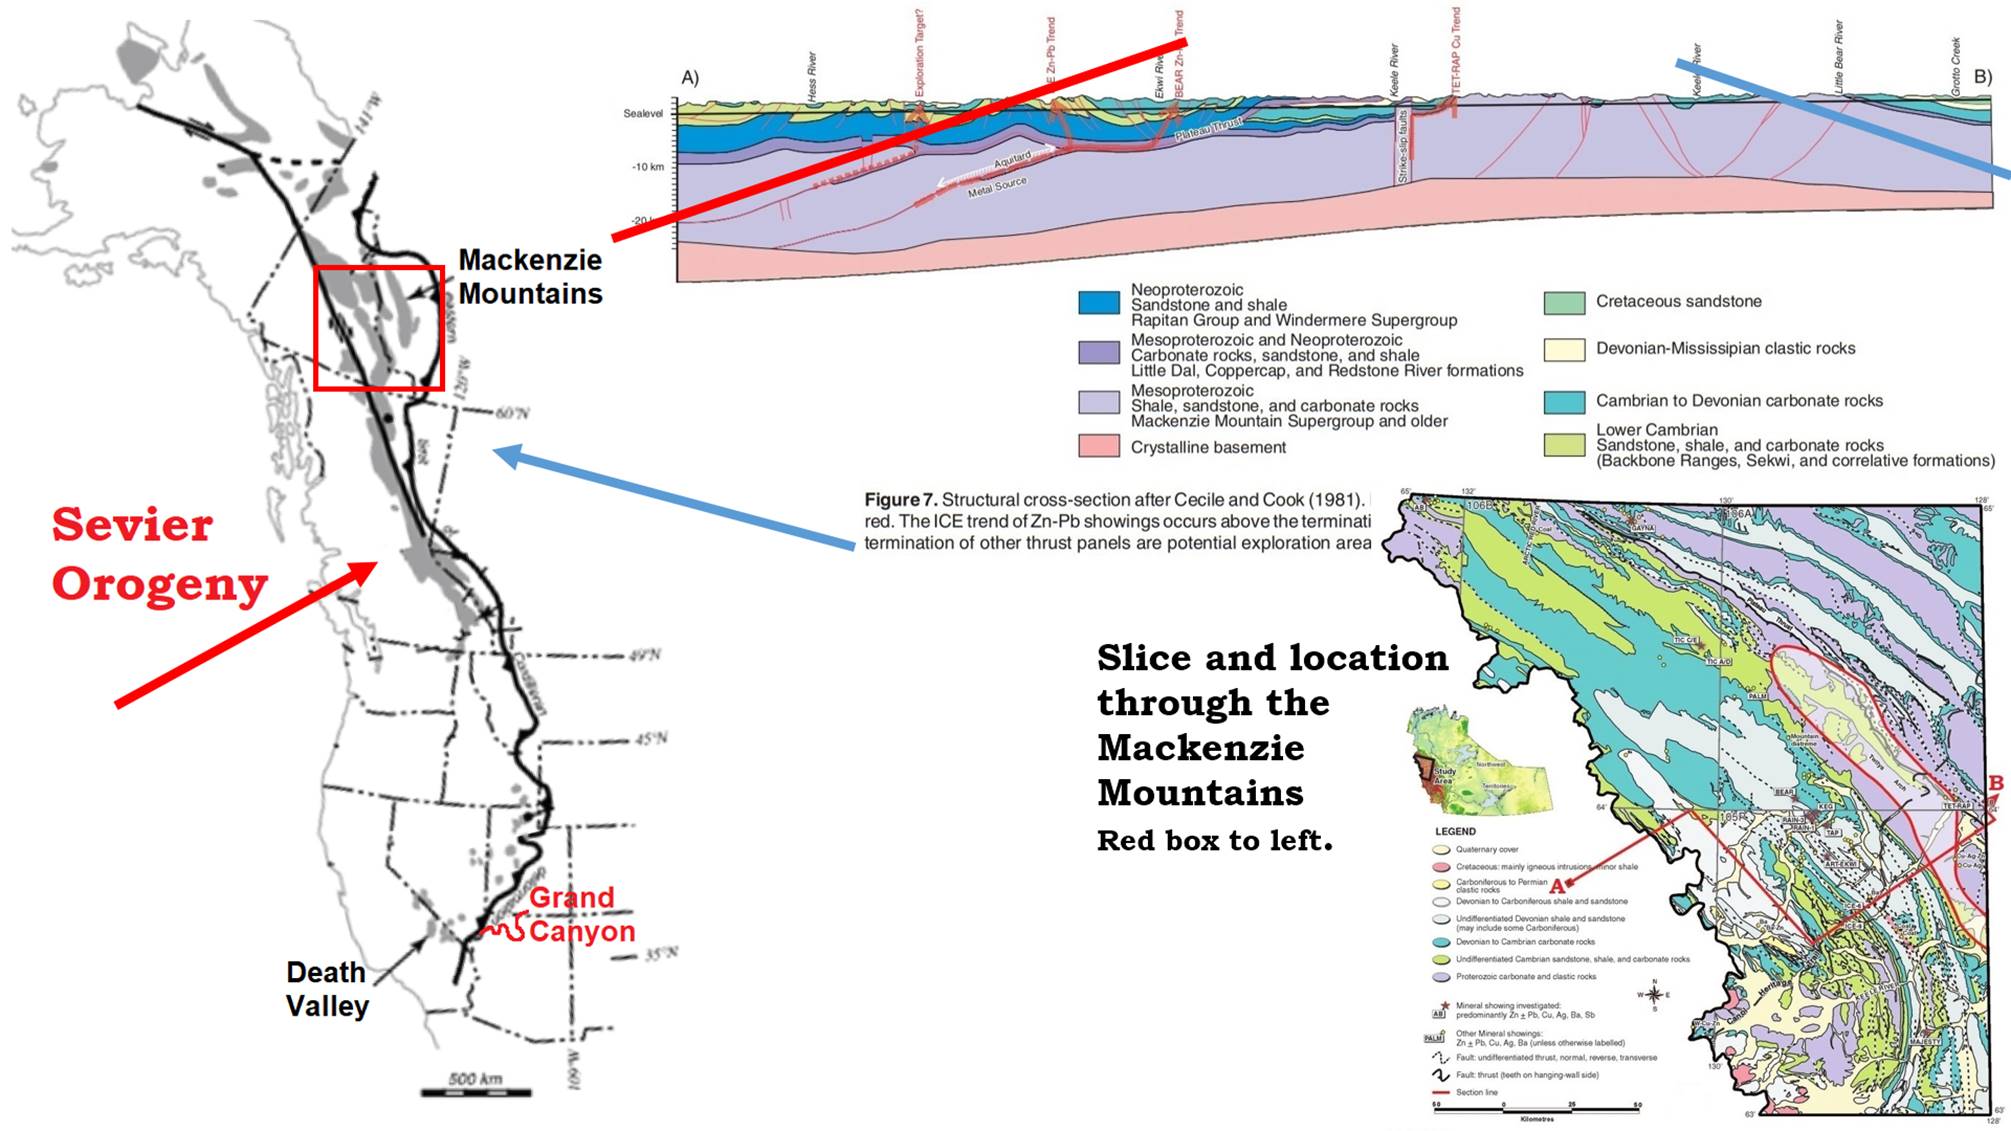 Figure 19: These lines and arcs in Plate Tectonics are referred to the Sevier Orogeny (fancy word for “mountain building”). The red arrow shows direction of thrust (the direction from the Tasman Sea to here), but the blue arrow shows another direction of thrust that runs near the Tasman line, It is only slightly different but it was real fun solving the small conundrum it caused. That source of shear/thrust from the east is the Azores crater. Yes, originating off of the coast of Spain, only 7,200 km (4500 miles) from where it shows up. I wish I could spend all of my time explaining the direction and special relationships in the Mackenzie Mountains, but that is an only partly written chapter in my book. But note, at the lower end of the Sevier Orogeny lies the Grand Canyon, and we want to get there.
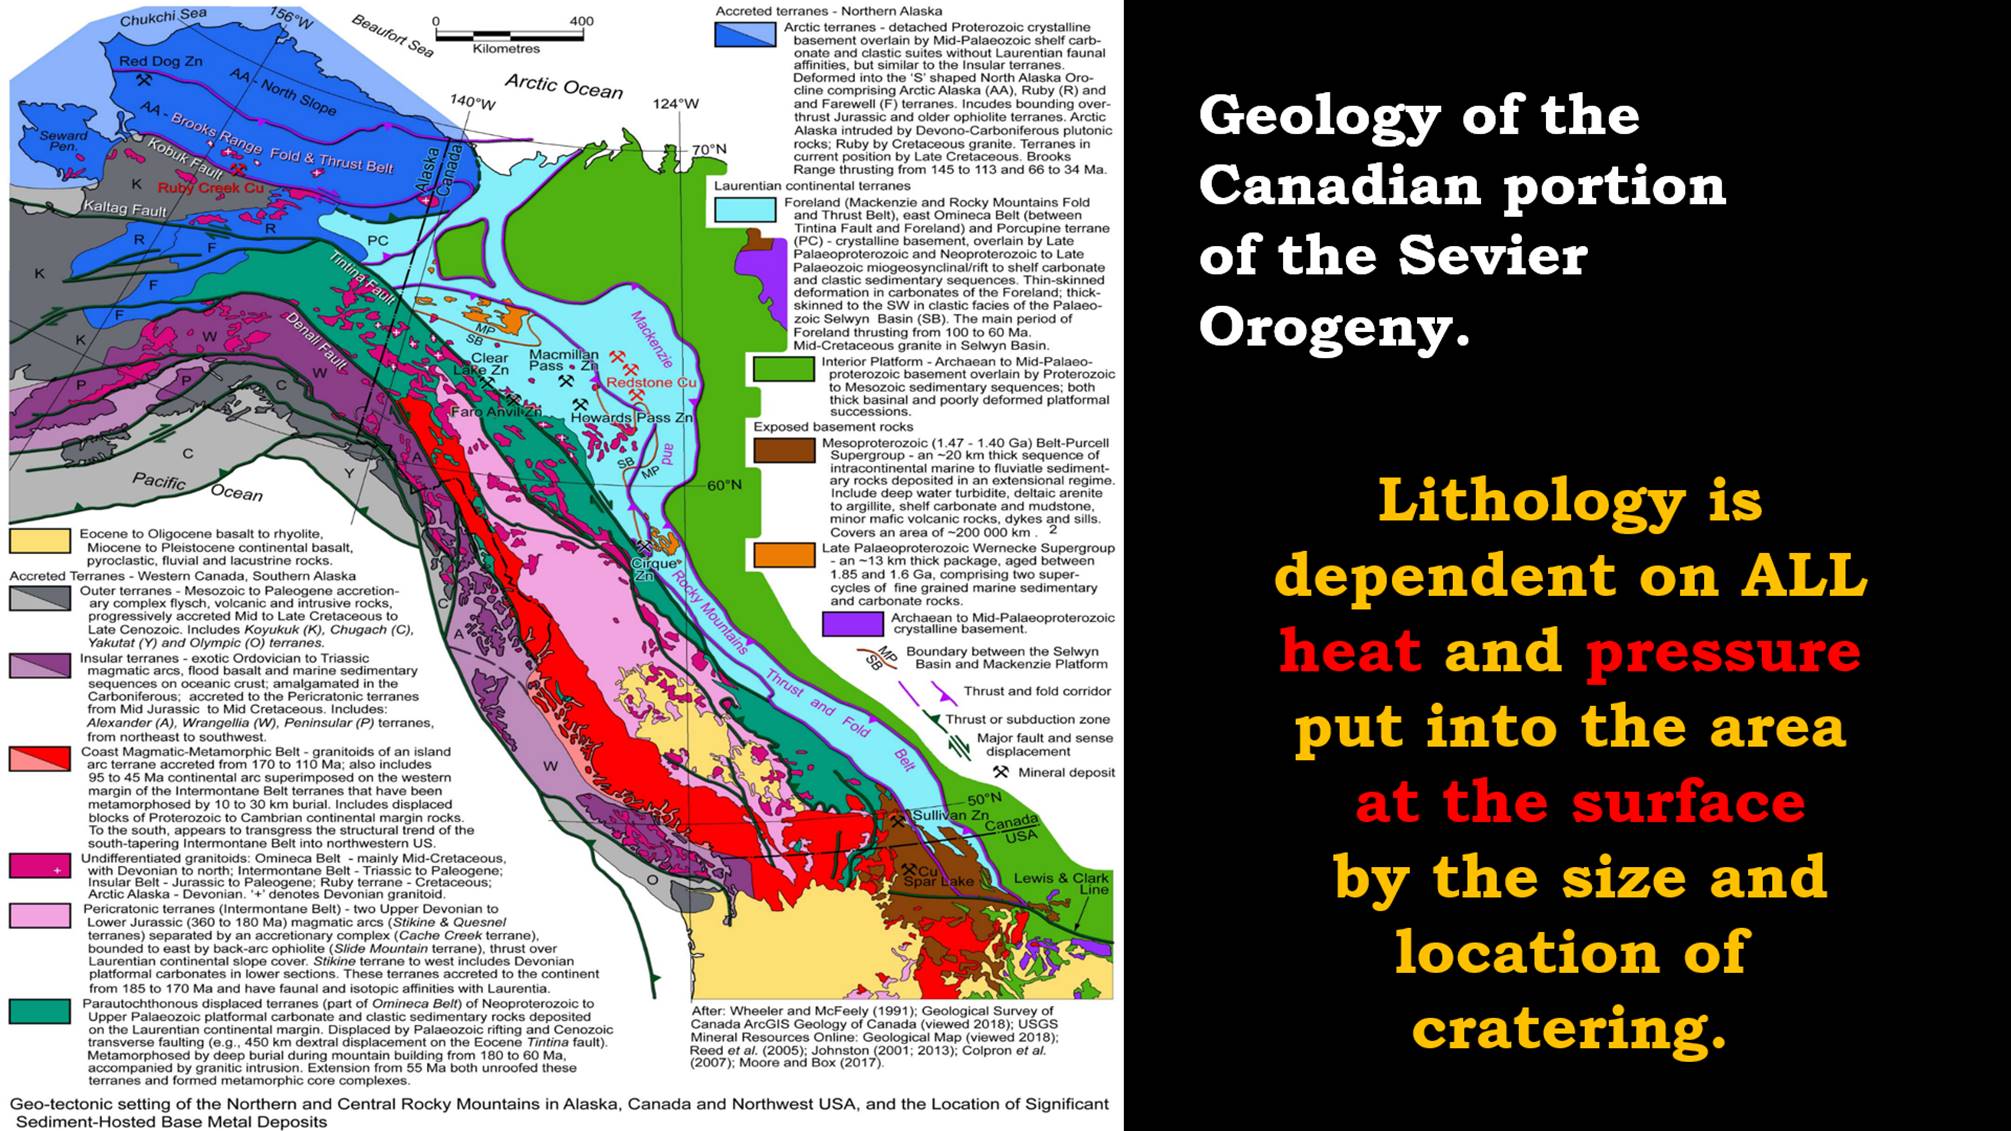 Figure 20: This is a Geology map of the same area of Canada. We can only see partial remnants of the cratering pattern. That is because the craters and lines work together to form much of the lithology. Events that occur together have results that reflect ALL of the involved sources of shear. Also, the heat and pressure that were already put into that patch of ground by large, previous crater. They all work together to bring the chemical composition up from the mantle together and crystallize the specific pattern of minerals found there dependent on heat and pressure. The pressure does not come from deep burial, but cratering on the surface. Carbon is pulled up in one place and turned to carbonate rock and in another place formed into kerogen, bitumen, and petroleum based compounds. The chemistry all depend on the available heat and pressure, the final energy envelope expression in the specific area.
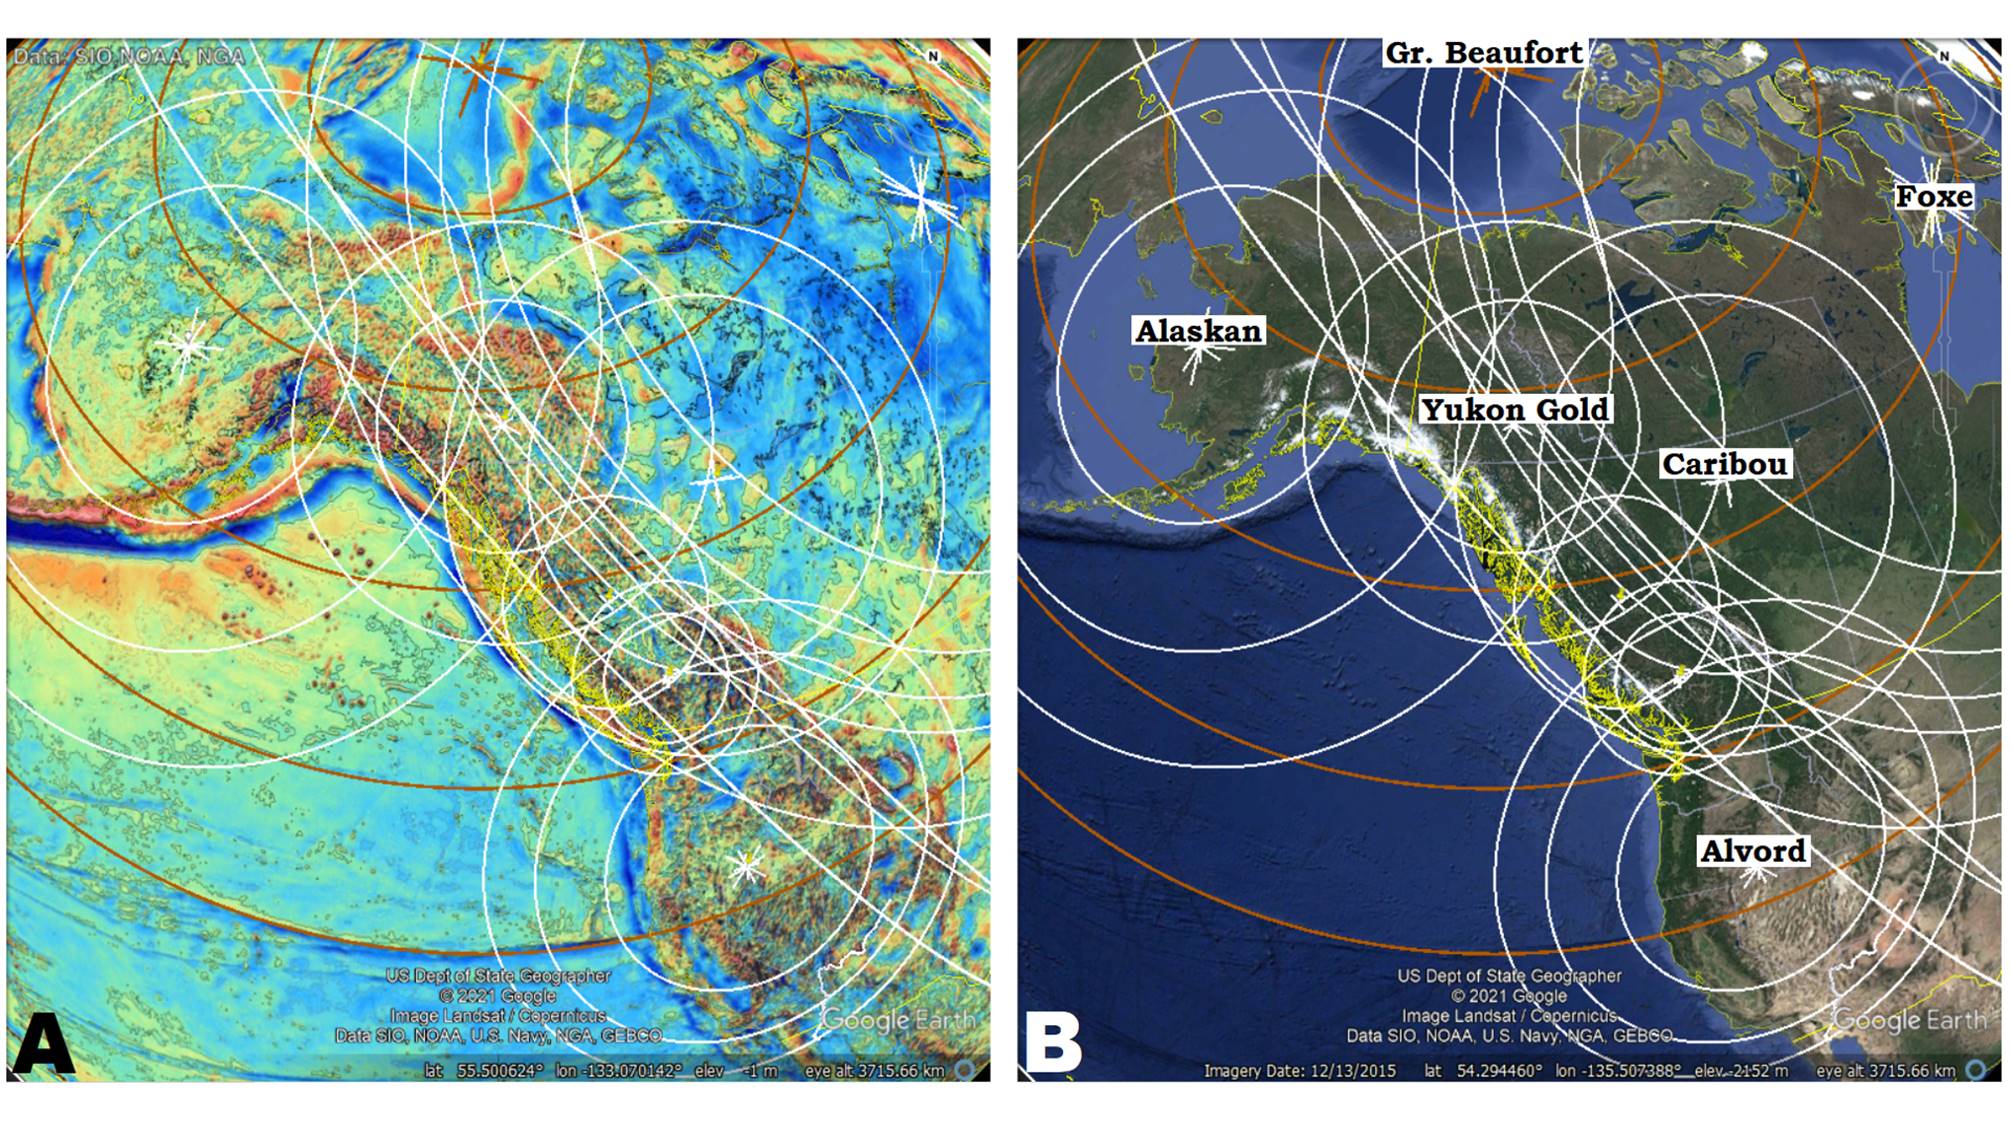 Figure 21: Ok, we got that much figured out, but don’t get too smug. Here is a slightly larger picture including Alaska to California. The Alaskan crater makes a HUGE impression on the northern end, and the Alvord makes a pretty big one on the south end. But the Greater Beaufort and Foxe made additional contribution. The Greater Beaufort was a bit later than the Foxe and opened up some of its concentric fractures to spew the Franklin Large Igneous Province out over much of Northern Canada. Yes, volcanics are a direct result of cratering. Can I expect you to understand all of these cratering circles? If you take only one thing from this, I hope that you will take a mental image of the globe covered with all of these circles. Circles that have their source in points of shear pressure caused by astral-impactors that created the craters that formed the lithology and shaped the topography. These circles are associated with all of the geology we know, and the more we study them the more we can explain the geology.
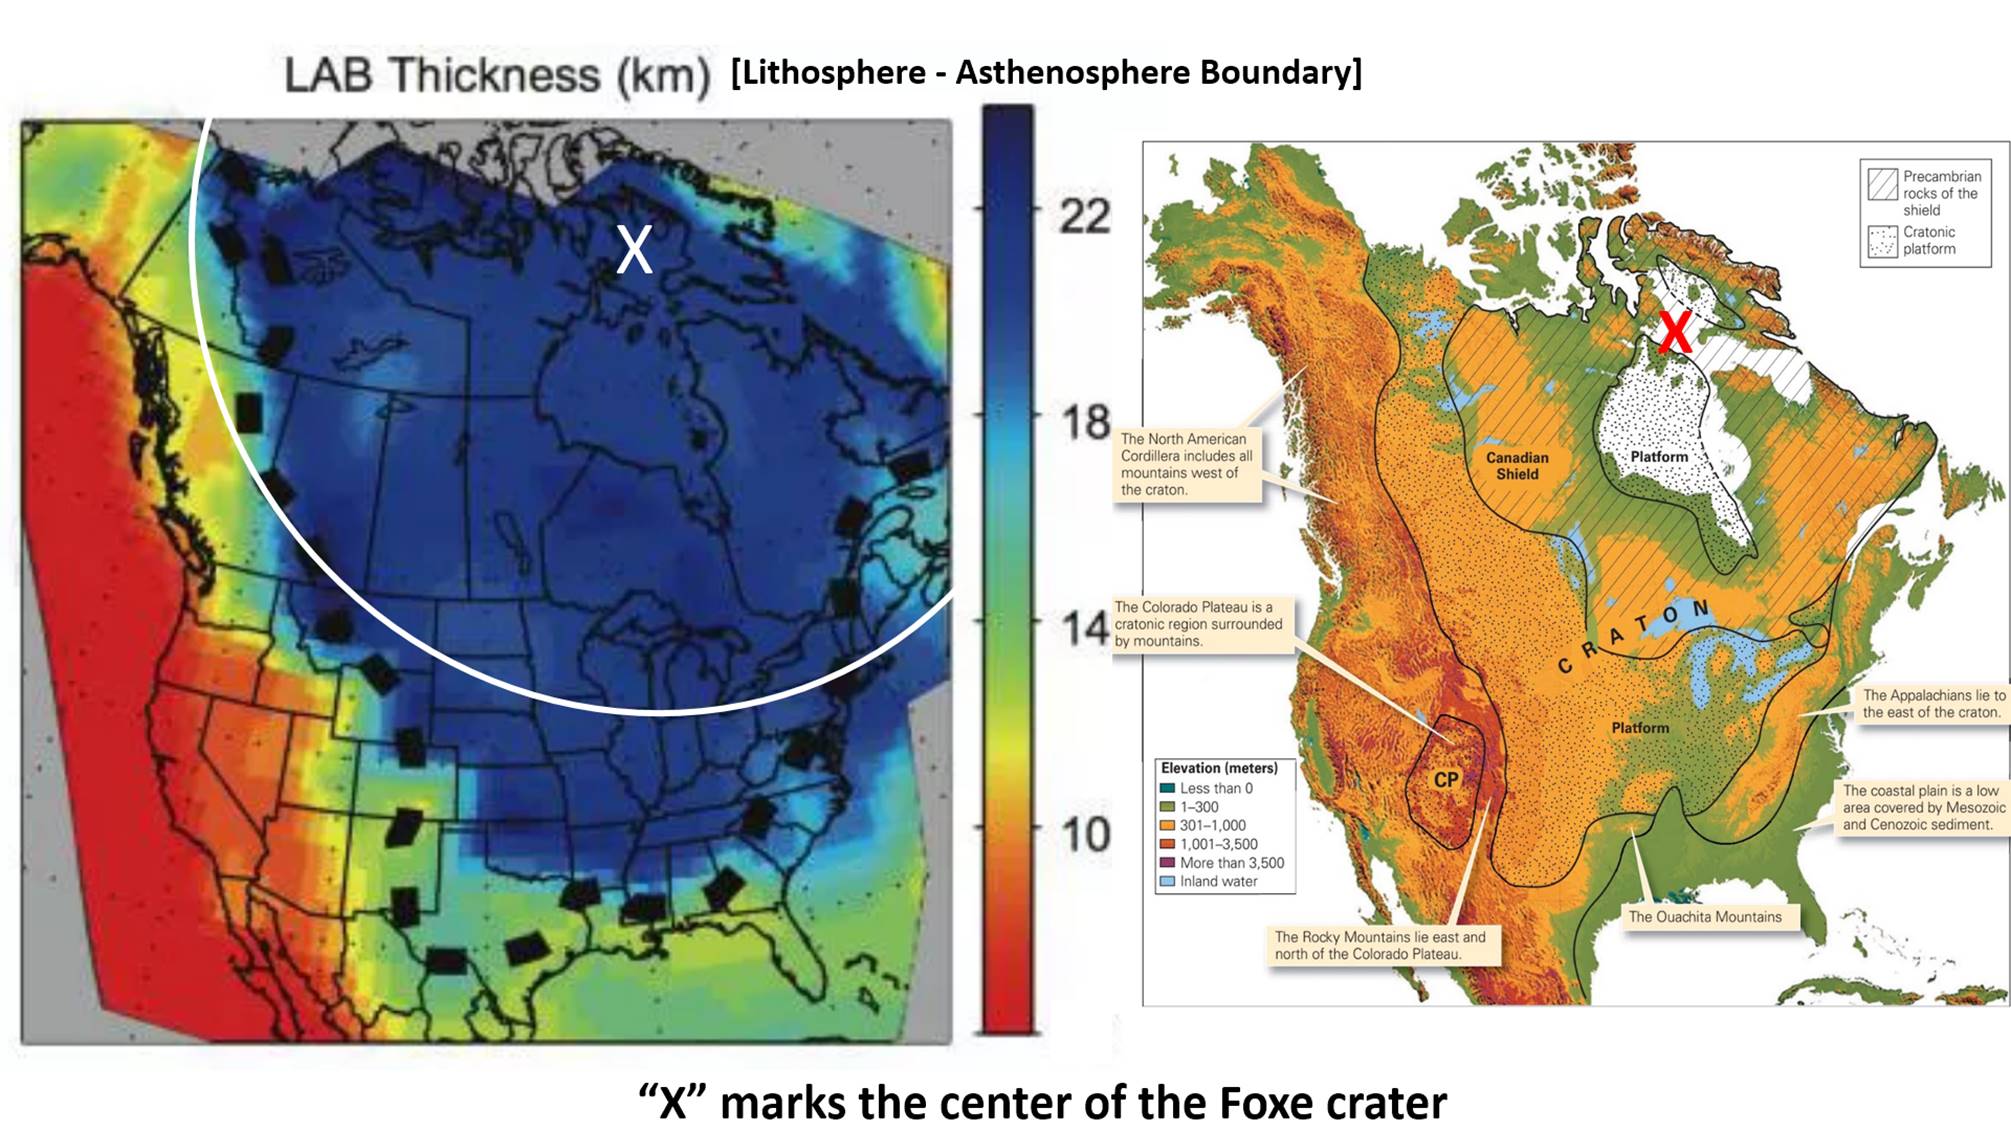 Figure 22: A craton is defined as a large stable piece of deep crystalline rock lithosphere with sedimentary layers on top. The large blue area is certainly the thickest portion of the crust? Could that be a result of the large Foxe crater that compression melted the rocks to great depth? As a result, energy signatures of later craters were simply lost in the massive energy signature of the Foxe crater leaving what I term “ghost crater.” It looks like South Pole-Aiken on the moon. How similar the craton and the deep LAB boundary is to a maps of the Laramide Ice Sheet. When I first saw this spatial relationship and realized cratering produced rock surface scour, large erratic boulders, and piles of small breccia to sand to loess sized particles. The same evidence that is used to support the ideas of glaciers and an Ice Age. Did an Ice Age happen, or are we mistaken in the genesis of the evidence ascribed to them?
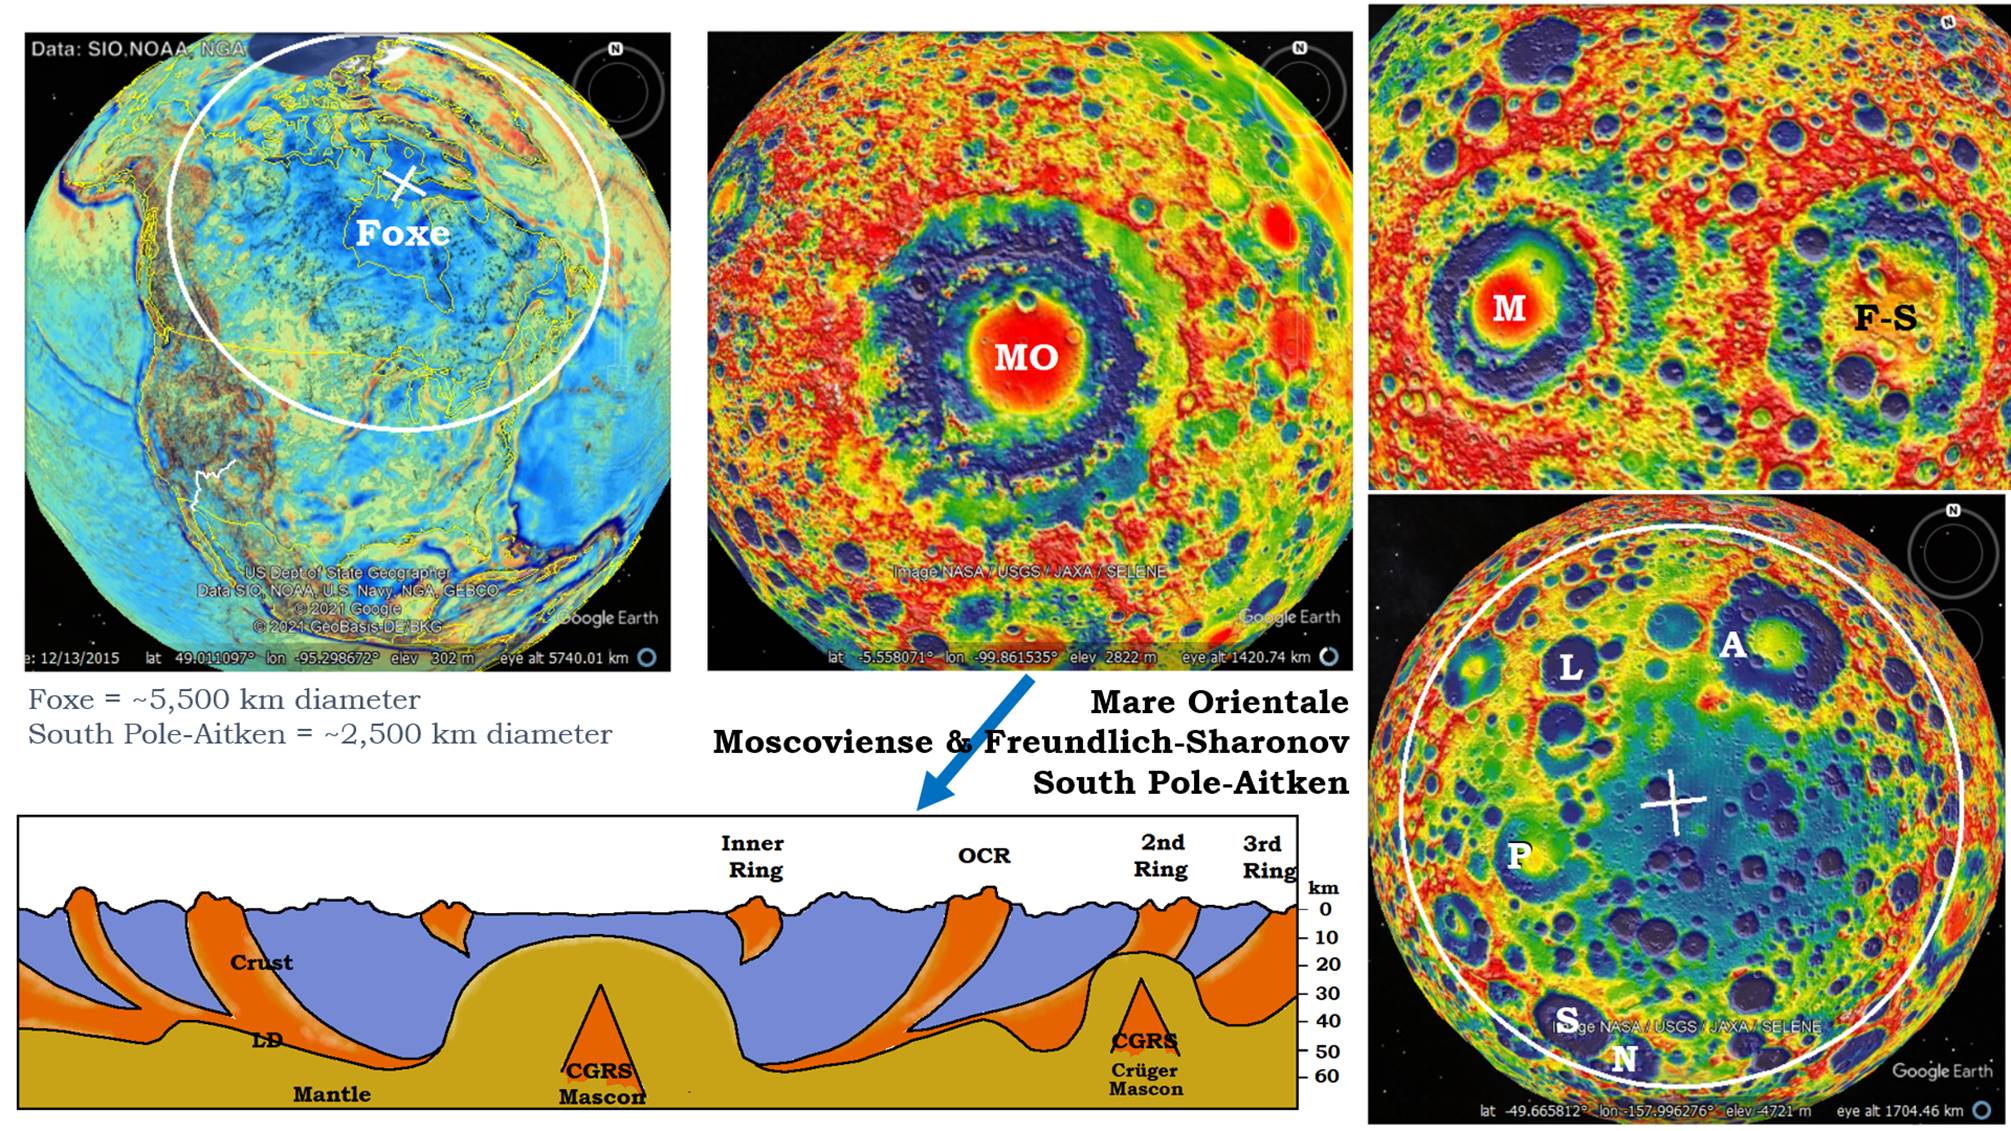 Figure 23: Compare the Foxe crater image with several moon craters. These are all gravity images, so all of them have large blue centers of low gravity, but several of the moon craters have a red mascon in the center of the blue. Since the mascon is a dense up thrust (CGRS) from the mantle originating at a distant shear/cratering center, the craters would have had to form after some other large craters which would produce the CGRS that formed the mascon. South Pole-Aitken, lower right, and the Foxe craters do not have obvious mascons, and I will propose part of the reason is that they were both formed early before other large craters could form CGRS to produce mascons in there centers. There could be other differences as well. We know the South Pole-Aitken is a mantle cored crater, so a mantle up warp is not enough to form a mascon. It has to have an additional up-thrust compressed by the shock wave’s CGRS from another crater.
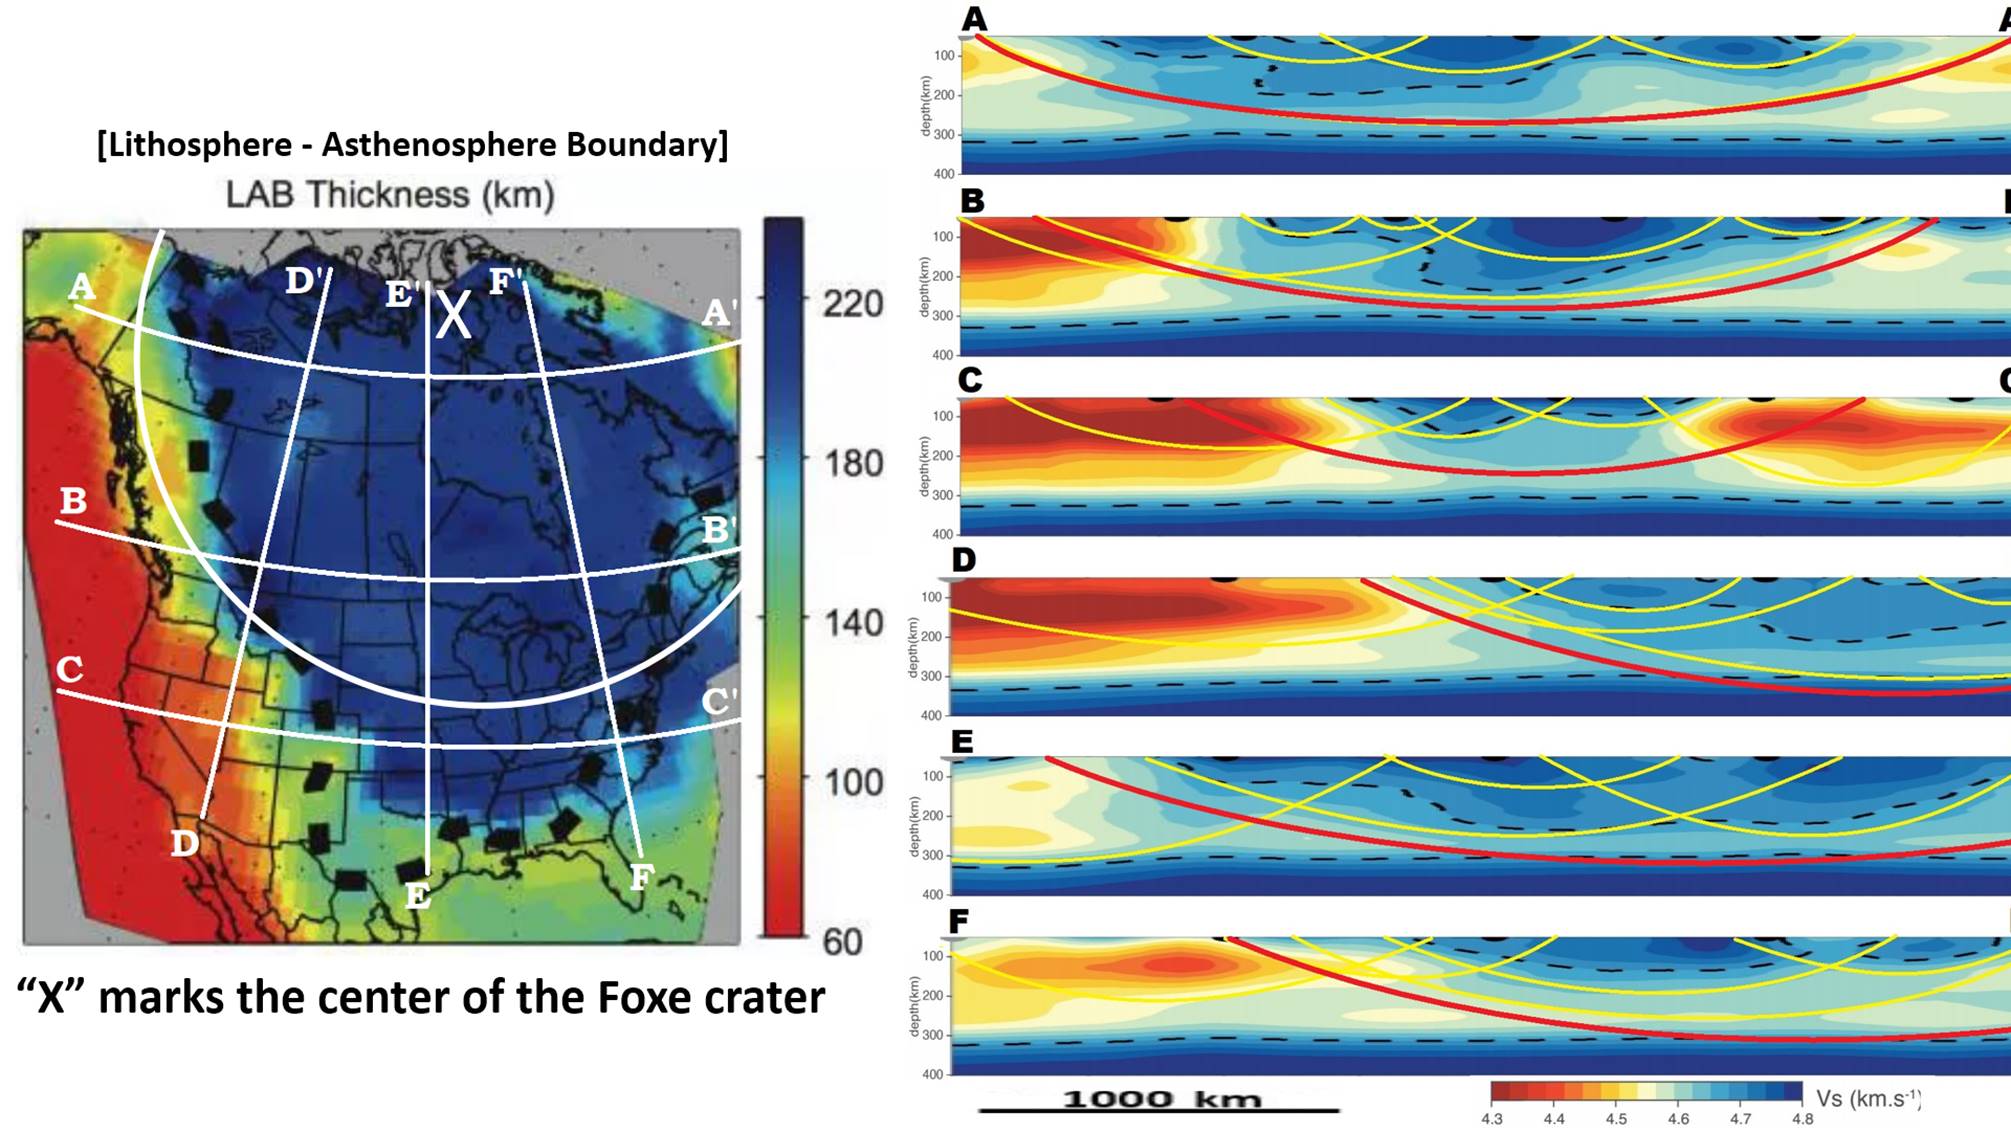 Figure 24: These are six tomographic sections through the North American continent, three west to east and three north to south. The resultant arcs are the proposed pressure energy signature of the bowl depth of craters. I have indicated in yellow some other contained pressure bowls of later and smaller crater. There are alternative interpretations when more detail is seen. Robert Watchorn is one of the few individuals I can locate worldwide that is significantly studying craters.
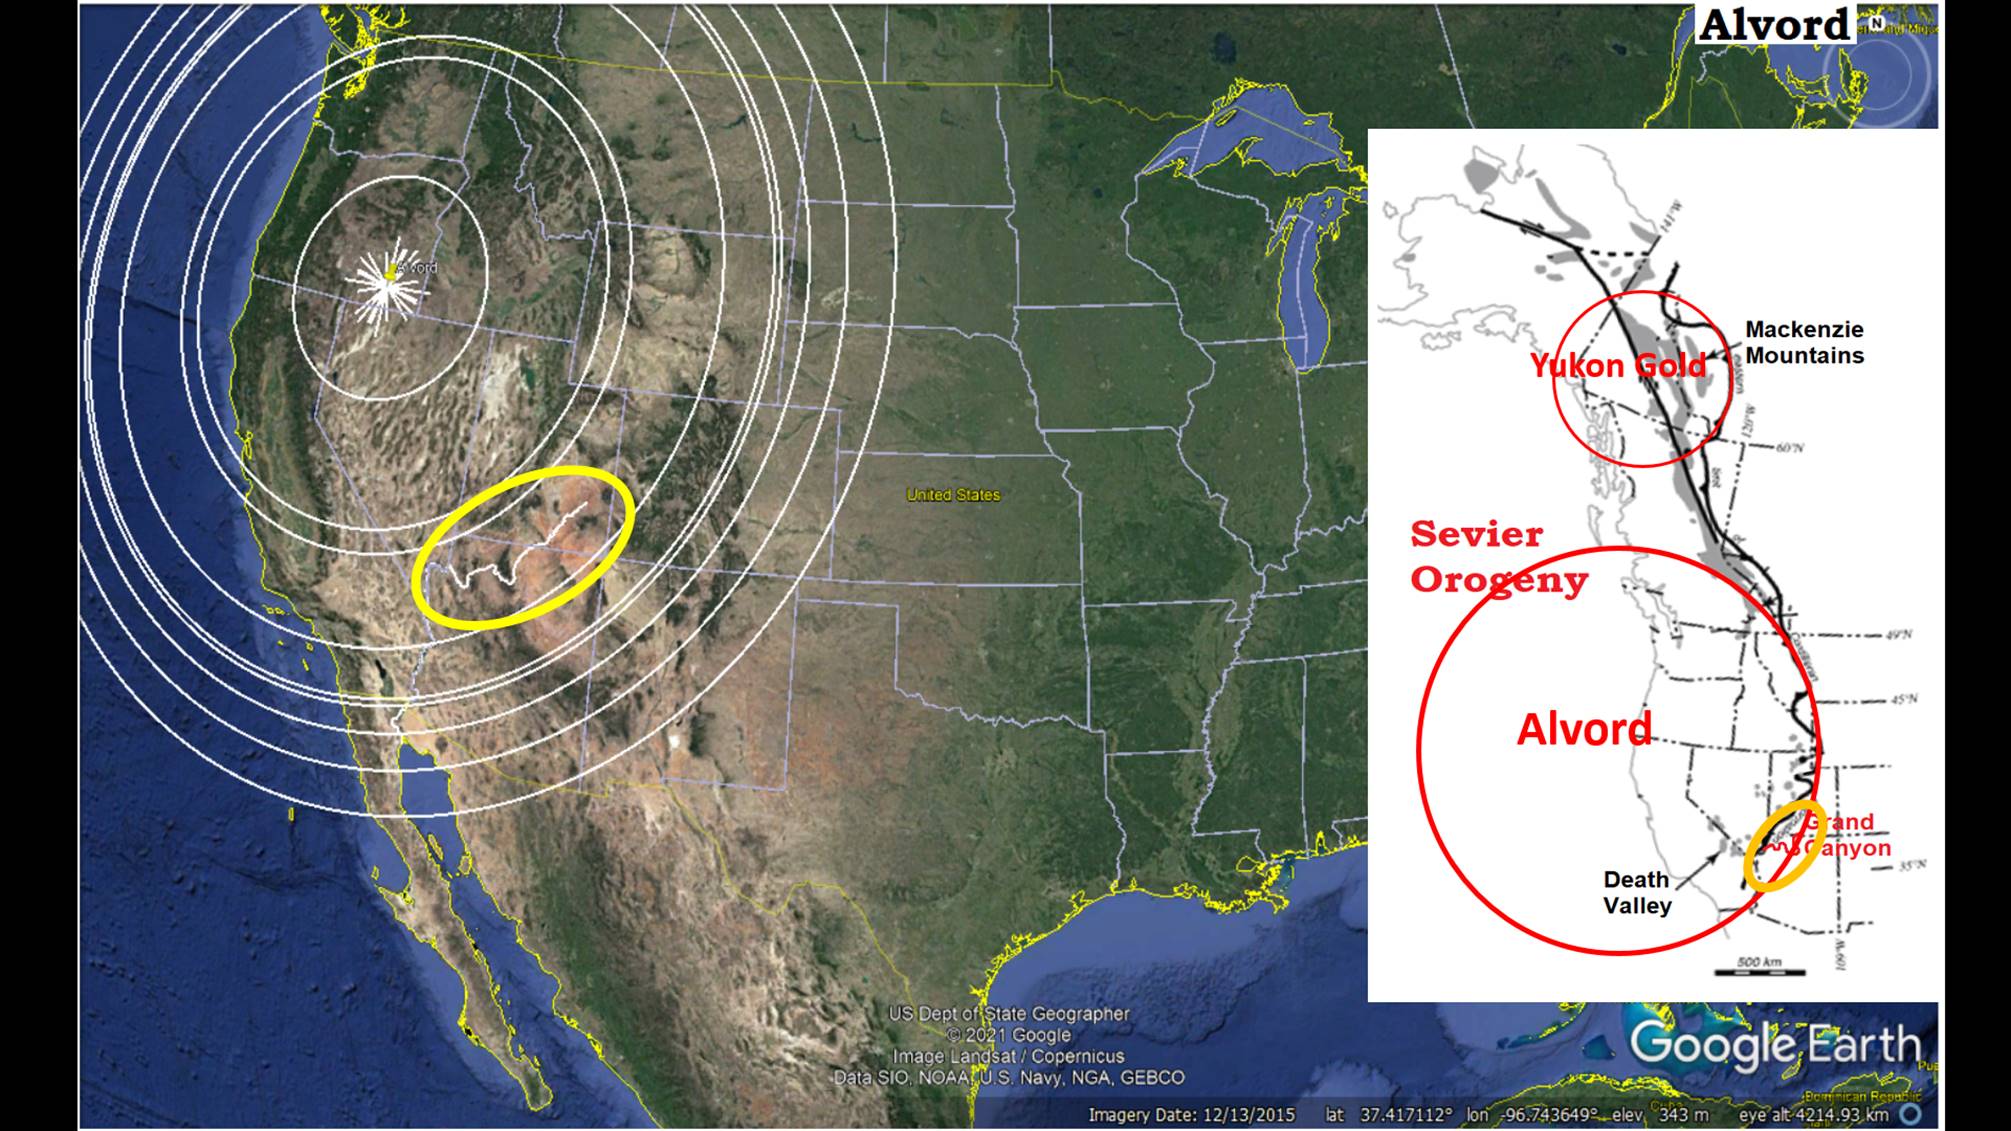 Figure 25: The Alvord crater anchors the south end of the Sevier Orogeny thrust zone like Yukon Gold crater anchors the northern end, connected by the Tasman Sea linears. See the white wiggly line between the 3 and 4-ring? That is the location of the Grand Canyon.
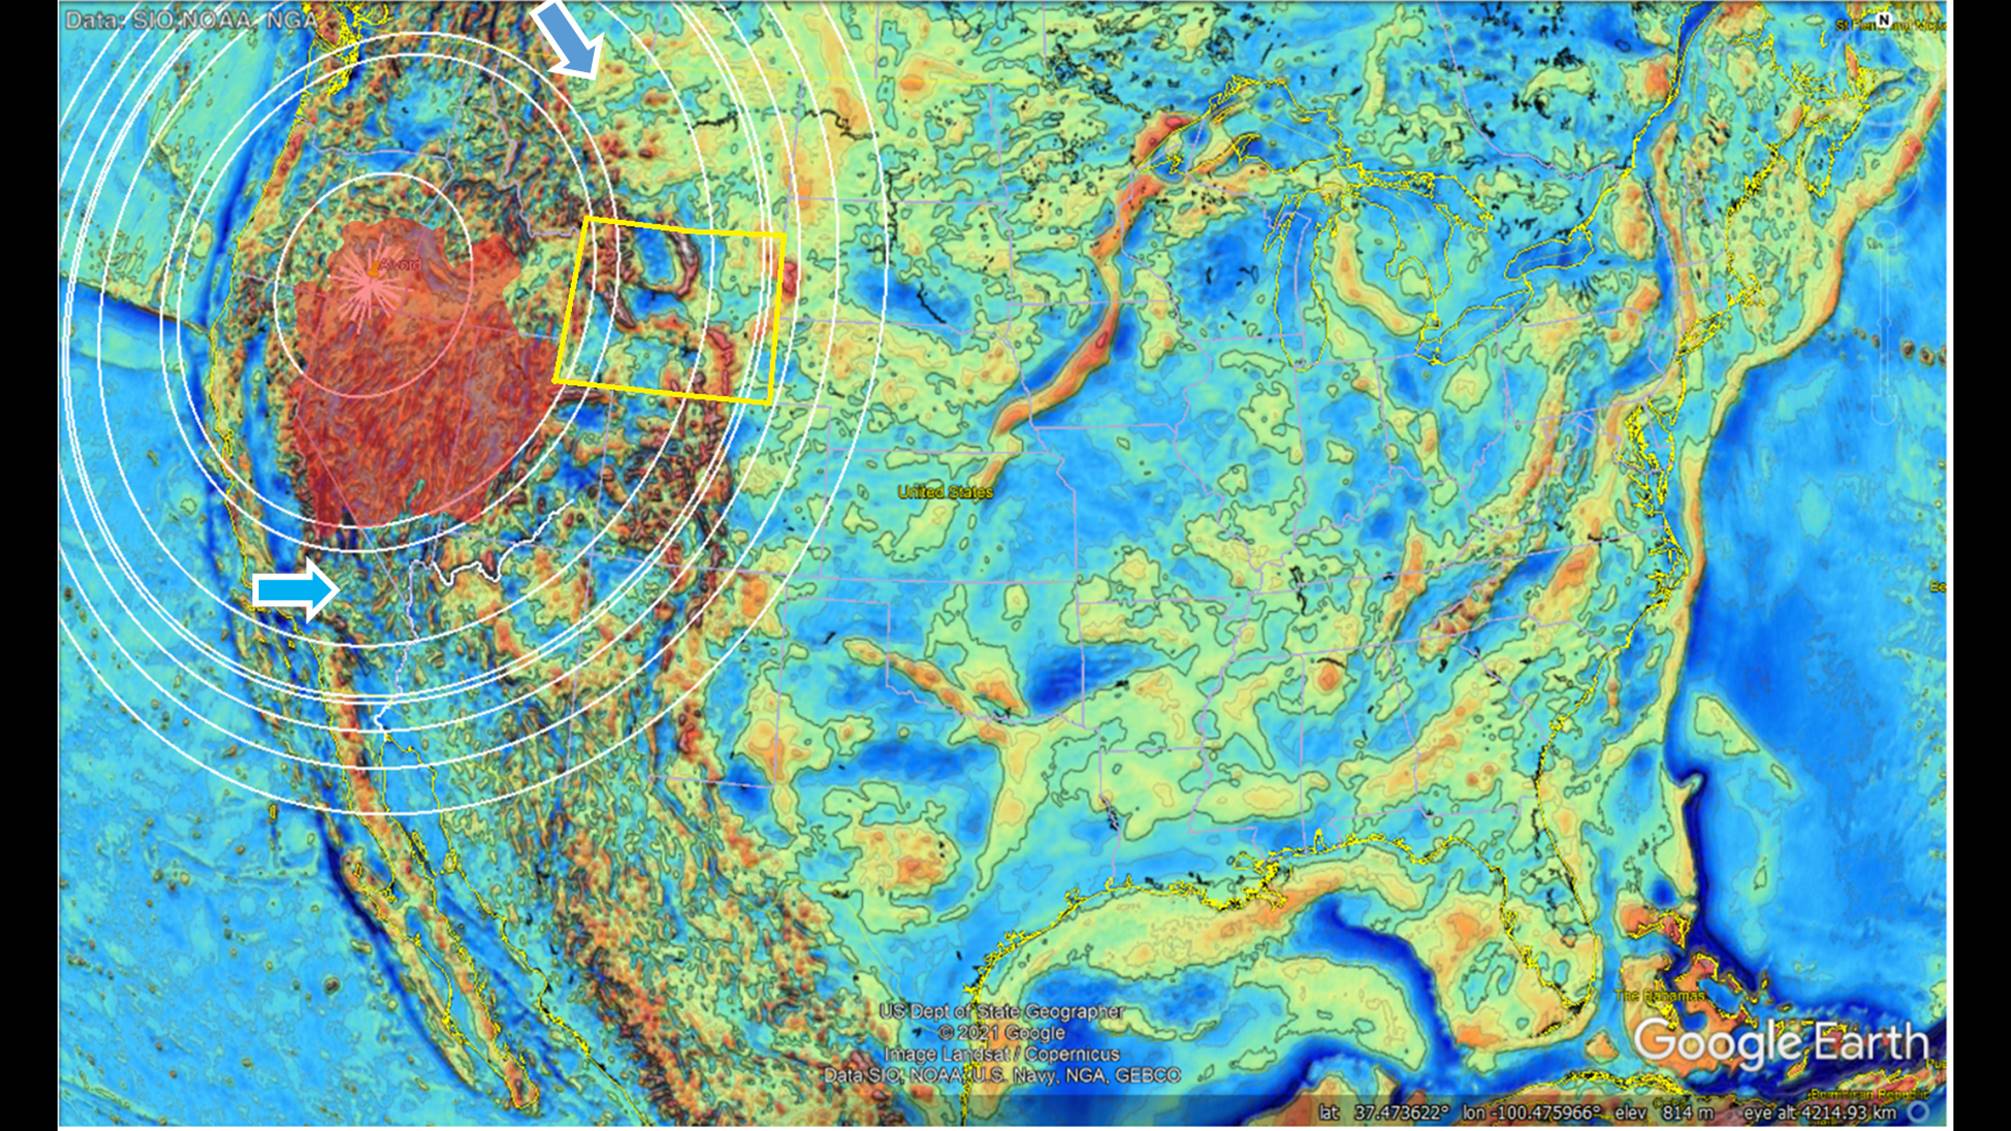 Figure 26: Seeing the Alvord crater in gravity map, the Great Basin is at its center and the Grand Canyon between rings 3 and 4 in a wide primarily dark blue ring. Just inside this blue ring, the 2-3-ring is the location of the Sevier Precambrian Thrust Belt of western Wyoming. The early Alvord crater is not alone in this position. Is it just a coincidence that the Grand Canyon occurs in the broad dark blue area of low gravity?
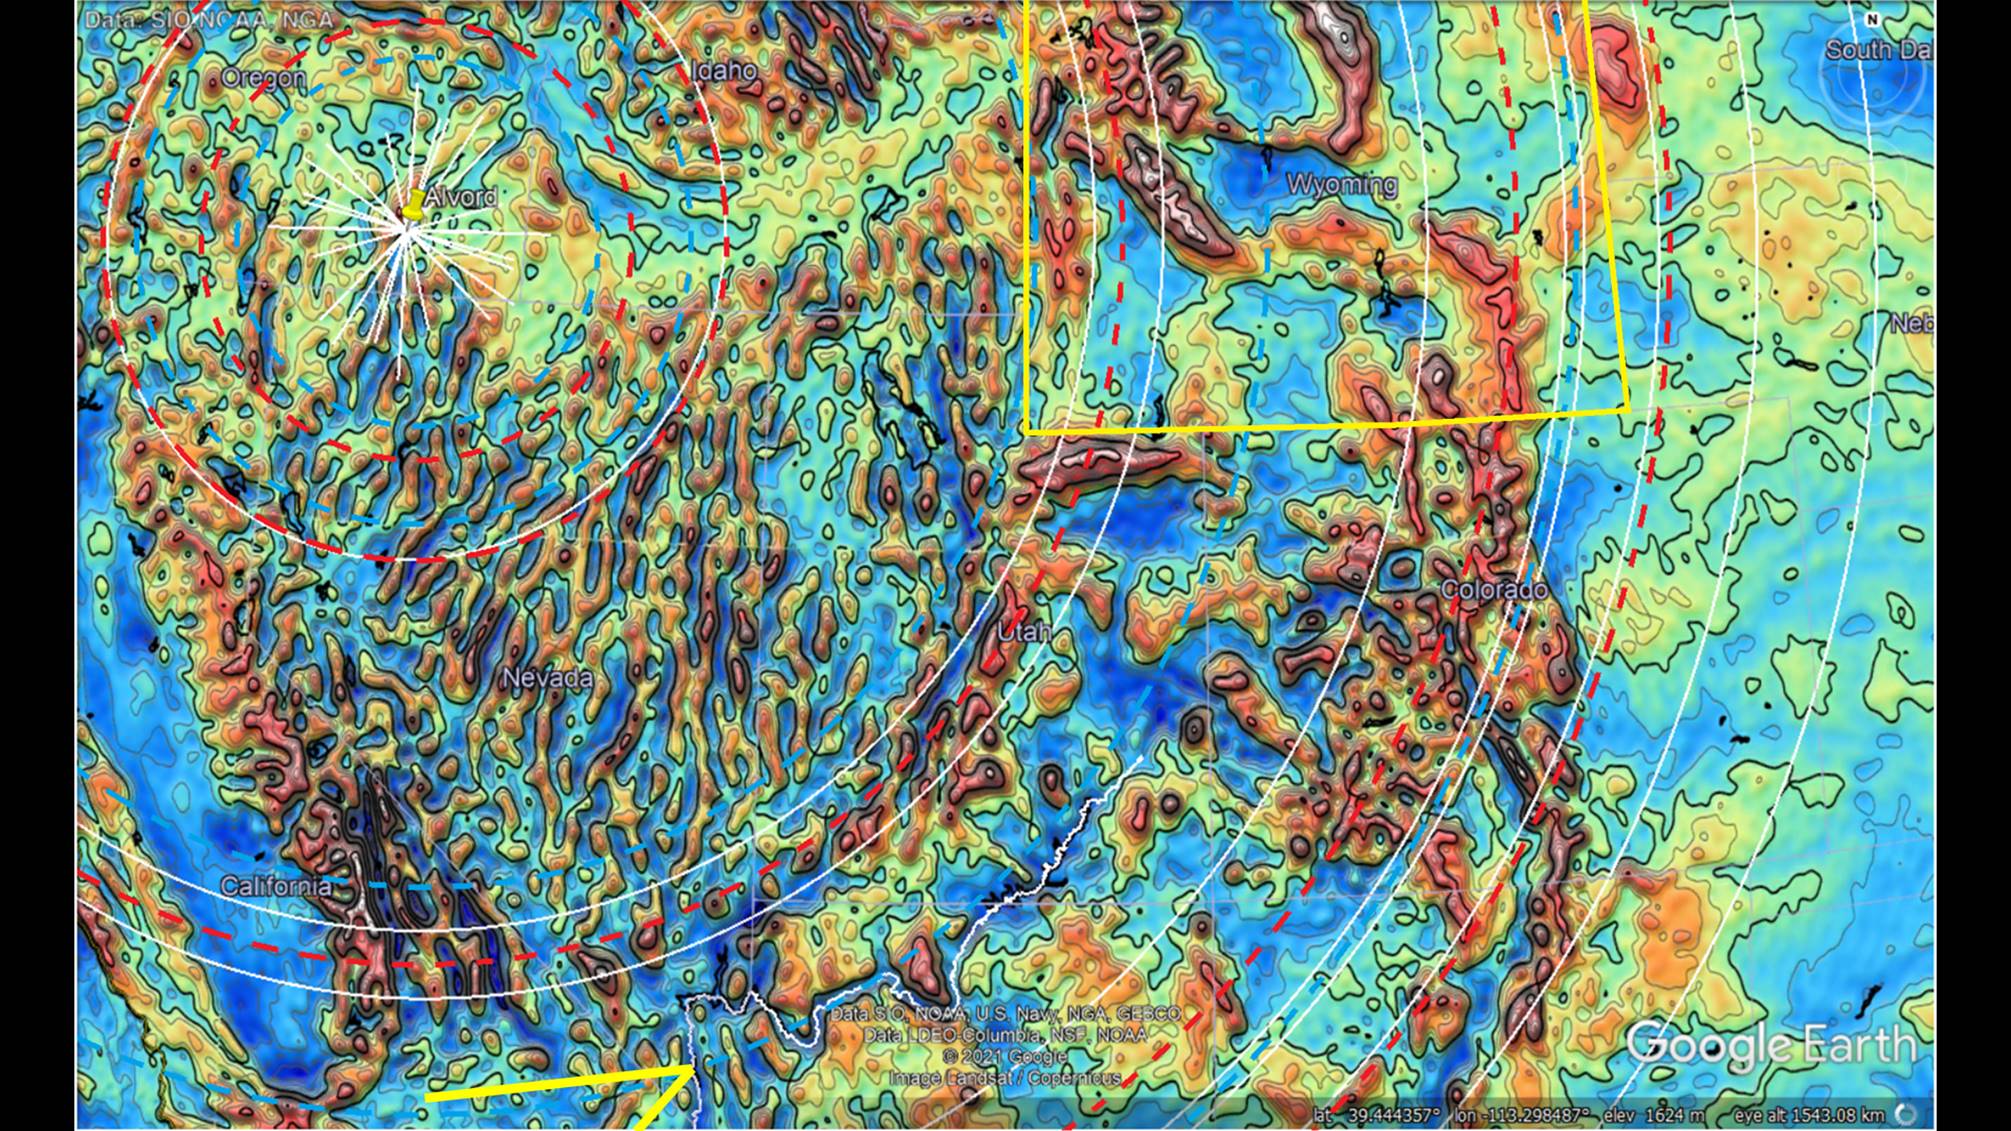 Figure 27: Remember near the start, I said seeing impact shockwaves in gravity is like seeing ripples from a pebble in a pond. Everyone is asking the question, how do I see the Alvord crater? I see the ripples and you can too. Some compression rings are shown with dashed red linears. The one between the two white rings near the west edge of Wyoming is the one that formed the Sevier Thrust Belt. If you look inside that red dotted linear, you will see a blue dashed linear. I admit the blue ones are easier to see in gravity, and the red ones are recognized for their relationship to the dark blue linears. The wide dark blue containing the Grand Canyon (marked with yellow arrow) is most obvious. But, can you pick out the 5 high gravity wave ridges?? Yet, the Sevier Thrust Belt was not formed by the Alvord crater alone. Across Wyoming its thrust edge has been overridden by another crater slightly to the west. This belongs to the Blowout Mountain impactor.
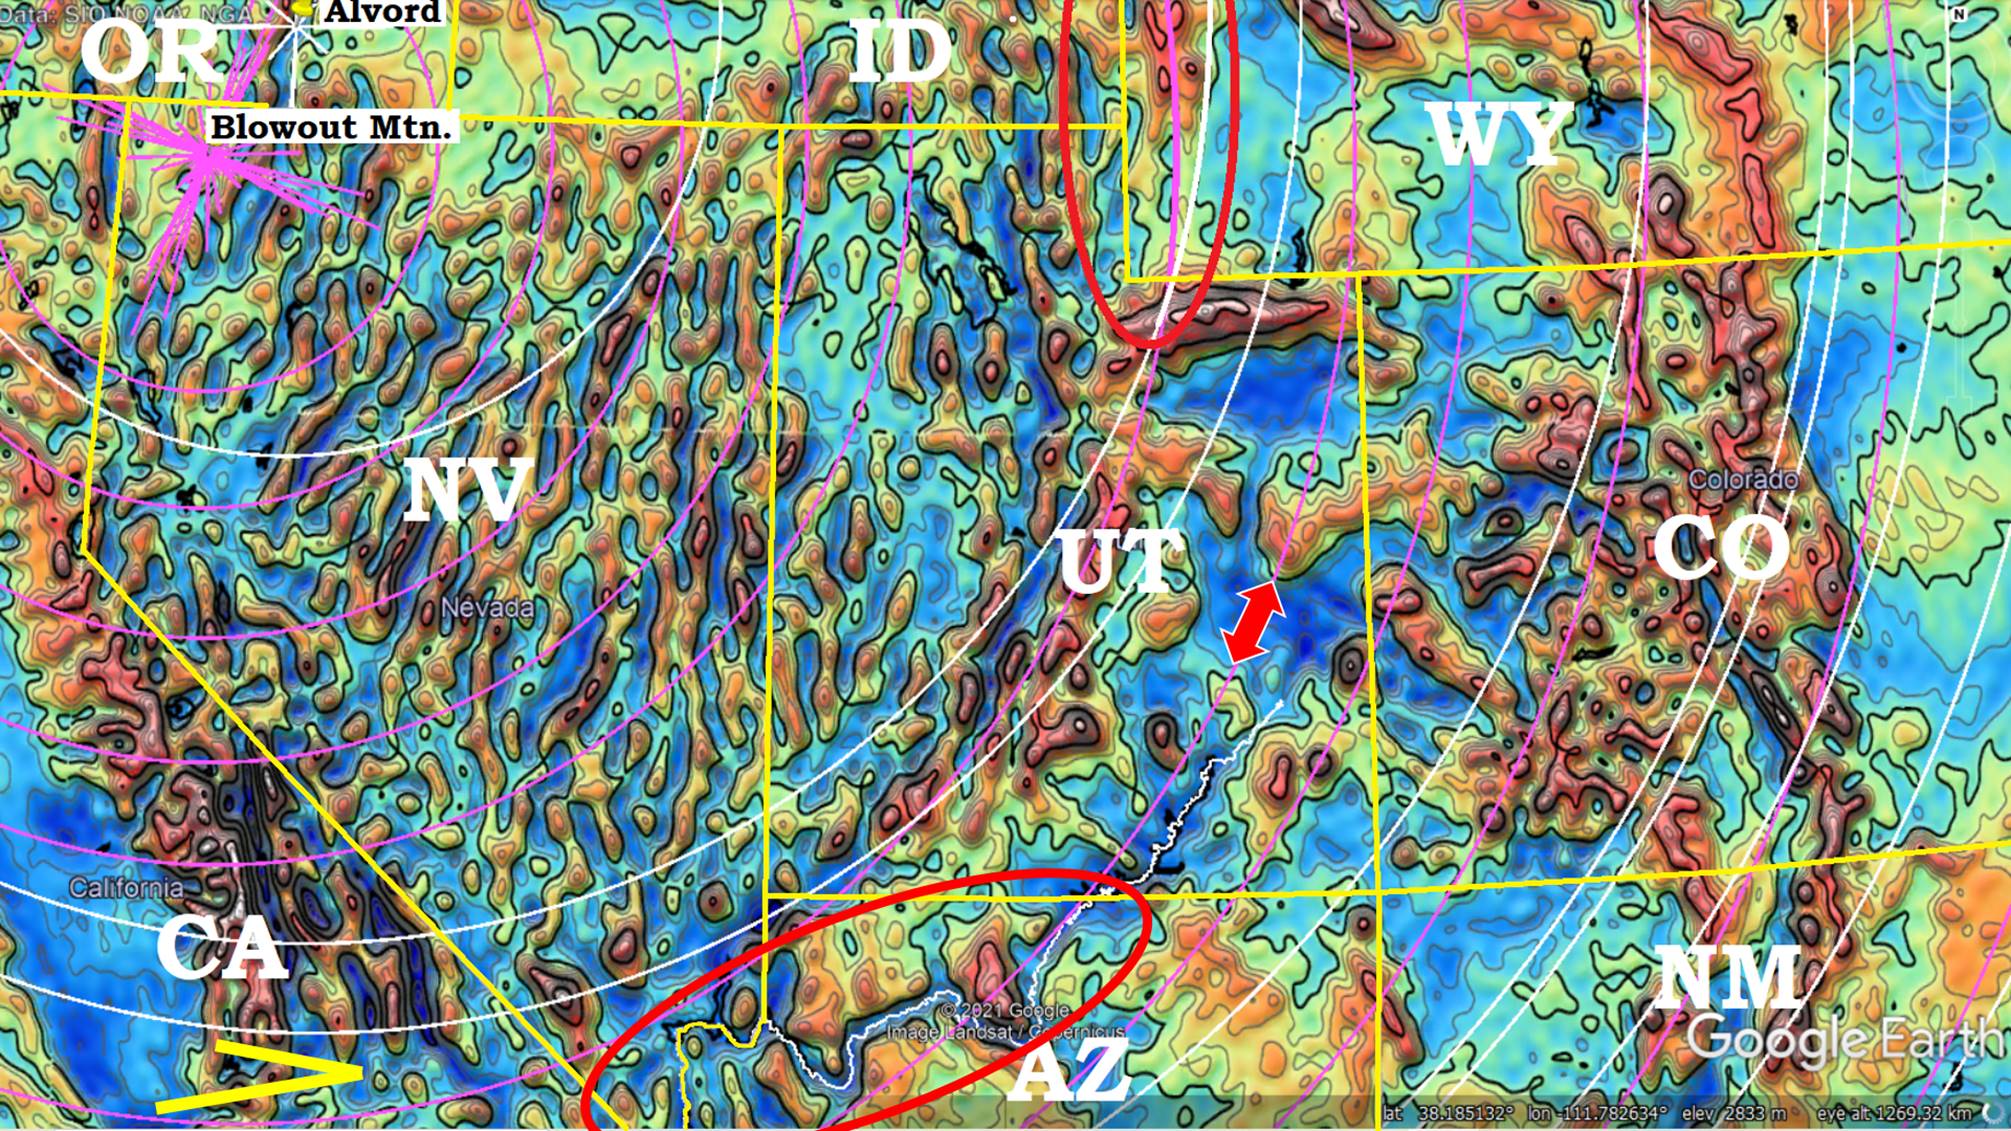 Figure 28: An enlarged view from Figure 27, including the pink rings of the Blowout Mountain crater. The Blowout Mountain center is in nearly the same location as the Alvord, but slightly to the west. That causes the Sevier Thrust Belt to draw back towards the west, nearer the western edge of Wyoming. The thrust edge is marked in a red dashed linear. Just inside the high gravity ridge is the following release-valley marked with a blue dashed linear (yellow arrow). It was this section of the blue ring that first led me to separate the thrust ridges of the Alvord from that of Blowout Mountain. The high gravity ridge marked with the red arrow is almost lost in that wide blue linear from the Alvord, but it does correspond with a couple high points near the Grand Canyon. The combination of the Alvord and Blowout Mountain faults has led to the assumption in geology that faults can be formed in the Precambrian and later reactivated in the Cretaceous. Alvord crater’s sediments and faults are dated as Precambrian, and Blowout Mountain’s sediments are dated as Cretaceous or later. They both have a significant presence across the entire Rocky Mountain region as their own distinct fault, not reactivated.
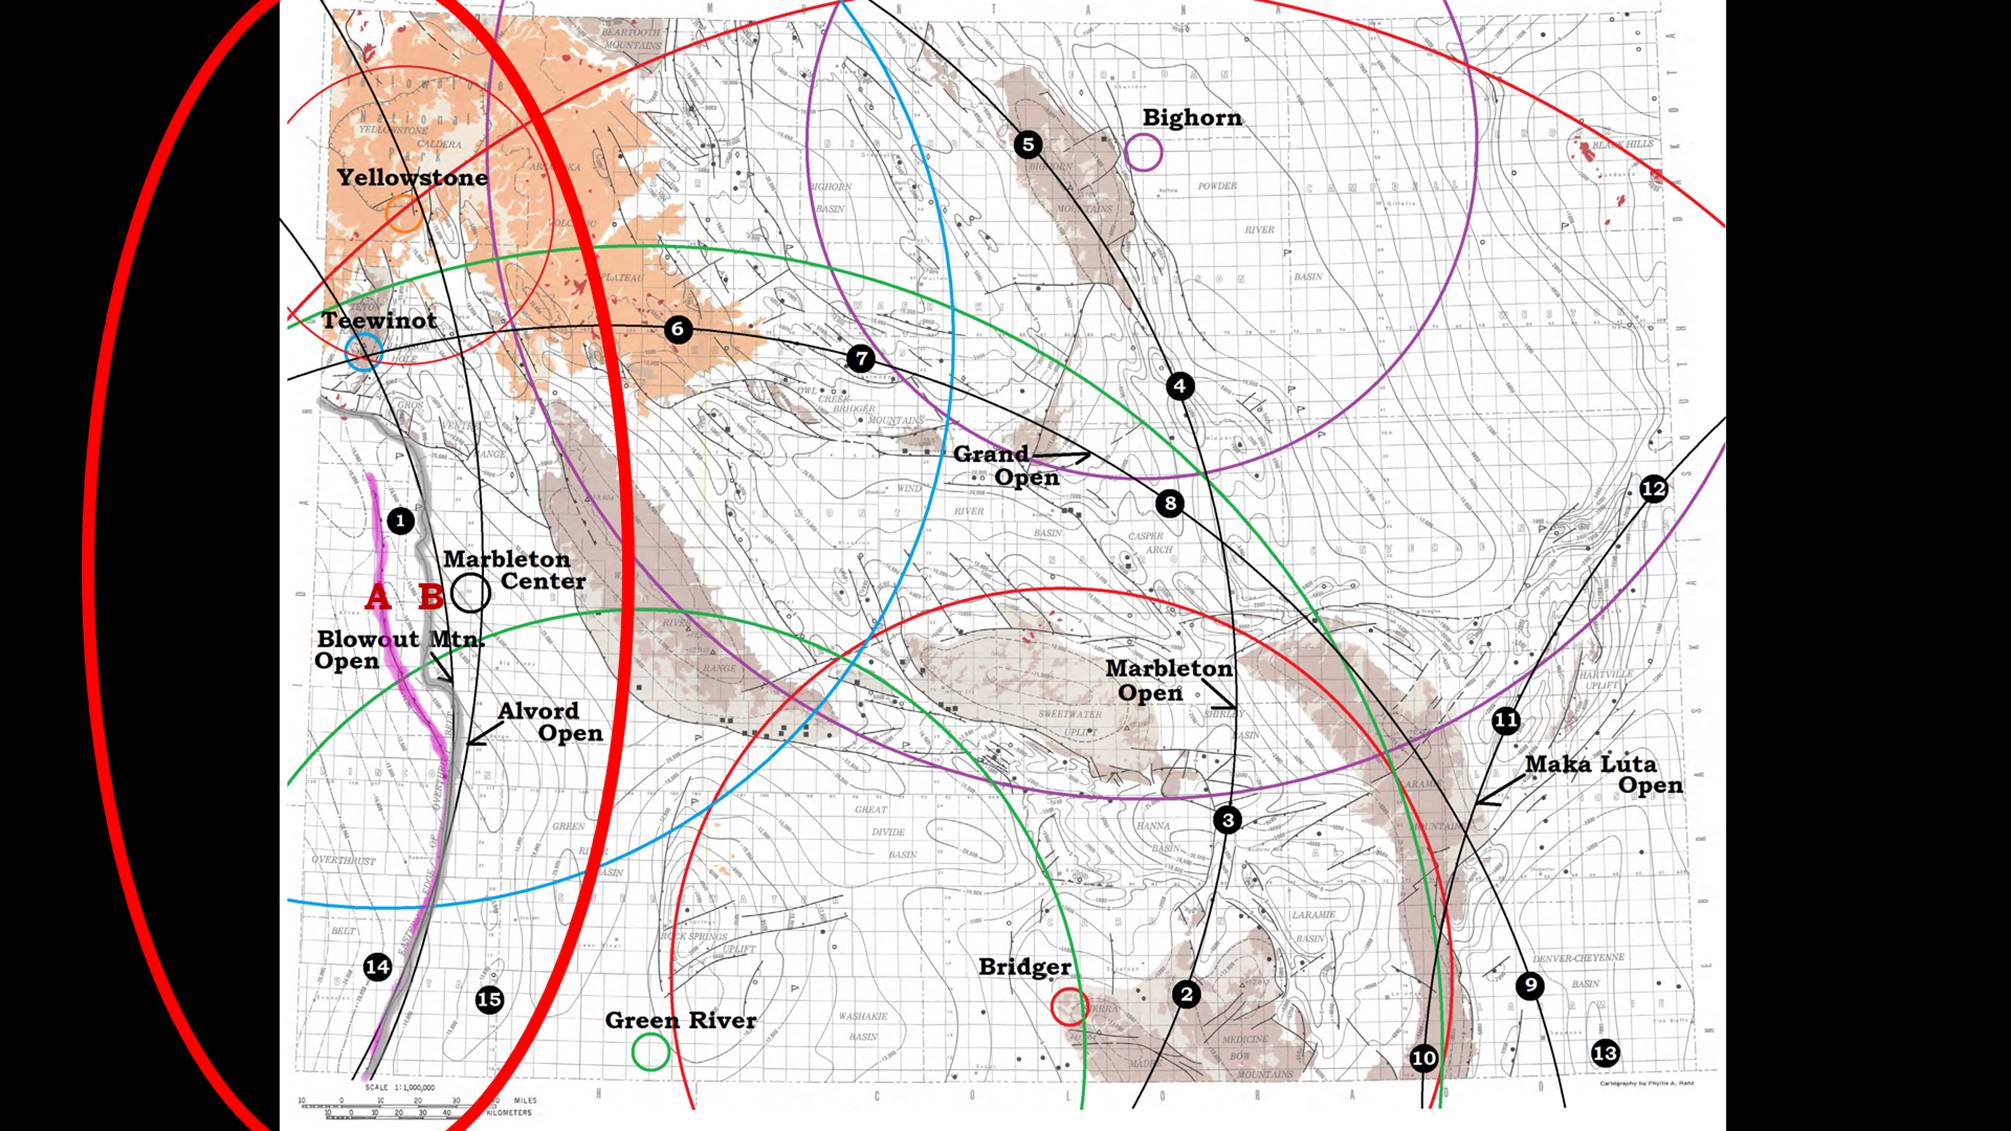 Figure 29: On the Pre Cambrian surface map of Wyoming the two thrust faults of the Sevier Orogeny (A and B) show near the southwest corner. The Open-rings of the Alvord and Blowout Mountain craters are shown in the red oval. The thrust zones have been displaced to the southwest by the later Bighorn crater and pushed south by the Teewinot crater. Many of the basement morphologic features are shown correlated with medium size craters generally associated with Cretaceous and later deposits.
 Figure 30: An active fault map of Utah confirms the location of the Sevier Thrust Zone in this area. It is noted that not many of the faults lie in the direction of the up-thrust or crater rims, but because later craters were adding to the energy signature of the up-thrust, the later craters were able to leave faults for their up-thrust. The small generalized section is taken at the black line. It shows a much generalized section through a few of the large craters showing how they contributed their sediments around the two uplift. The Alvord crater (Chuar Group of Grand Canyon) was very early, shortly after the Tatanka (Unkar Group of Grand Canyon which is prior to the Sevier Orogeny). The Maka Luta crater (Tonto Group: Tapeats Sandstone, Bright Angel Shale, and Mauve Limestone/Dolomite Rock of Grand Canyon) arrived after the Alvord but covered more of the continent, similar to the Tatanka’s dispersion. The Grand crater (Schnebly Hills Sandstone, Fort Apache Limestone, and Coconino Sandstone) is separated by the craters depositing the Redwall and Supai Formations from the Maka Luta crater, and is followed by the Blowout Mountain crater forming the more westerly edge of the Sevier Orogeny. The Uinta Mountains extends right across the Sevier thrust zone, because it was formed by a later crater which struck almost atop the thrust zones and pulled up the Uinta Mountains is an earth mascon. (Moon Mascons are mass concentrations of gravity in the center of many larger craters on the moon. They are all formed by CGRS from distant craters, see Chapters 10A and 16.)
 Figure 31: Where is the start of the Flood boundary in the Grand Canyon? That is not easy to find, but it is easy to define. The start of the Flood boundary is below the lowest cratering. If layer 3 is the Alvord crater, and it is mixed up with the evidence for the Blowout Mountain crater, 5; it is easy to see there is much to sort out. Actually, crater 6 is my diagraming of the Laramide Orogeny, like the Uinta or Bighorn Mountains. Mascons are short mountain ranges that are pulled up when the crater bottom rebounds. The difference in the Sevier and Laramide Orogeny is covered in Chapter 10B of my book. I will define the start of the Flood as below the crystalline basement.
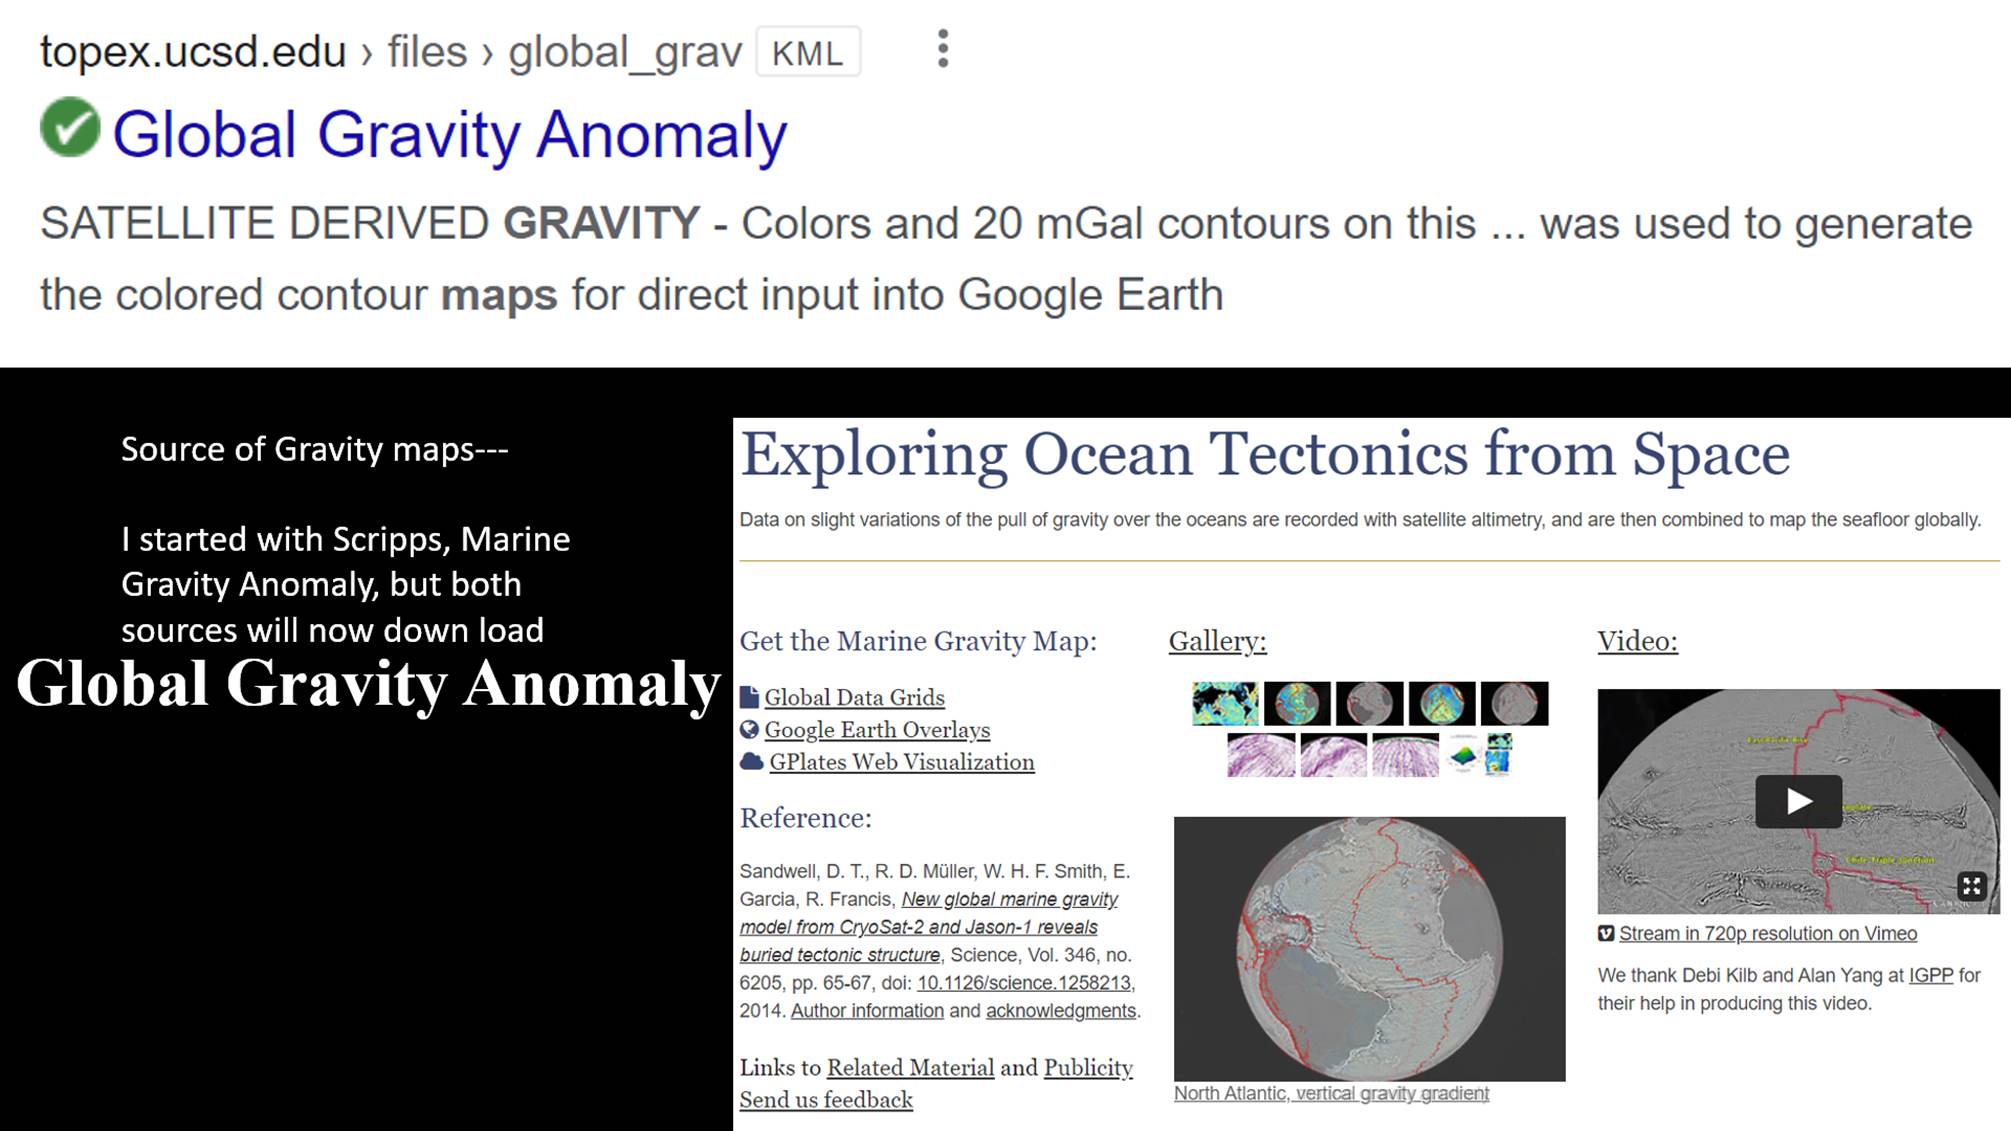 Have you now recognized the need for a good gravity overlay? There are two addresses for Global Gravity Anomaly. I used the download from UCSD. The reference in the Scripps site gives the background on how it was derived and a little about it. Scripps Institute of Oceanography is part of University of California at San Diego (UCSD) so you can down load the same KML file for Google Earth from either webpage. But, if you want to see the craters, you need to get it.