 There may be no other plot of ground so often used to illustrate many of the geologic processes espoused in textbooks than the Grand Canyon. Geologist talk about it like they have the processes all figured out. Is it just possible that they have gotten it all wrong? This presentation is going to suggest unimaginable cratering was responsible for everything we see there, from the rocks, the sequence, the faults, and the actual canyon. None of it got there by geological processes we can see happening around us today. We will question if some of the processes even work the way everyone has assumed they worked. Gentle reader, do not be afraid to questions the rocks, the processes, even my model, but above all, question the assumptions both you and I have made. Our God is a God of mystery, but He is also a God of Knowing. And in knowing, He is worthy of our praise.
 In the previous two parts I have covered a little of how I arrived at my model of crater formation, and the cratering events that shaped some of the strata exposed in the canyon. Now we want to understand the cratering events that led to the formation of the canyon.
 Figure 60: Redwall Cavern, a prominent landmark on the river trips is a great place to deal with the ubiquitous red color that coats much of the inner gorge. Many just say that it is Iron Oxide, but do not specify the type. Iron (Fe) has three oxidations states and forms three oxides: rust that requires water in its molecule, magnetite that is black, and hematite that is red. To form hematite requires removing three electrons from the Fe ion, which requires almost twice the energy of removing only 2 electrons (Chapter 12.). If it were rust it would keep forming and flaking off, like rust does on a piece of iron. It did not come from the Supai above that washed down as the rangers try to tell you, because it covered the ceiling of Redwall Cavern, and it could not have washed onto the ceiling all the way to the back of the cavern. Also, the hematite in the Supai Sandstone is trapped as crystals between the grains of silica sand. The black you can see on some of the far wall is not “dirt,” but chemist have identified it as oxides of magnesium, and tungsten, and it requires high temperatures to form also. All of these oxides require very high temperatures, ~1,000 degrees C (1,832 degrees F), to form. Note, the Cavern formed at the same time as the rest of the canyon and all of the other alcoves into the Redwall, which are also covered with hematite.
 Figure 61: It was Aristotle who recognized that streams move material, and Seneca recognized the power of streams to wear away valleys. Leonardo da Vinci believed that valleys were a result of their streams, but Unaweep and Grand Valleys of Colorado and the Grand Canyon are extreme examples of under-fit streams. The water flowing through them could never start to produce the vast amount of erosion that has taken place there. In the Grand Canyon it is made even worse. It is not one channel, but, a maze of side channels covering about 2,000 sq. miles (5,200 sq. km.). I have classified the Unaweep and Grand Valleys as Release Valleys (Chapter 1) from the Unaweep crater. Could the Grand Canyon have the same origin??
 Figure 62: Let’s start with one small but pronounced feature of the erosion, the Butte Fault. It is up to the east, telling us the shear center is to the west. The west side it thrusting up-and-over the east side. Comparing this in a diagram of the expected cratering faults, the only expected movement of earth in a cratering event would be thrust movement, reverse faults, outwards in all directions as a result of shock compression at the impact site. The formation of Normal Compensation faults would be expected as the compression drops down into the Release Valley at the adiabatic conversion site on the inside of the compression wave. Faults are not a matter of plate growth/extension or contraction/foreshortening. Horst and Graben systems and Transverse Faults do not exist (Chapter 19A). There are several things in geology that will have to be relearned, and faults are one of them.
 Figure 63: The Bright Angel-Phantom Creek-Eminence Break Fault is a second continuous linear that Huntoon and Sears first recognized in 1975. It is first seen at the Bright Angel trailhead, and forms the canyon to the river. From there the linear continues following the Phantom Creek canyon out over the North Rim where it corresponds with the Eminence Break on the north eastern edge of the rim. Do linears appear at random (Chapters 3-7)? Or, can their source of shear be traced back to the supposed direction of plate convergence?? Over vast reaches of the Pacific Northwest multiple authors have traced the Euler Pole for several sets of faults. They assume the Euler Pole is a pole of plate rotation, but I find their location of the pole corresponds with my location of cratering centers (Chapter 19). We are finding the same thing, and identifying it according to our different models.
 Figure 64: (A) One map of Butte Fault that may have been taken from an old map or estimated from the terrane. I highlighted their designation of Butte Fault as two linears using corresponding labels to Figure 66. (B) Linears I located in the area using topographic clues, CGRS in white and short concentric linears shown in red. Labels as in Figure 65.
 Figure 65: Craters found to correlate with linears around (A) Butte Fault and (B) Bright Angel-Phantom Creek-Eminence Break Fault. Butte Fault is up to east and Davidson, Molokai, and Salsipuedes craters all center in the Pacific Ocean. Red oval encircles a topographic high parallel to Ipojuca linear (Chapter 15A). The Ipojuca linear extends through Nankoweep Butte, Figure 62B. Ipojuca center is in the southern Atlantic Ocean. Huntoon and Sears identified the Bright Angel Fault as a normal fault (compensation fault) with west side up, meaning its center is to the southeast. I correlate it with the Gulf of Mexico crater. Additionally, they identify it as faulting between the deposition of the Unkar and Chuar Groups. This means that the Gulf of Mexico crater arrived between the Tatanka and Gorda craters. But in fact, the Gulf of Mexico is east of the Tatanka and would arrive first, but its CGRS may not have arrived here until after the Tatanka’s CGRS. This type of associations allow sequence and timing to be established for craters outside of the Grand Canyon.
 Figure 66: Top of the Crystalline Basement under the Grand Canyon and some of the earliest mapped faults (Precambrian). Butte Fault designated in blue as separate linears: (A) CGRS from Molokai crater, (B) CGRS from Salsipuedes crater, (C) CGRS again from Molokai crater, (D) CGRS again from Salsipuedes crater, and (E) CGRS from Ipojuca crater. Bright Angel-Phantom Creek-Eminence Break Fault designated in red. Two portions of the more southerly Mesa Butte Fault also appear to correspond with CGRS from the Gulf of Mexico crater. Faults are often made up of segments from different shear centers that have become associated in the mind of the geologist because they seem to form a continuous line on the ground. This reflects the observation in the Paradox Basin, made by Gay (2012) that faults and other structures exhibit “straight line segments with corners” where they meet other segments. They are largely not one continuous linear.
 Figure 67: What do the Sevier Orogeny and the Alvord crater have to do with what we can now see in the Grand Canyon? Remember the Gravity Map of the farside of the moon? The distinct bull’s-eye appearance of high and low, red and blue, gravity? If cratering did this to the moon, it also did this to the earth. In spite of all the later cratering, we can see that the Grand Canyon (red oval) lays in a broad blue band that extends well beyond the canyon. If it is dark blue, it was filled with a less dense version of the rock. As I have suggested the Alvord crater deposited the Chuar Formation, so that formation in this area is less dense than the alternative. If that formation is less dense, it will be preferentially eroded by the adiabatic conversion forming release valleys in subsequent cratering. What are some of these larger subsequent craters, and what did they each contribute???
 Figure 68: When evaluating what each crater contributed, we have to recognize how the dark blue rings conform to the white rings of that crater. I have already emphasized how the Alvord and Blowout Mountain have a similar foot print and how they both contributed to the Sevier Orogeny. In the Grand Canyon area, the Blowout Mountain produced a couple of additional small up-thrust. I suggest that these up-thrust were smaller because they were working against the low gravity left in the area by the Alvord. The blue ring of the Winnemucca crater extends well beyond both ends of the Grand Canyon’s area. Again the dark blue seems to hug the white rings, strongly indicating that it is a low gravity ring of the Winnemucca crater. The white ring just beyond the canyon did thrust up some mountain ridges, so it would be a compression wave, and the canyon just behind it would be part of the associated release valley. The general line of the canyon appears to mimic the curve of the Winnemucca’s rings.
 Figure 69: The Chilili and Gandy craters have one very important aspect in common, both of them include the Grand Canyon within their original crater rim. We saw on the moon’s highlands, the continent of the moon, all of the craters, except the mascons in the largest, have blue centers. The fallback into the crater leaves a less dense lithology. On the Chilili crater the third ring displaced the mountain ridge down Baja California. A larger view would show that slight arc certainly originally aligned with California’s Sierra Nevada, further to the east. The original crater ring on the Gandy crater is outside the edges of the image.
 Figure 70: While the Grand crater included the Grand Canyon within its original crater rings, both the Grand and Navajo craters also contributed to the release valley the Colorado River flows through in the Canyon. With the Grand crater the white arrows point to sections of the river channel that follows the rings. The Yellow arrows indicate other locations that it contributed to the gravity pattern, but the river does not follow it. The river channel southwest of both Kaibab Plateau (K) and Shivwits Plateau (S) are release valleys from Grand crater, while the raised plateaus themselves were produced by the Navajo crater. The inner ring of the Navajo crater is especially easy to see (red arrow) as it is a ridge of high gravity making almost a half-circle. Walhalla Plateau on the southeast pointed end of Kaibab Plateau. It is a nearly isolated plateau surrounded by steep slopes to the Colorado River. I propose it remained a plateau because it was harder, denser because of the added energy put into it by the Navajo crater. Its added density may not reflect different mineral content, but only denser, more tightly packed particle matrix.
 Figure 71: The Alaskan crater produced a CGRS just southeast of the white arc that highlights the release-wave response on its backside, The CGRS is accentuated by a second arced linear to the northwest. The red line indicates the shock/compression ridge and the dark blue linear behind it was produced by the following release/expansion wave. The Aguj de Anahuac crater being a smaller crater than the Alaskan, I assume arrived a couple days later. It left a CGRS in a very similar location, but I think the exact location of its release valley better corresponds to the low gravity area connecting the Kaibab and Shivwits Plateaus. A careful examination will show the low gravity linear that makes this central portion of the canyon also had an expression on both the Kaibab and Shivwits Plateaus forming small valleys in its paths across them. This expression on the plateaus is not a feature of the Alaskan craters linear. The Alaskan CGRS probably arrived earlier about the time of the Chuar or Tapeats, while Aguj de Anahuac arrived about the time of the Redwall or Kaibab and left a release valley much higher in the strata.
 Figure 72: Now that we have accounted for some of the sedimentary layers from cratering, how did the canyon form? Could it also be cratering? Some readers will object, but I place the entire canyon as a Release-Valley Canyon formed with the help of the Flagstaff crater. The Flagstaff crater shows up as the blue ring inside the first white ring on gravity. In the Grand Canyon vicinity, the blue ring is diverted to the Canyon which is a dark blue, very low gravity path. That there is little indication of the Flagstaff crater at this resolution on Landsat is not surprising.
 Figure 73: Do you see the similarities between the dark blue path of the Grand Canyon and this wiggly canyon I showed you previously in Mare Orientale? The low gravity paths were already formed by the individual adiabatic responses of all of these craters and probably even more. The Flagstaff crater, because of its size I would place late in the 40 days of cratering, maybe between days 35-38. The adiabatic conversion from the Flagstaff crater would have blown much of the sediments out in one puff, and the fast moving water flowing all the way through it would have quickly washed any remaining loose sediments towards the California coast. Some of them may have dropped out of suspension, but I would not look for a “California River” as some papers have proposed. This flow coastward, would have taken place continuously for several days at this time, and would have been rapid but not highly erosive. Note: many of these lines account for the direction of faults within the canyon, and would make an interesting study.
 Figure 74: Let us look again at the Flagstaff crater’s rim in topography. The edges of the “crop circle” (“Gulf of Mexico to Turner Gulch” slide show) are marked with the inside end of the yellow lines. I do not believe the “crop circle” would have been recognized if the Flagstaff crater had not been identified first, but it is real. How many other obvious indications of craters occur but are ignored because we are using a different model? One you have seen some of it, it becomes obvious.
 James was writing about the need to practice what we know in our spiritual lives, but it is not an absurd stretch to apply it to everything we know. Is knowing enough? The picture is a poor pun and a tired joke, but you now have new information. Think, what are you going to do with it? Discard it because it can’t possibly be true? Investigate it more? Ignore it because you don’t want it to be true?
 Figure 75: Can you apply what you have learned to this figure and locate comparable topographic clues in this region for these CGRS. I see clues for each, and clues for many, many more.
 Figure 76: One other form of erosion which played a major role in the canyon we see today was small erosion craters that continued throughout the Flood year and into the Post-Flood period. This probably involved secondary impactors which were chunks of lithology that was shot into orbit by the first LARGE impactors. Secondary impactors may have continued till Sodom and Gomorrah. Horseshoe Mesa is a famous landmark with its horseshoe shape and two arms. Can you see the many fracture linears with dark plant growth. How many of them are indicated in the earlier image for cratering fracturing and the Flagstaff crater? At the end of its west arm . . . . . . .
 Figure 77: Is a series of circular lineaments in the plateau’s surface. Only the middle of the circles are on the Plateau surface, but I see them very clearly on Google Earth, and they are equally visible on the ground surface. It would be an interesting study to compare limestone in the circles and that more distant. In the second yellow ring, where the purple arrow points on the “thumb” peninsula some very curious minerals are exposed.
 Figure 78: This is the trail out onto the thumb. Around the small tree, along the path and in the distant wall barite is visible. If you ever get down there, the barite is easy to identify. It is white, like cloudy quartz, but four times the density. It feels very heavy. The geologist tell us, barite replaced the quartz chert in these locations. How does chert/quartz melt out of the limestone and make a void barite can fill? It is only about a 6 foot wide band of barite with the quartz chert still present on either side. I suspect either the compression wave or release wave vaporized the quartz in this ring and mobilized the Barite. It would be a great project for some chemistry major’s thesis.
 Figure 79: This obvious crater is not so obvious from the ground. It is referred to as Phantom Creek Valley, and I believe I have camped in an overhang on the south wall of the crater. I wish I had known about its total shape when I was there. I spent a day climbed all over it. This would be a great location to see specific characteristic of secondary craters. Note the red near the center of the crater. I will assume it is cutting down to the liver red Hakatai Shale. The Hakatai shale is a far reaching red formation, like the Supai and Moenkopi formations. They are red from distinct red crystals of hematite scattered among the white sand and gray shale particles. Distinct hematite crystals require ~1,000 degrees C (1,832 degrees F) to form in the air. They cannot grow between the sand grains. That is why I propose a vapor condensate to form the sediments in the air, not erosional degradation.
 Figure 80: Looking at the area surrounding that circle in Phantom Creek, I see it as only one of many circles. Should I be misunderstood, I am saying much/most of the topography is shaped into circles produced by secondary impacts that makeup the majority of erosional craters. They continued landing after the 40 days, until the days of Sodom and Gomorrah. This would produce the soil for the earth, but could also produce major post Flood catastrophes.
 Figure 81: One more look at Hematite. This is the south edge of the Tonto Platform with Cheops Pyramid and Utah Flats in the background. Something turned the normally white Tapeats Sandstone alternating layers of red and white, in a circular shape. Is it the small center of a secondary erosional crater? I believe so.
 Figure 82: Many of the side canyons to the Colorado River are still banked with large deposits of “river rounded” cobbles. I would suggest from the image that many are rounded not from tumbling but ablation and show good indication of a heat rind from going through and being spit-out from the adiabatic conversion. I would suggest this happened in the formation of a release valley. The release valley we now call the Grand Canyon.
 Figure 83: In a rare glimpse inside a heavenly court room where “gods” set in condemnation before God as He recites their failing, Psalm 82 says, because of their actions “all the foundations of the earth are shaken.” Not covered with water, or filled with fire and smoke, although we have seen that is true in other places, but the very foundations of the earth/ continental shelves are shaken. If we are not going to believe this is pure hyperbole or metaphor, it would take quite a large force. That force would be consistent with impacts of the size I am suggesting. Psalms 29 qualifies as a scene out of such a courtroom: The Psalm is not addressed to the Lord, but about the Lord. It is addressed to the “heavenly beings”/ mighty-son. Assuming, Jehovah includes the portion of the Godhead called the “Son/ Jesus,” we must assume an angel (“sons of God”) is being addressed. Because he is mentioned as a “mighty” son, I will suggest a specific angel, Lucifer, because he is commander of other angels. He is being instructed to give Jehovah glory and strength, which Lucifer refused to do when he said, “I will be like the most High (Isaiah 14:14).” Preferring KJV in verse 7, the voice of Jehovah “divideth the flames of fire.” “Flame” not only denotes the burning, but also refers to the “head’ of a spear, the piercing part. Blazing spears are acting upon, piercing, the many waters, and we can reason from their still burning that the waters did not quench them. “Divide” is the same word for the priest dividing the sacrifice, each portion for its specific use. Not that we want to appeal unnecessarily to a miracle, but the “flames of fire” did not land where they wanted, but where the voice of the Lord directed them “over many waters.” Jehovah makes the whole Earth shake and skip, pierced with flames of fire. That is the Flood as Noah and David knew it.
 Figure 84: But, do I presently have an answer for all of the geologic question? No, but I have enough that I think my model is on the right track. The more details I find, the more answers I can supply. Our Lord’s handiwork always shows in the details. “When I consider the heavens, the work of thy finger, the moon and the stars that thou hast ordained . . . . What is man that thou are mindful of him, and the son of man that thou visited him . . . .?”
 Once again in the words of David, Psalm 29: “The voice of the Lord is over the waters; the God of Glory thunders, over many waters. The voice of the Lord is powerful; the voice of the Lord is full of majesty. The voice of the Lord breaks the cedars; the Lord breaks the cedars of Lebanon. He makes Lebanon to skip like a calf, and Sirion like a young wild ox. The voice of the lord divides the flaming arrows. The voice of the Lord shakes the wilderness; the Lord shakes the wilderness of Kadesh, The voice of the Lord puts the deer into the pain of birth when its not its time, and devastates the forest, so that in Hs temple all cry, “Glory”. The purpose of the Flood, in my opinion, was to destroy the work of angels with man in the Nephilim Affair, and form a world in which man could once again say, “Glory to God.” Glory to God!
Walter Barnhart
Sevier and Grand Canyon, Pt 2
 There may be no other plot of ground so often used to illustrate many of the geologic processes espoused in textbooks than the Grand Canyon. Geologist talk about it like they have the processes all figured out. Is it just possible that they have gotten it all wrong? This presentation is going to suggest unimaginable cratering was responsible for everything we see there, from the rocks, the sequence, the faults, and the actual canyon. None of it got there by geological processes we can see happening around us today. We will question if some of the processes even work the way everyone has assumed they would. Gentle reader, do not be afraid to questions the rocks, the processes, even my model, but above all, question the assumptions both you and I have made. Our God is a God of mystery, but He is also a God of Knowledge. And in knowing, He is worthy of our praise. The first part covered how we interpret Earth craters in light of what we know of moon craters, and understanding the evidence of the energy signature left in the gravity patterns. It looked at some of the largest craters found in North America, forming the crystalline basement of the continent.
 We have covered the cratering below the Great Unconformity the Crystalline Basement in Part 1. Here we want to continue on an exploration trip. Please leave your geologic preconception at the door, and we can go on a trip to discover some new ones. This session will address evidence of astral-cratering covers the entire globe 40 layers deep, We will relate cratering as the cause of the Vishnu Schist, Zoroaster Granite, Unkar Group, the Chuar Group, the 60 Mile and Tapeats Formations, the Redwall, the Surprise Canyon Valleys, and the Coconino Sandstone as well as others. Cratering was responsible for all aspects of the Grand Canyon from the strata to excavating the canyon itself.
 Figure 32: The Foxe crater, covered in Part 1, in far northern Canada, is the largest crater in North America (that I can find), what is the biggest crater in the continental United States? That distinction goes to the Tatanka crater, whose impactor nearly landed in Canada.
 Figure 33: The Tatanka crater has the Williston Basin at its center. Scanning the gravity map, the Tatanka crater is partially responsible for the red ridge near its 4-ring (between white arrows), the western branch of the Mid Continental Rift, and the 8-9-ring near the east coast (between red arrows) formed the curved ridge of the Appalachian Mountains, as a mascon of the Bermuda crater.
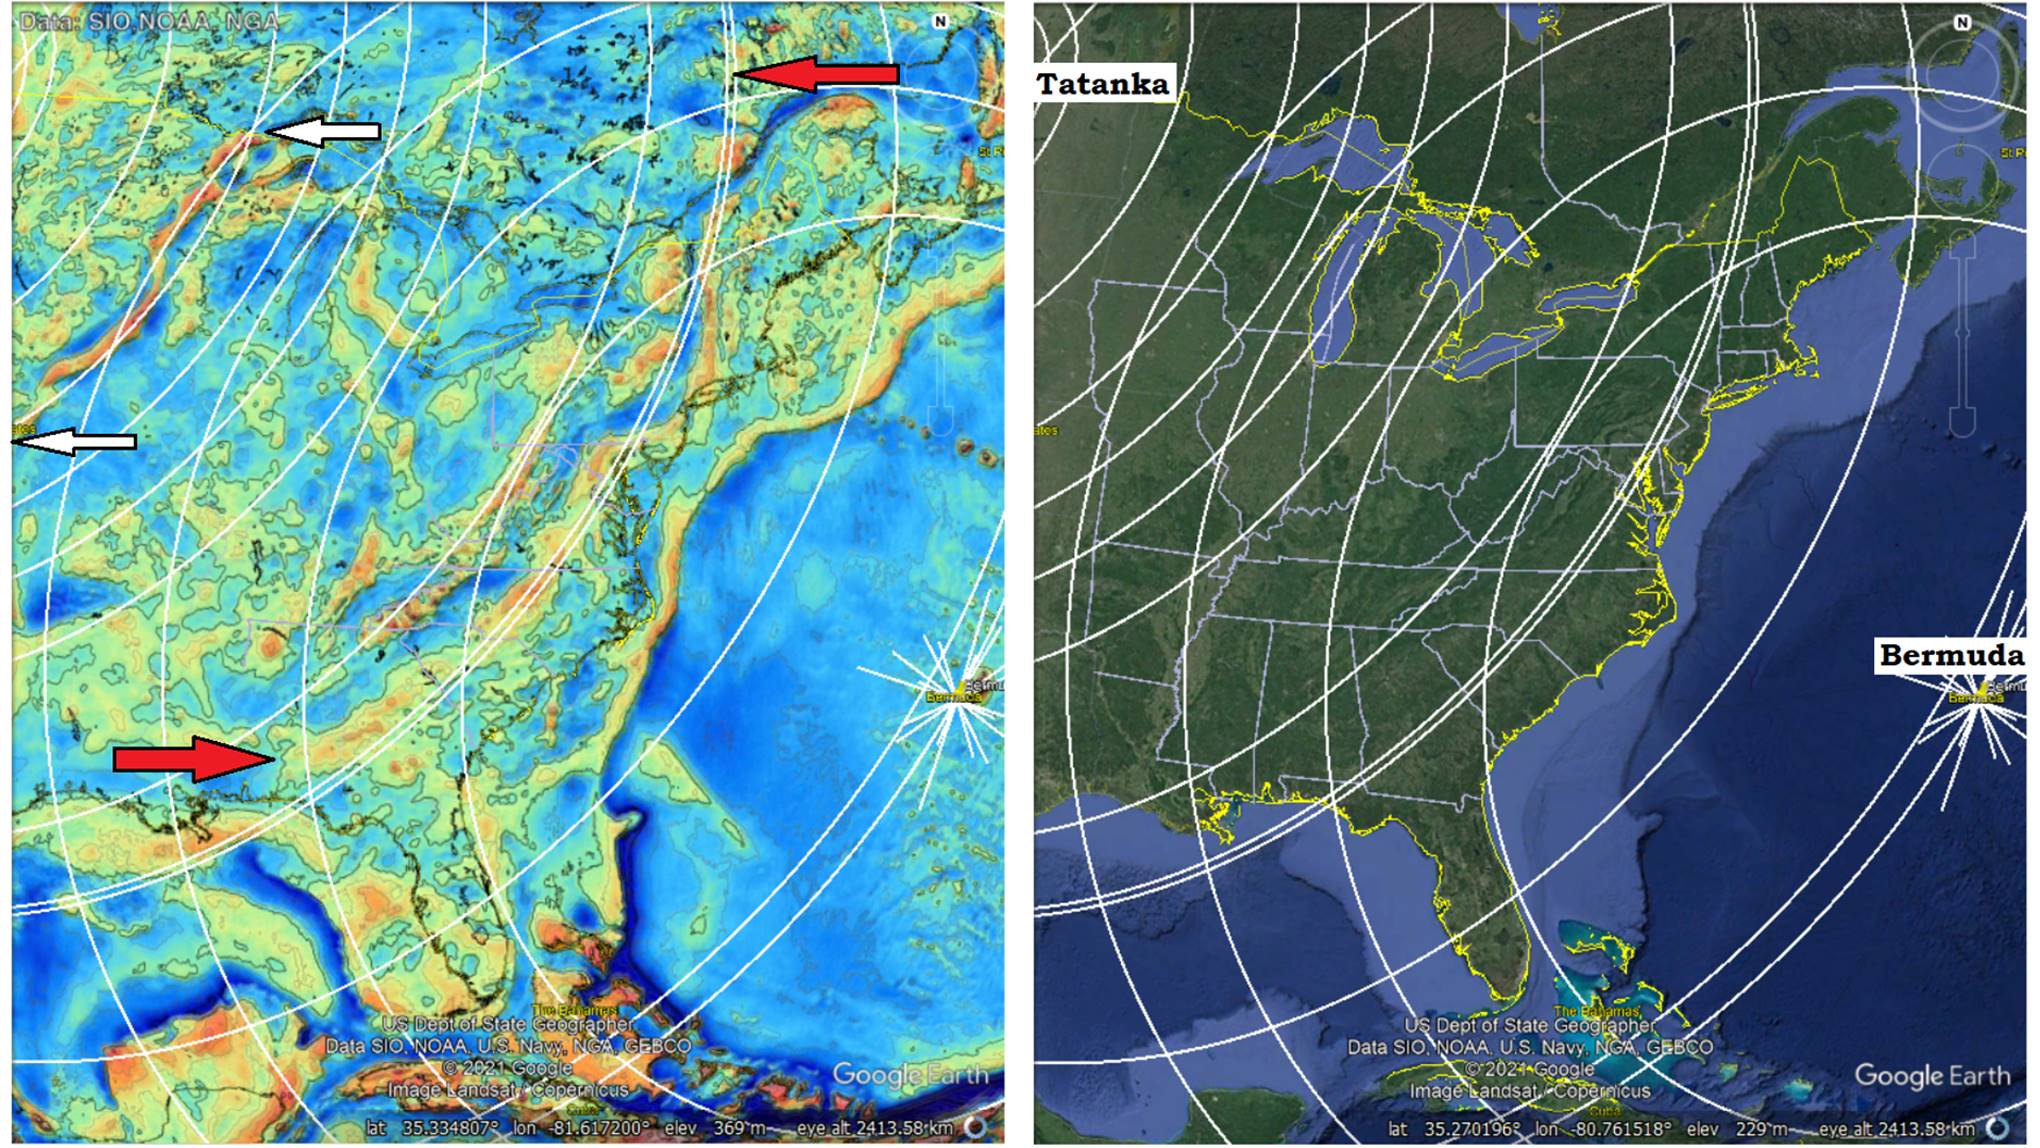 Figure 34: One way to identify and confirm craters is to recognize how they interact with other craters. The white arrows are still the ends of the west limb of the Mid Continental Rift, and the red arrows are still the ends of the Appalachian ridge. I will propose the Bermuda crater arrived first because it is further to the east, with the Tatanka crater arriving later that same day as the earth rotated under the asteroid shower. The impacts together put extra energy into the area of the Mid Continental Rift where their rings overlap. This increased energy was raised as a mascon by the MCR crater a few days later. In the Appalachians, the arc of the ridge was pushed up in the heated lithosphere from the Bermuda crater. Since the red arrows both occur just outside the second ring, I will identify that as the Open-ring and make that a mascon of the Bermuda crater. The interactions of the two crater’s rims provides conformation for both of them to me, and provides conformation of the model.
 Figure 35: The Tatanka crater also has several linears to recognize it, both high and low gravity. The red-ring with the red arrow was the first I thought I saw. Do you ever feel like there is someone staring at you? Some would say this is an unfounded feeling, but other times, with careful examination we can recognize clues that we may not even have previously been aware of. People turned our way. People staring at us. All of these are clues others are listening. Scanning this image may give you a feeling that there are other circular rings concentric to the white rings.
 Figure 36: Many will say, with a crater this large, I could not possible really be seeing rings in the gravity pattern. I will say, they are not continuous rings, but they are significant repeated portions of rings. Enough to say, there is something there, and it needs more investigating.
 Figure 37: South of the Tatanka crater, centered in Nebraska is the Maka Luta crater. “Maka Luta” comes from the Lakota words for “red earth.” A Landsat image of the crater provides very little evidence other than its inside ring fits a curve in the Front Range of Colorado (Red oval).
 Figure 38: At the center of the Maka Luta crater is the Denver-Julesburg Basin, and at its outer edge is the edge of the continental shelves. Some creation authors have tried to make the Continental Shelves a product of the sediments running off of the continents as the land supposedly rose. This cannot be true if the Continental Shelves are part of the continents, and seismic sections consistently show them to be such, no matter where we look. On the east coast the high gravity ridge of the Continental Shelf is an up thrust of the Maka Luta, and while this map does not show the west coast to be similarly designed, the topographic sections do (see Pacific Northwest slideshow). In the Gulf of Mexico, the ring also limited the continent, but that limit was shortly modified by the Sigsbee Escarpment which pushed-up through the sediments from the MCR (Mid Continental Rift) crater. The Maka Luta crater determined the foundations of the continent.
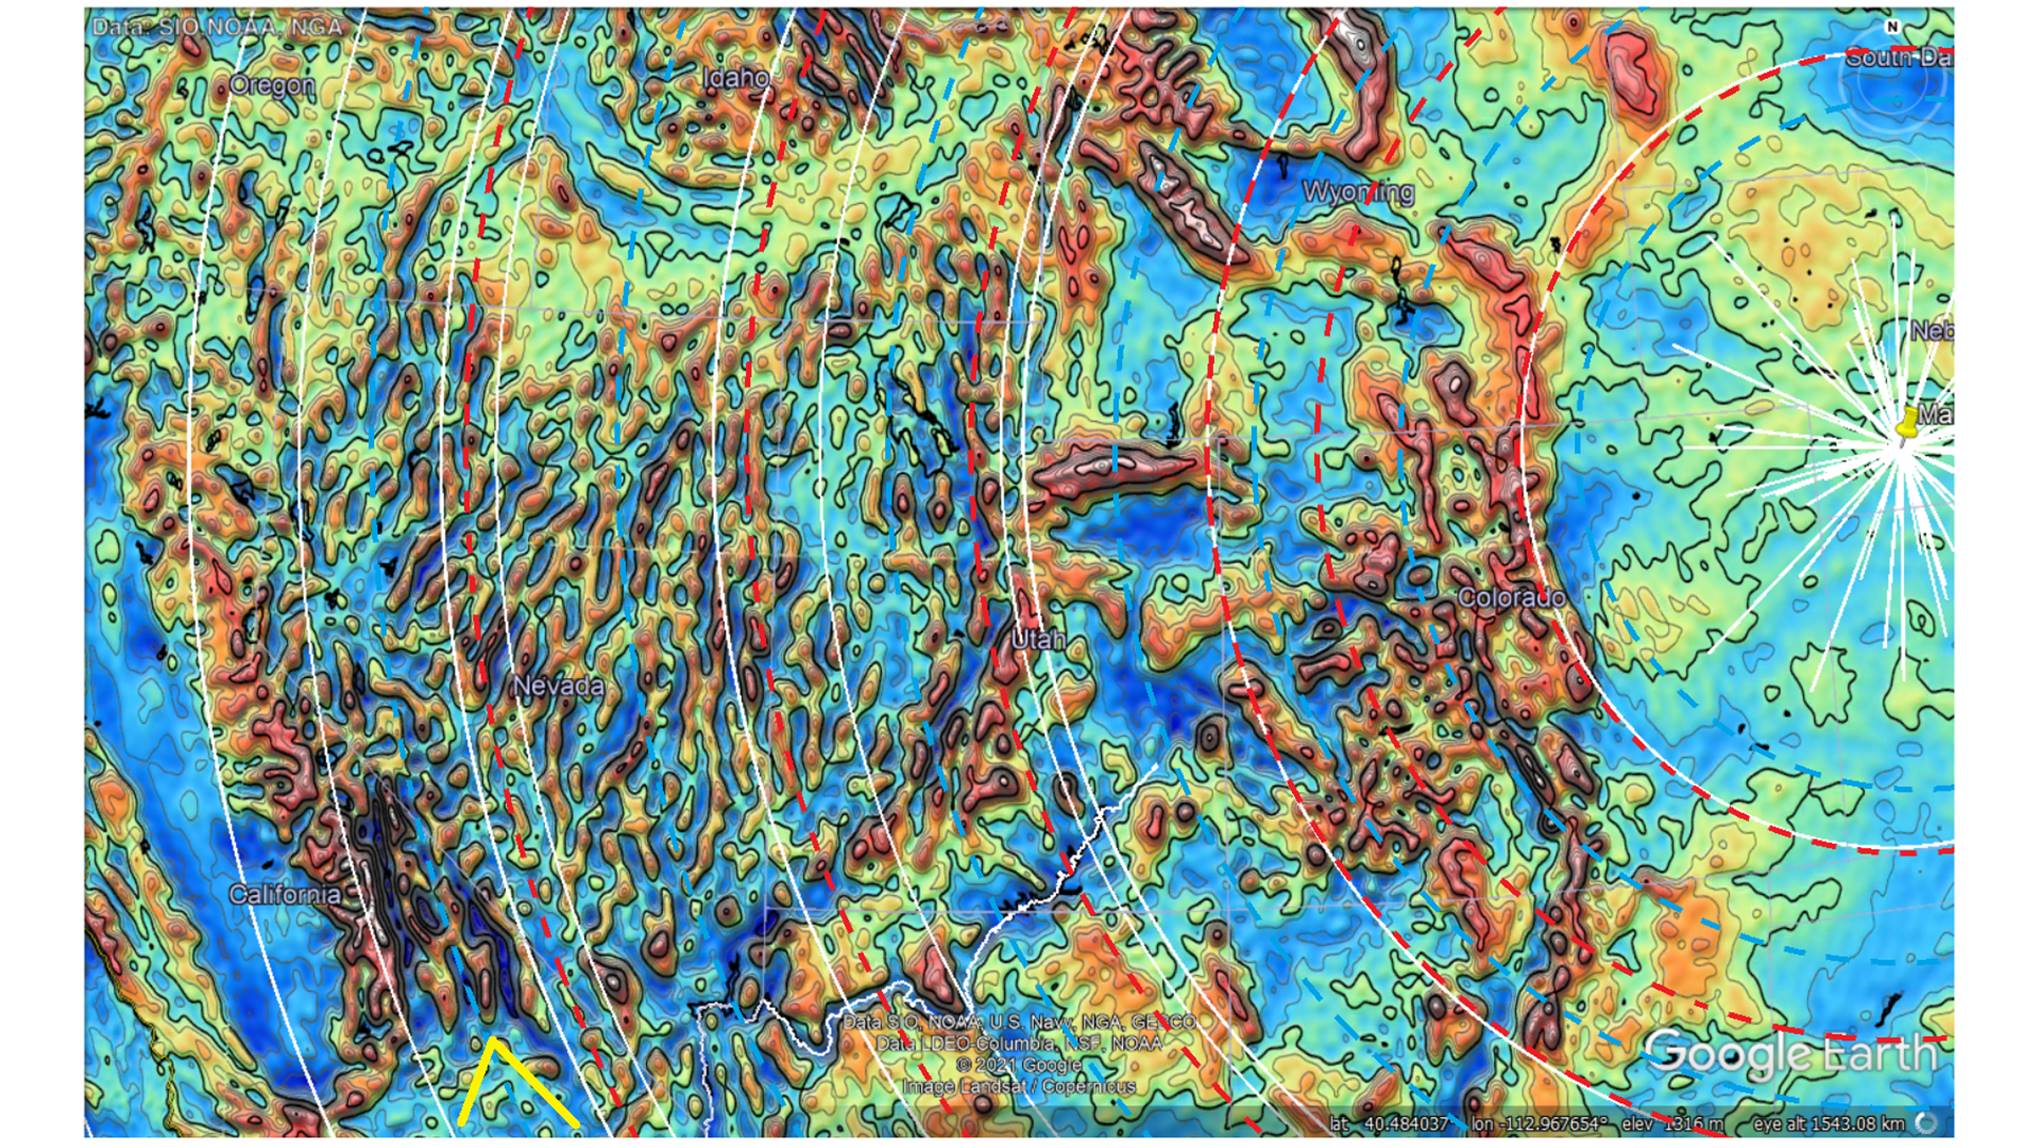 Figure 39: Looking at the Maka Luta crater’s pattern as it crosses the Rocky Mountains, it also produced a gravity pattern of ripples. When finding the cratering connection to the Sierra Nevada Mountains of California, it quickly becomes evident something cut them off on their south end (yellow arrow). Part of that something was the wide dark-blue ring which includes Owens Valley and Death Valley, both very significant to geologist in California. While both had their ultimate shape determined by other, later craters. The first low gravity print was made by the Maka Luta crater, which included them in a release valley. Looking north from that area, a number of dark-blue areas are concentric to the Maka Luta’s expression all across the Basin and Range and Rocky Mountains.
 Figure 40: In Part 1 we discussed the Alvord crater that anchored the southern end of the Sevier Orogeny, and here we have identified the Tatanka and Maka Luta. In the southwest. Around the Grand Canyon, all three of these three craters overlap and produce some distinctive layers and interactions. In his Master thesis, Lathrop (2018) found the Bass Limestone’s Hotauta Conglomerate to correlate from Death Valley, California to the Franklin Mountains of West Texas, and the mud cracks correlated to the “molar-toothed” structures in the Belt-Purcell Supergroup of British Columbia and Alberta, Canada and Eastern Washington, Idaho, and Montana, U.S.A. except for the missing microsparry calcite infill or replacement. I propose that difference could be a result of higher temperature in the cratering process reflecting its shorter distance from the impact event. For these six distant disconnected deposits of Bass Limestone, Lathrop found a similar set of reverse faults hosted by each of the deposits that was concentric to the Alvord crater. By contrast to the diverse locations of the Bass/Unkar Group, the Chuar Group on top of it is only found in the Grand Canyon, to the north in the Chuar Field (6) where it is explored for petroleum, and the Uinta Mountains (7) of Utah. I propose the Bass Limestone was laid down by the Tatanka crater and then broken up over its range by the Alvord crater that followed. See Chapter 14 of my book for more thorough coverage of the Tatanka and Alvord cratering correlations.
 Figure 41: Molar-toothed structures on the left from the Belt-Purcell Supergroup and evaporation cracks from the Bass Limestone’s Hotauta Conglomerate on the right. (D) is topside and (C) is underside. The irregular division and even fine lines are the same except for the microsparry infilling of the cracks. As microsparry calcite would have been produced at a specific temperature from the solution that the quartz sand grains were depositing in. This looks like a chemical difference governed by the temperature. This also suggest, both were deposited at an extremely elevated temperature, but in the Belt-Purcell it was somewhat higher temperature or prolonged elevated temperature than in the Hotauta Conglomerate.
 Figure 42: A cratering model for the Grand Canyon’s Pre Cambrian runs right up against Stromatolites, in the Hotauta Member of the Bass Formation, and in the Kwagunt formation of the Chuar Group. Are they fossils or are they chemistry? Partly because a cratering model would require them to be chemical, I will declare them to be. Also, I think that must be the default position, until identified fossil evidence is found to confirm a biogenic source. But, as same Creationist authors have publish their belief in a biogenic origin, I will say, I am not convinced. The lower right image does not look biogenic in origin to me. When I realize the containing strata was laid down very hot and a lot of chemical reactions were taking place as the very hot sediments were being put into place. These are conditions that have not been previously considered. I would propose to interpret them as the result of a chemical reaction that produced gases that lifted layers as it moved upwards in various forms including the inverted cone formation.
 Figure 43: Other mound and cone shaped “stromatolites” have been located by Lathrop in Vishnu Canyon and Bright Angel Creek West. Although these forms are less spectacular, I believe they confirm a non-biogenic origin for the structures. No one has previously considered the chemistry that is going on between rapid high temperature depositions of these strata atop each other within mere hours.
 Figure 44: Atop the Unkar and Chuar Formations is the 60 Mile Formation. I think there is a lot of merit to Wise and Snelling (2005) suggestion that the 60 Mile formation is the start of the Tapeats. At this distance from the cratering center, the first result would be a thrust of the geography, with the resultant deposits of LARGE breccia. The sand that will eventually form the Tapeats would start early as a quartz and feldspar condensate from the vapor cloud. These lulls would be brief between episodes of thrusting, and the first sand lenses are small insertions. By the time that the Tapeats Sandstone proper is depositing, returning tsunamis from the thrusting have washed life forms back over the OCR and the platform has become stable. The thrust that the 60 Mile formation represents was not a start of the Flood, but the start of a single cratering event, not first but at least 5th in this region. In my two paper on the Tapeats, I was amazed that the strata was laid like in a river, and I compared that river for just the immediate area of the Grand Canyon would be a river 300 km (186 miles wide), Such rivers do not exist, and the Tapeats is not laid as on a beach. Hyperconcentrated flow was constantly depositing sand from a never ending source. To get that kind of deposition in a flume, you must keep adding sand to the recirculating water. Cratering supplies a continually renewing source of sediment, not from continuing erosion, but from continually condensing quartz from a very hot vapor cloud of vaporized rock that is slowly cooling. Cratering would produce the original thrust outwards carrying with it anything that can move. Water will rush back in to fill the void, filling it with hot condensing sediments and as they continues to fall, rush back outwards. Never getting very deep, 0.5 – 2 m (1.5-6 feet) in depth. This is the story of laying the thin layers of the Tapeats.
 Figure 45: If the Tatanka crater formed the Unkar Group, and the Alvord crater formed the Chuar Group, the next sedimentary layer is the Tapeats Sandstone. Clarey (2017) compiled the Sauk Group, and his map is redrawn in B. It maps the Tapeats Sandstone and equivalent sandstone all over the continent that fits the Maka Luta and Foxe craters. Additionally, it has an arch across the central states that Clarey identifies as “dinosaur peninsula.” I propose that arch was an up-thrust of the earlier Keys crater. In the far north the pattern of sandstone was altered by the Greater Beaufort crater that also produced the Franklin Large Igneous Province just south of the depositing sandstone.
 Figure 46: That these tsunamis might contain live vertebrates seems unlikely, but at Plateau Point just out from Indian Gardens just off the Bright Angel Trail we have evidence of exactly this. In my article from the Summer 2014 CRSQ, Anomalous Impressions in Tapeats Sandstone (Cambrian), Grand Canyon, the editors would not let me refer to them as footprints, but I showed that they had all of the characteristics of footprints and occurred in trackways, so I think I can defend them as footprints.
 Figure 47: See the article for much better images. At the top is a documentary set of photos of most of the site. The entire ledge is shown with a total of 32 whole or partial impressions, produced in 6 trackways of similar prints. A horse, 2 large cats, a 3-toed theropod, a web footed bird, and one small mammal. At least the Theropod, horse and large cats were running on a water saturated, thixotropic surface. If water was moving over the surface when the prints were made, it would have to be less than 12-14 cm deep. The left image shows trackway A and the right image is one of the individual prints, possibly a large cat (#2).
 Figure 48: There are no dinosaur eggs found in the Grand Canyon, but this is as good a time to talk about the conditions where dinosaur eggs are found in the Dinosaur Peninsula. In my September 2004 article in CRSQ on dinosaur eggs and nest, I emphasized how dinosaur eggs are often found in thinly layered sediments which give the impression that the sediments were depositing while the eggs were being laid. Some clutches of eggs were even laid into sand partially suspended in the saturating water. If dinosaurs were laying their eggs into water they were highly stress, desperate to survive. It is a reasonable assumption that dinosaur eggs, like bird or reptile eggs, must be incubated on dry land or embryo will drown. Both chicken and marine turtle’s eggs will drown in a few minutes of being submerged, about the same amount of time that you will last submerged. No reptiles lay their eggs in the water. So why would dinosaur do so? Obviously, they needed to get rid of the eggs for their own attempted survival. Eggs and foot prints are evidence of aerial exposure of shallow actively depositing sediments. Model shown at right is typical of those produced in museums. Baby dinosaurs are made the size of embryos found in the egg, and are only half as large as hatchling for the egg size. Many Dinosaurs were probably ovoviviparous, bearing live young, and eggs represent aborted gestation due to stress and survival instinct (Psalms 29: 9).
 Figure 49: The Grand crater centers in Eastern Utah, just happens to exactly match the depositional area of the Coconino Sandstone and related Schnebly Hills Sandstone just under it, and equivalent sandstones from Texas to Montana. The yellow oval is the location of the Fort Apache Limestone. We will come back to the limestone.
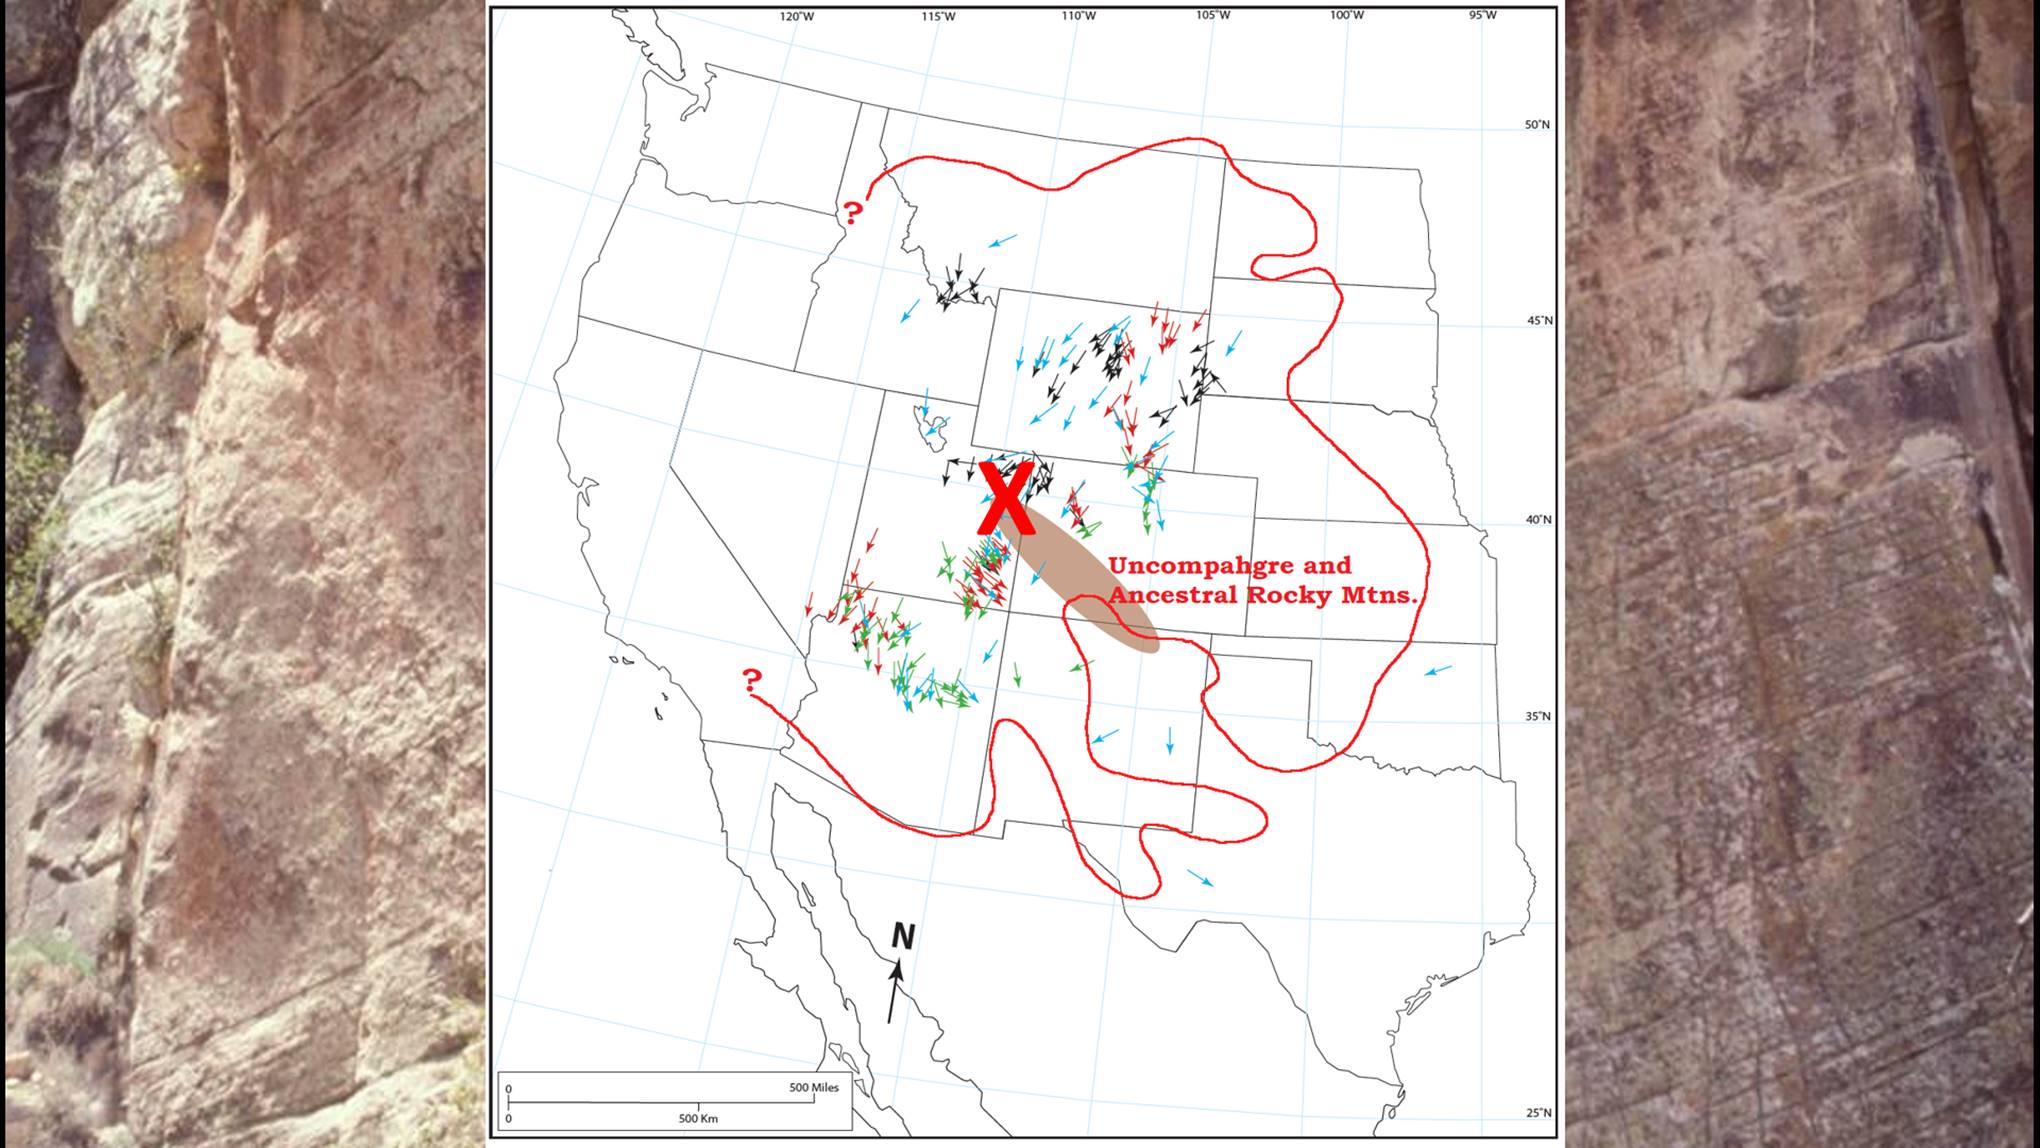 Figure 50: First, we want to see the depositional pattern of the Coconino and Schnebly Hills sandstones. Dr. John Whitmore is the expert, not I. His map, above, traces the depositional flow patterns found in these formations. This flow pattern would support movement primarily in the Coriolis direction or possibly another large crater in the Great Lakes region. This suggest continuing deposition significant hours after the cratering event. Geologist generally recognize the Uncompahgre and the Ancestral Rocky Mountains as the source for the sand grains, but I would propose an alternative. They originated as condensates under a vapor cloud from the Grand crater.
 Figure 51: Fort Apache Limestone occurs between two layers of the Schnebly Formation in the area of Sedona, and makes only a spotty appearance at the Mogollon rim, but grows thicker as it approaches the New Mexico border. The far right image raises another question as it shows the sedimentary strata in the Sedona area. Devils Kitchen is a sinkhole that Lindberg connects to the Redwall strata below. Sources from the Hualapai Indian Reservation area cite sinkholes that originate in the Tapeats sandstone or below. I propose the sediments were laid down at high temperature and the flowing water that deposited them was not adequate to cool them. The life forms that interacted with the strata have to be consider as reacting to significantly hot strata. The breccia pipes that underlay the sinkholes are gas escape columns formed by escaping gasses from the mantle or lowest crystalline layers.
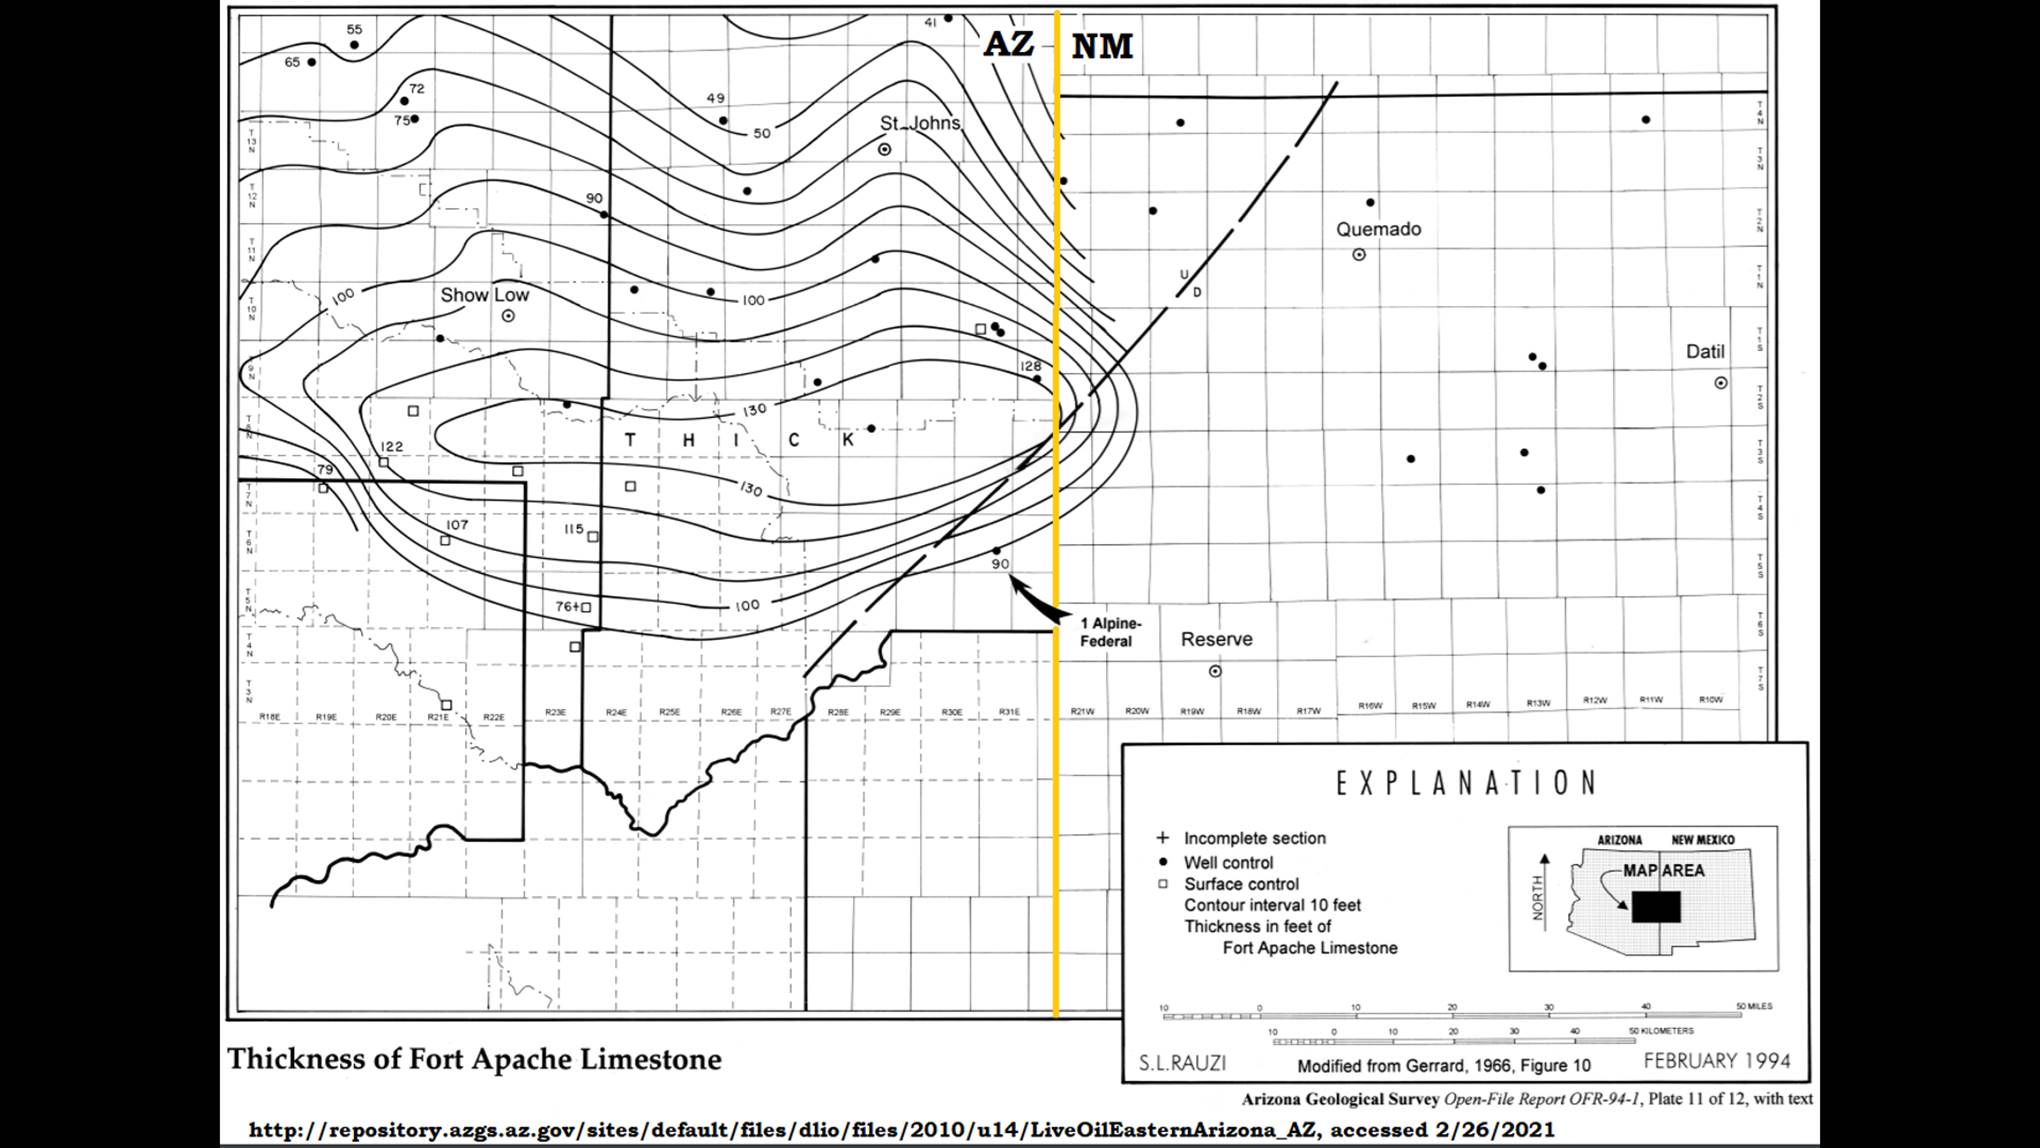 Figure 52: The Fort Apache Limestone is a relatively thin strata arriving in the middle of the Schnebly Hills sandstone. It was blown to the south by the same wind that carried the Coconino and Schnebly sandstones in that direction.
 Figure 53: The Fort Apache Limestone commonly has Bryozoan fossils and occurs in extreme eastern Arizona, overlapping New Mexico, I associate it with the Petrified Forest crater, To see the crater, we need a larger area view, but I brought the view closer to see the county lines to show the association between the area of the limestone and the area of the crater.
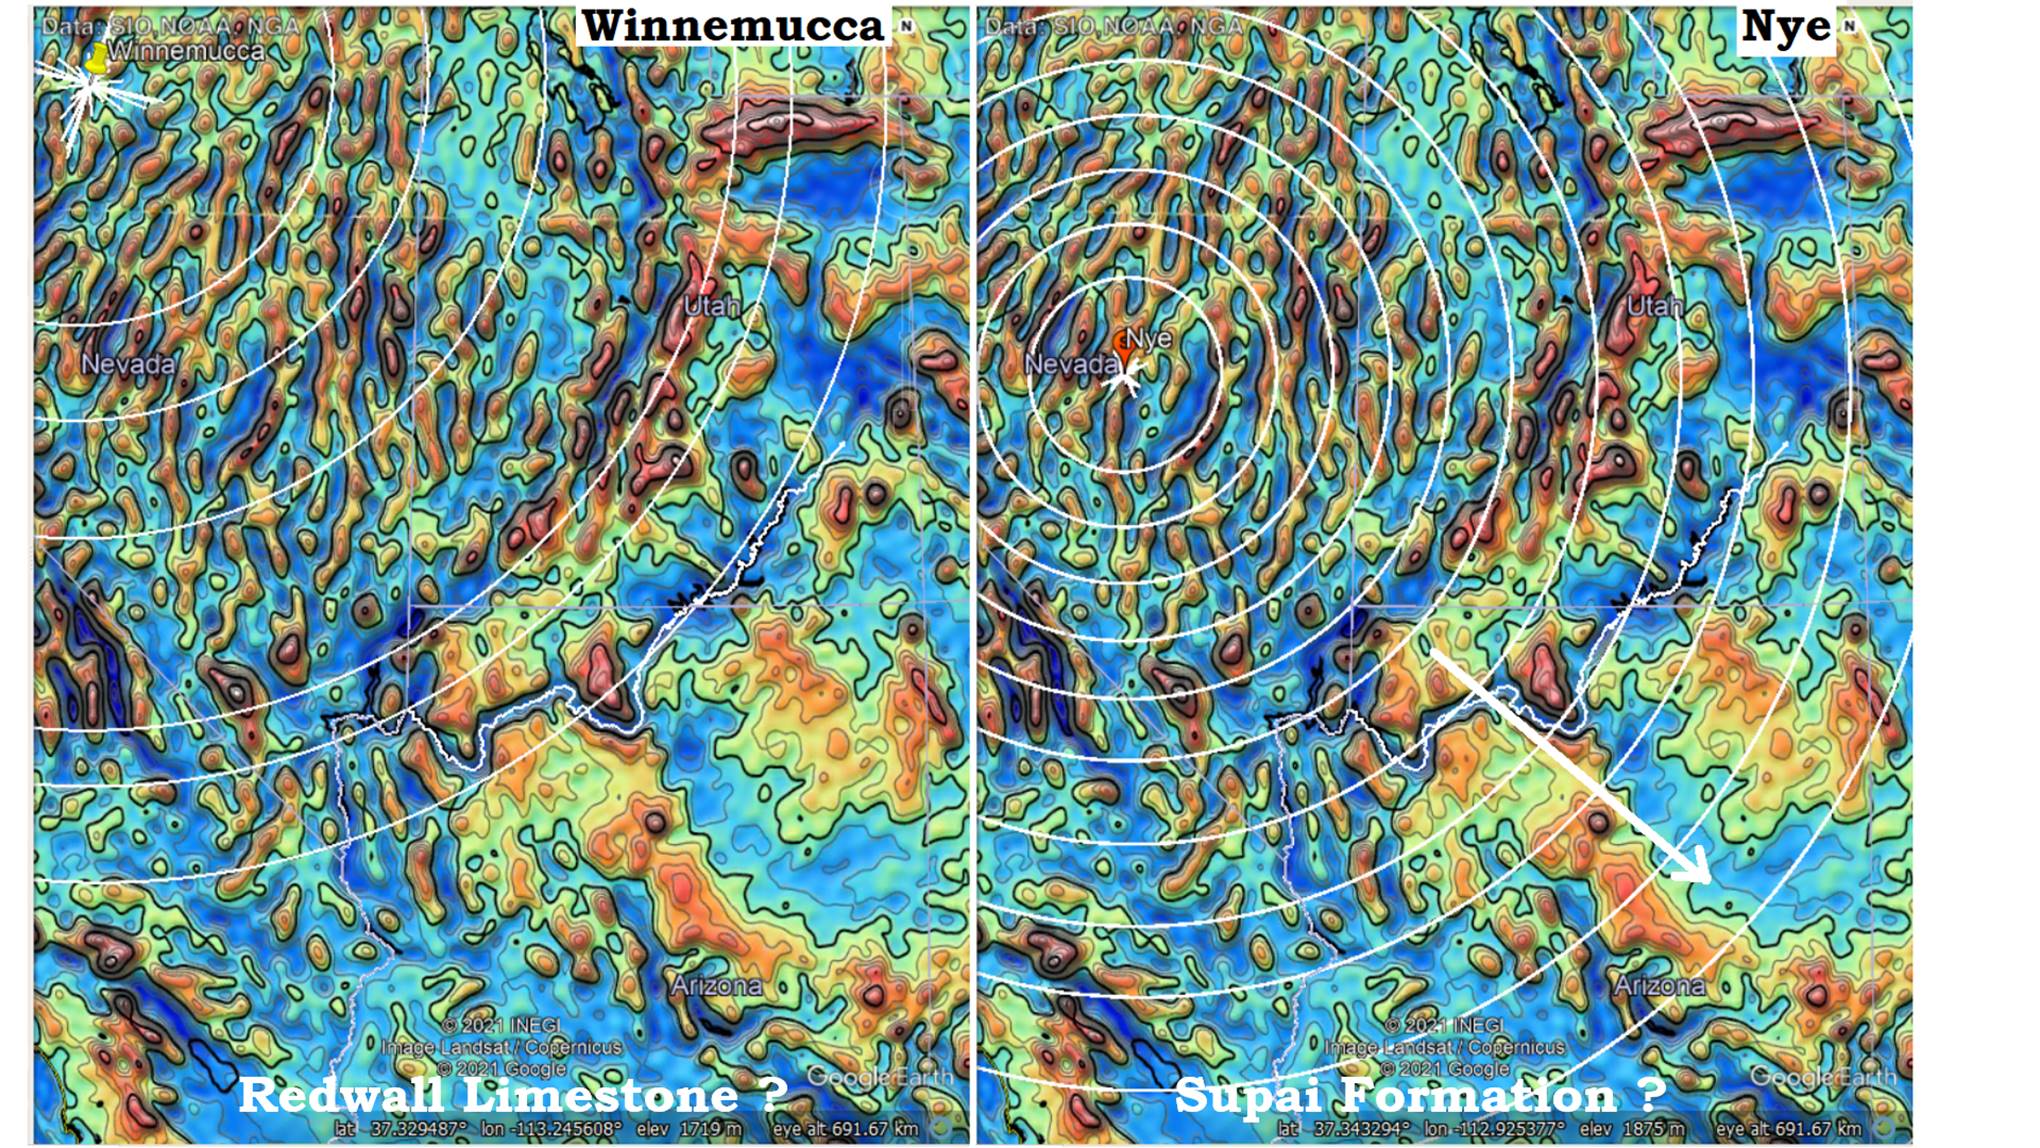 Figure 54: There are some other possibilities for the Redwall Limestone and the Supai formation. Both the Winnemucca and Nye crater centers are in Nevada, and not all that far from the Gandy crater that may have formed the Surprise Canyon valleys. The only real evidence of direction for a crater center comes from Beus and Morales (2003). They give the direction of deposition as the arrow in the right image indicates, which could apply to any of the three centers. A cratering source for the Toroweep and Kaibab Limestone, and the Moenkopi Formation could also be any of these three craters. More research is needed.
 Figure 55: Breccia Pipes are located all over the greater Grand Canyon area from Sedona on the south to Holbrook on the east and to the Paradox Basin on the north. Although popular models have them starting in the middle of the Redwall in karst structures and climbing upwards by hydraulic penetration. But, in the area of the Hualapai Reservation some sinkholes extend down into the Tapeats Sandstone. The connection of Tapeats Cave along Tapeats Fault suggest the source of displacement is below the Tapeats Sandstone in the basement rock. Some breccia pipes extend upwards as far as the Chinle Formation, and many in the immediate area of the Grand Canyon cap-out above the Tapeats with small inclusions of red Moenkopi Formation.
 Figure 56: Top of the Orphan Lode Copper and Uranium Mine on Maricopa Point, South Rim of the canyon shows the typical profile of pipe-in-pipe structure seen in all breccia pipes. Redder area may be spots of overlying Moenkopi above the Kaibab Limestone. Pipe-in-pipe structure can only form in gas escape structures. Well lithified pieces of skarn from the mines show that the strata was lithified but it broke loose in chunks that are often colored with hematite. In the Mitten Ridge breccia pipe/sink hole that terminates about 2-300 feet (60-100 m) into the Schnebly Hill Formation the last layer of sandstone is only partly melted in a concentric ring pattern like an onion skin, and small garnets are formed on the ceiling, Garnets melts just under 2,000 degrees C (3,600 degree F) suggesting the gas was at least that temperature when it arrived. For such gas to work its way up through almost a mile of sediment and still maintain that temperature requires that the sediment had to have a significantly elevated temperature already.
 Figure 57: The karst structures, caves, ascribed to down percolating water through the limestone should also be ascribed to the rise of hot gases. I will suggest the breccia pipes happened first when the mantel gases were at their hottest they moved rapidly melting their way through much of the strata. A second event later released more mantle gases which only got as far as the Redwall Limestone and stopped due to cooler conditions of the strata. Instead of moving higher they spread laterally making cave systems. From the labyrinth of remaining rock between bubbles of gas to the tubular channels in Groaning Cave, to the identical spiral chimneys seen in Cave of the Domes (Grand Canyon), Groaning Cave (Colorado), and Grand Canyon Cavern (Peach Springs, AZ), and the shrinkage cracks visible in Groaning Cave, they all were formed by hot gas. Since the caves growth seem to be restricted to the limestone, it may show that it retained its heat longer than sandstone or shale allowing the lateral movement of the gas. This would also explain lateral uranium deposits in Colorado.
 Figure 58: The Surprise Canyon valleys in the top of the Redwall are commonly explained as the Redwall was aerially exposed for some time while valleys were slowly eroded into its surface. I am suggesting the valleys are release valleys, like the Unaweep Valley in my first cratering paper, and formed in the adiabatic process in mere seconds to minutes. This means that the Redwall limestone was produced by one crate. Surprise Canyon valleys were release valleys from another crater, which after forming the valleys then started depositing the Supai Sandstone that fills and lays atop it.
 Figure 59: Did the Unkar and Chuar groups represent the first craters? I believe the Vishnu Schist represents a thrust then deposits from the Gorda Crater, and the Zoroaster Granite may originate with Pedregosa Crater. The faults or fissures that the Zoroaster Granite intrudes seem to belong to the Gorda center, so the Vishnu Schist may have originated with an even earlier crater. Or, maybe the Pedregosa crater made the faults containing the Zoroaster Granite. Generally, an adiabatic liquid is injected into faults and fissures that open up during the adiabatic conversion. The fissures were produced by a previous generation of craters.
Sevier and Grand Canyon, Pt 1
 There may be no other plot of ground so often used to illustrate many of the geologic processes espoused in textbooks than the Grand Canyon. Geologist talk about it like they have the processes all figured out. Is it just possible that they have gotten it all wrong? This presentation is going to suggest unimaginable cratering was responsible for everything we see in the Grand Canyon, from the rocks, the sequence, the faults, and the actual canyon. None of it got there by geological processes we can see happening around us today. We will question if some of the processes even work the way everyone has assumed they would. Gentle reader, do not be afraid to questions the rocks, the processes, even my model, but above all, question the assumptions both you and I have made. Our God is a God of mystery, but He is also a God of Knowledge. And in knowing, He is worthy of our praise.
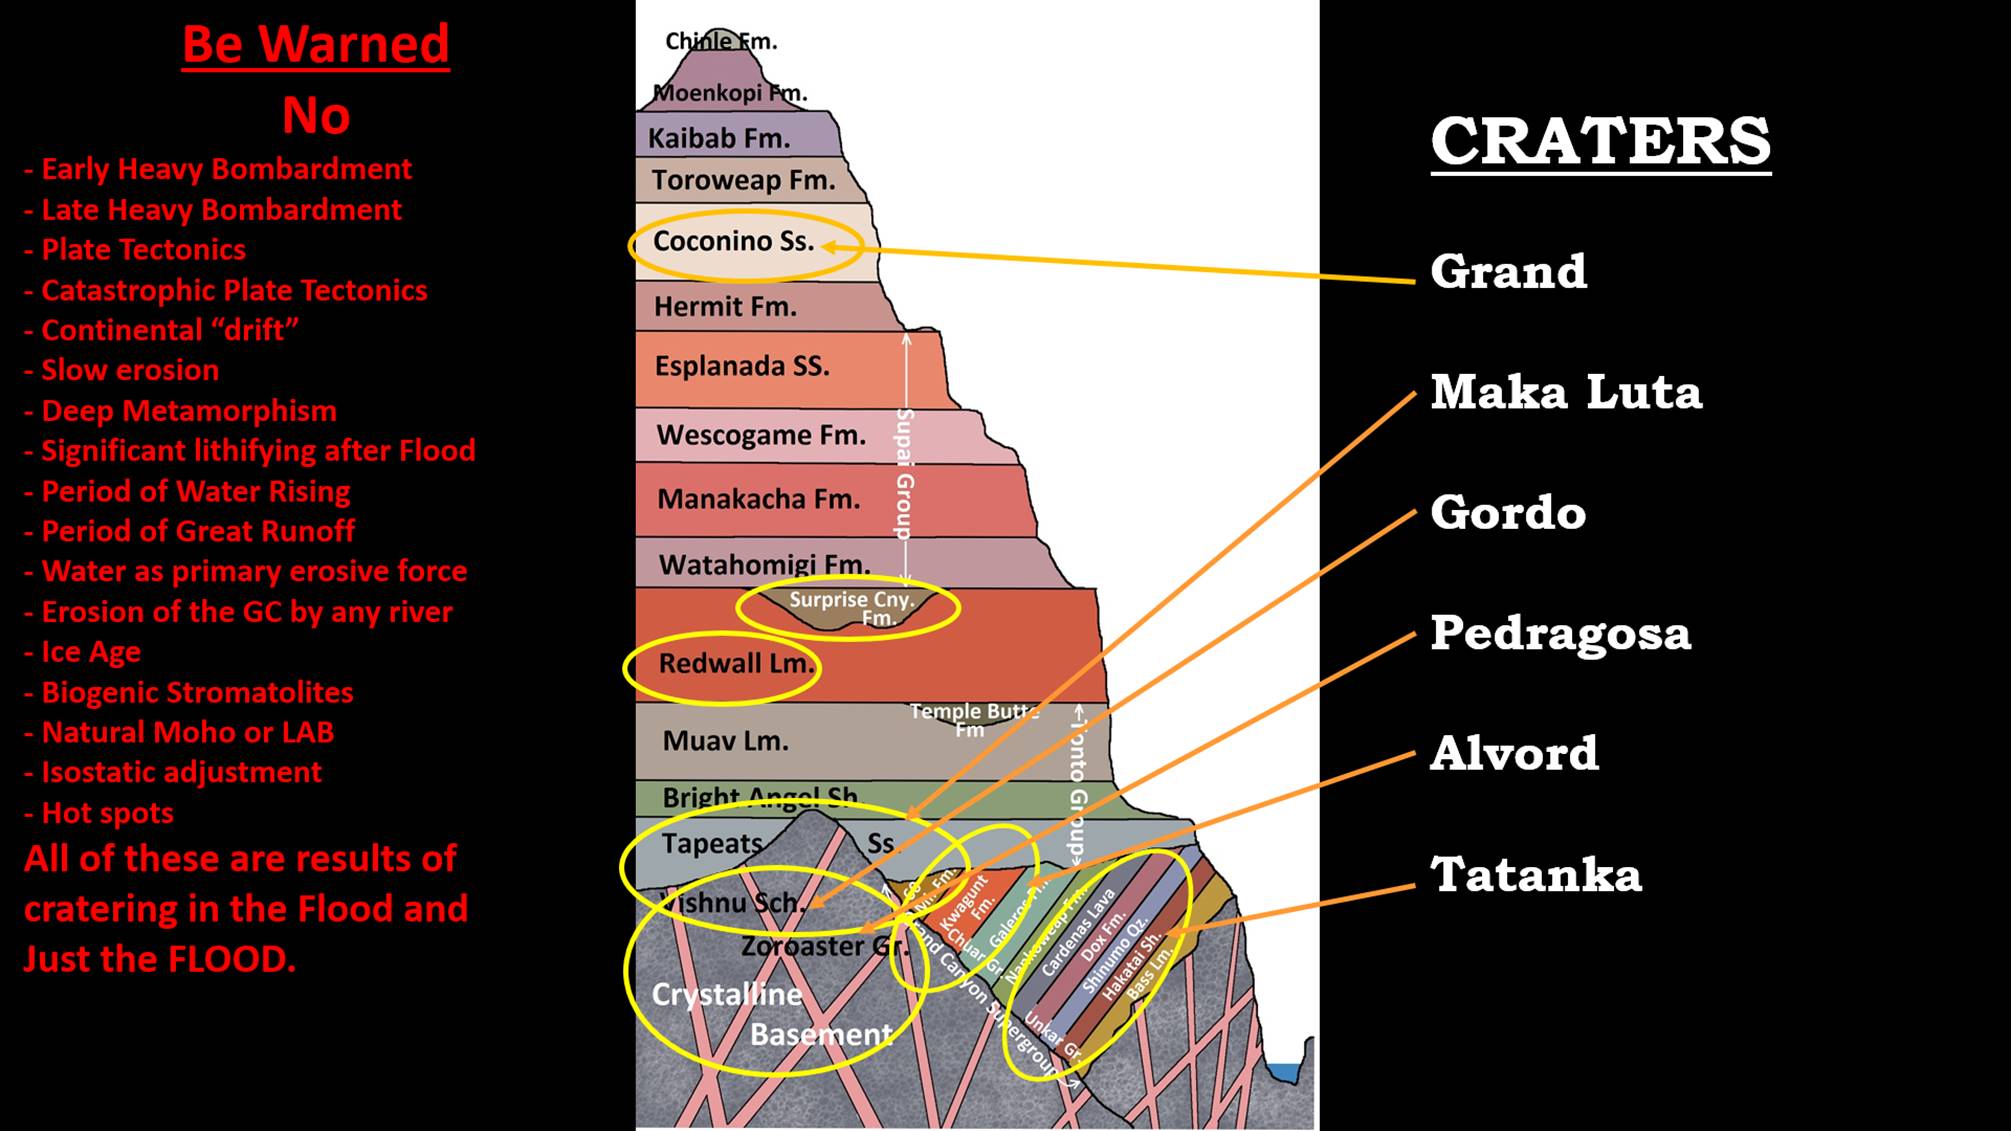 Figure 1: Any reader may question why a discussion of the Grand Canyon would start with looking at the northern edges of Canada. We share a common continent with the northern reaches of Canada, and we share the results of those early cratering processes. One of the earliest mountain building events was the Sevier Orogeny, which extends from northern Canada down to the Grand Canyon. While the canyon is not normally included in the orogeny’s events we will see that it springs from a common point of origin. While it would be convenient to start in on the deepest strata in the canyon, the Crystalline Basement, we must first look at the cratering process to define our terms and understand together the foundations of our discussion.
 Figure 2: How do impactors form their crater? Shoemaker in 1973 looked at the Meteor Crater and saw a hole very much like the Teapot ESS crater that had recently been blasted in the Nevada nuclear test site. But nuclear test are routinely buried in deep shafts so that the dirt fallback buries a significant portion of the radioactivity. Between step 6 and step 7, he envisioned the conversion between the shock wave to the release wave generating a lot of projectiles which were ballistically ejected in step 8. The fallback from this ballistic ejection builds a crater rim of fallback as well as largely filling the crater.
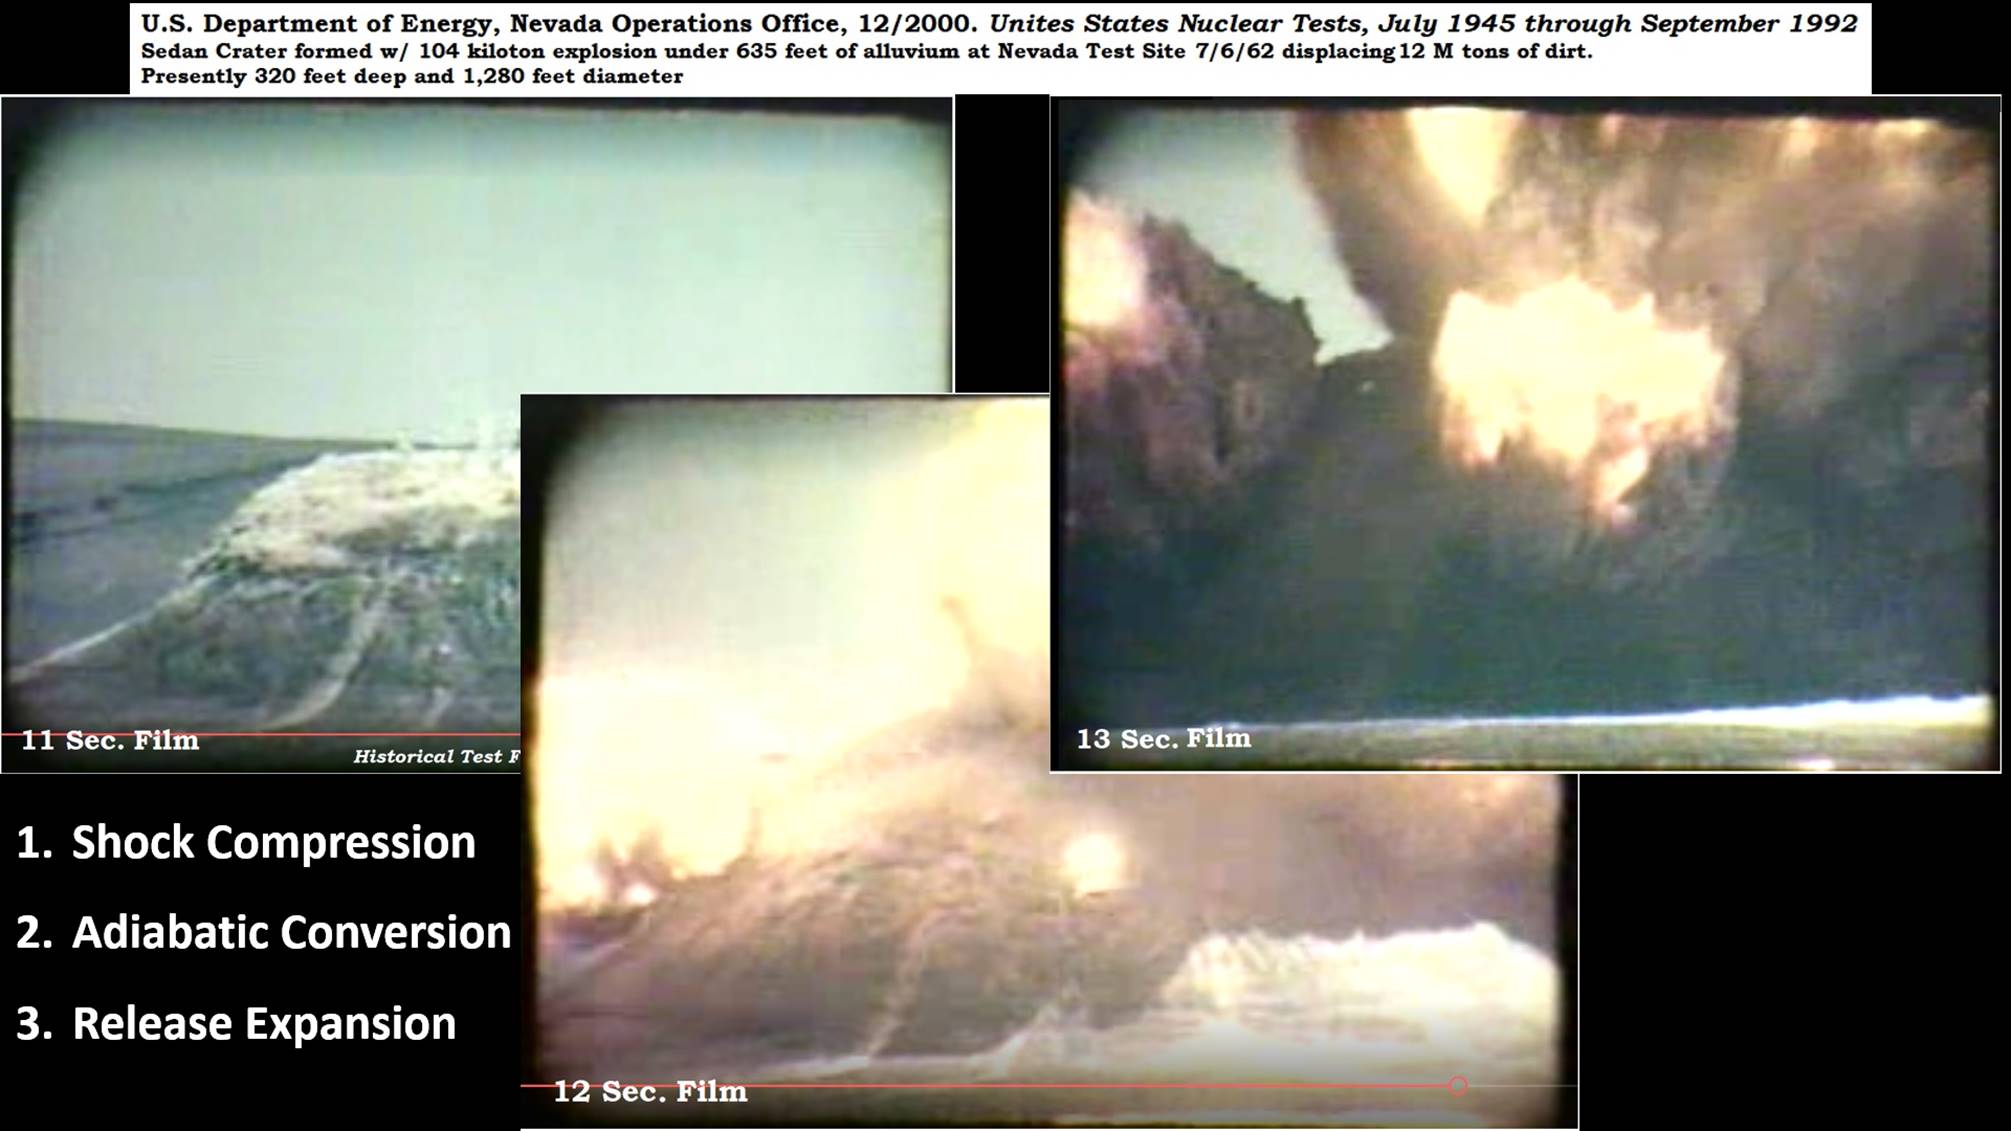 Figure 3: Looking at the documentary footage from the Sedan Nuclear Test in 1962. This test was conducted with a 104 kiloton explosion under 635 feet (194 m) of alluvium. Times on the images is running time. Narrator said the third image was approximately 3 seconds after ignition, so film footage was exposed faster than shown. Fist image, a matrix bubble is seen to be forming below ground, and in less than a second the bubble is seen to be bursting with flames of energy, until the heat release consumes the bubble shell. The Shock wave was sent out with the original ignition. As it converts to the Release wave tremendous amounts of the original compression wave is converted to heat because it is released to rapidly to travel in an orderly manner from molecule to molecule. This heat is the actual flames seen shooting out of the expanding bubble. Twelve mega tons of dirt were displaced largely because it was detonated at depth. The bombs over Hiroshima and Nagasaki produced NO crater because they were exploded slightly in the air for maximum destruction.
 Figure 4: In the Sedan explosion some chunks of superheated rocks produced steam or dust trails as the continued on their limited trajectory, designed to stay very locally to localize and bury radioactivity. The raising of the rim was not primarily a build-up of ejecta, but the sediments forced outwards into the substrate in the shock compression expression, the bubble seem swelling and rising in first image of Figure 3.
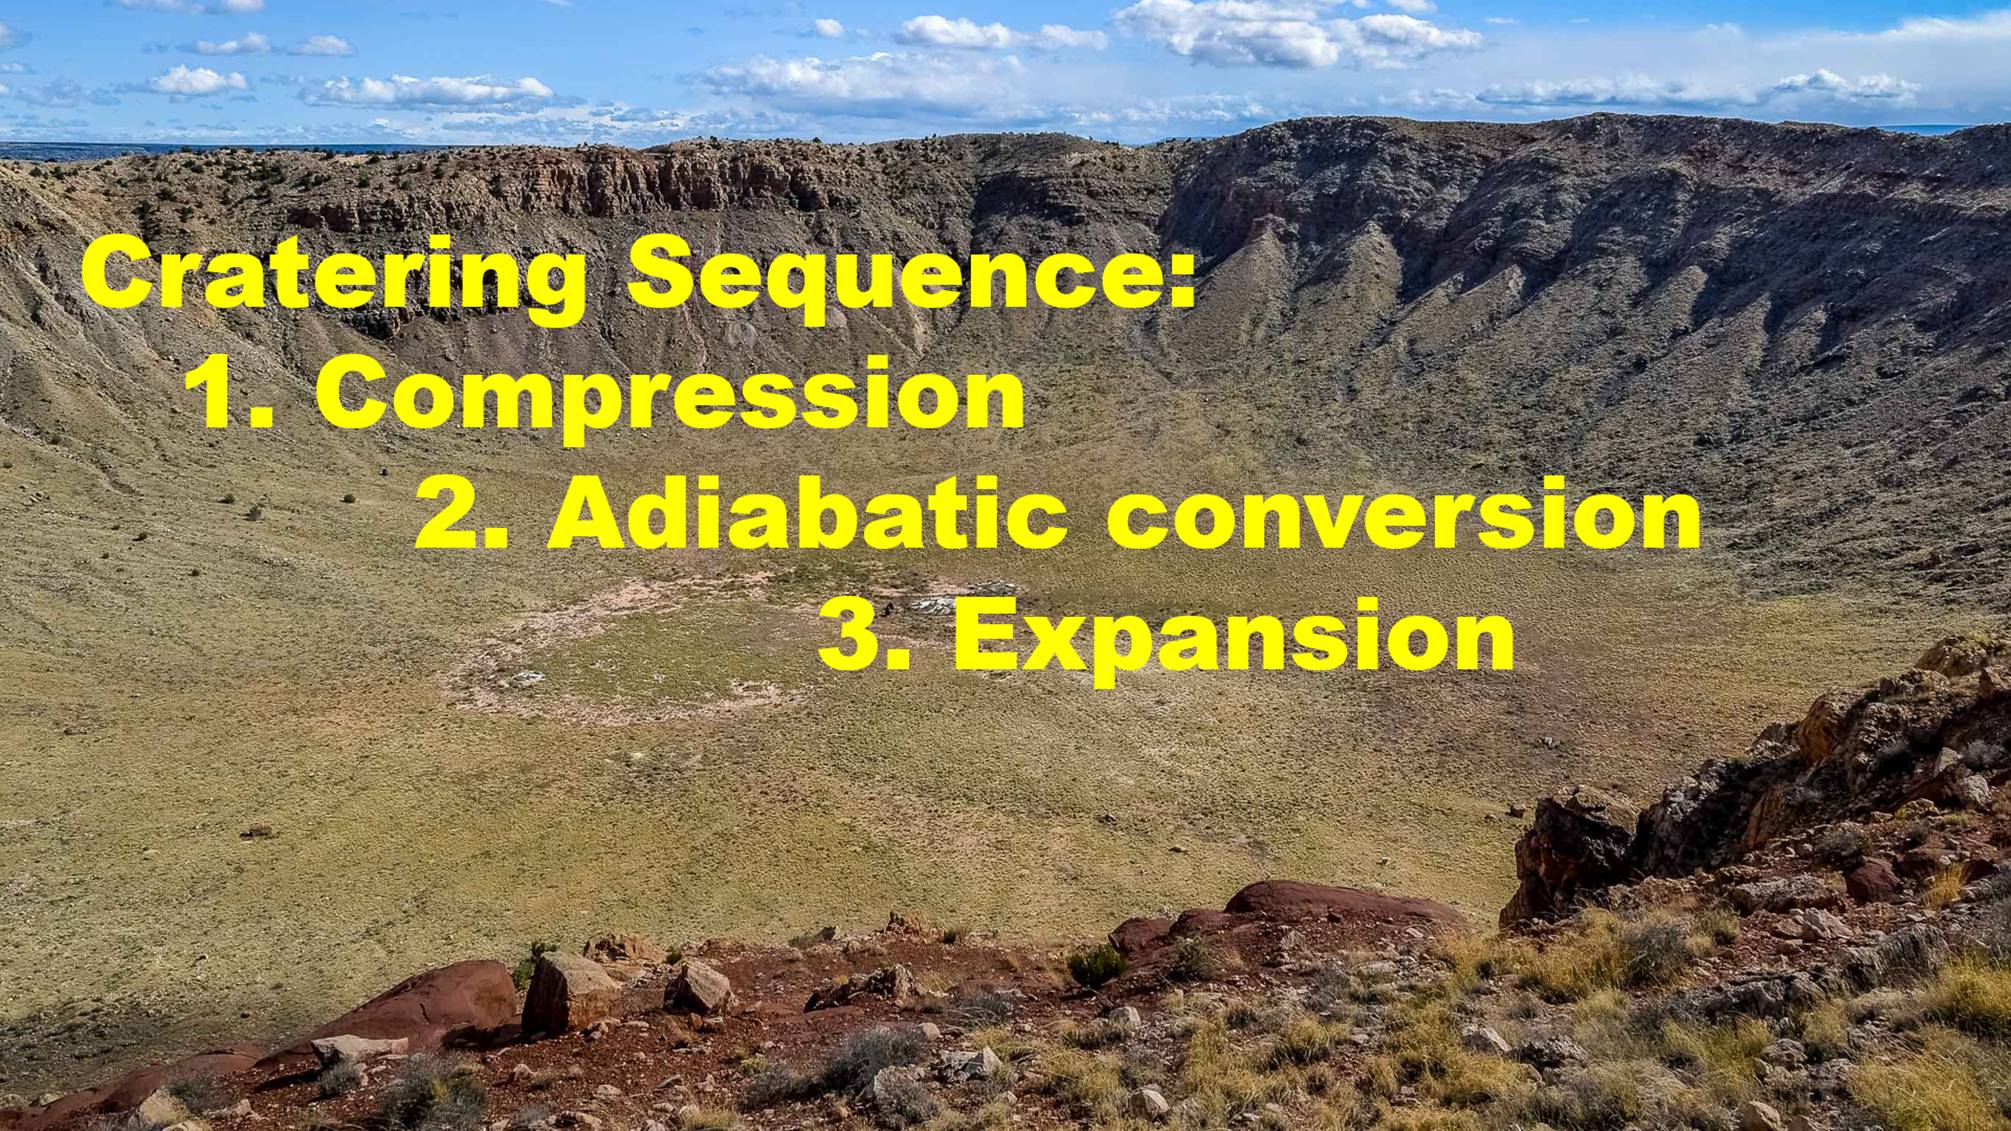 Figure 5: Central Arizona is the site of Meteor crater, also known as Barringer Crater; named for the family that owns it. Shoemaker developed his cratering model at Meteor Crater and NASA still uses it. Contrary to Shoemaker’s thinking, the rim was formed by lifting as compression forces some of the cratering material to retreat from the center of shear into openings between every particle of the surrounding substrate. A much thinner shell of earth than in the Sedan explosion formed at the far reaches of the expansion wave that then was pierced by a limited number of projectiles with a great release of heat. If we look outside Meteor Crater, this is a big hole, we should see some pieces of big rubble. We do not.
 Figure 6: The Google Earth view shows only a halo of small white rubble, extending to the northeast. This extension is called a “wind-streak.” Using Thermal Infrared image by NASA, the terrane is mostly Kaibab limestone (green) with many small patches of Moenkopi (blue), mainly to south and east. High silica Coconino (red) is the shattered white sandstone seen in Google Earth image. Most of the crater bottom and surrounding terrane still shows blue, the color for limestone in the infrared spectrum. That means the Kaibab limestone that originally covered the ground was compressed into the bottom of the crater, not blasted outward prior to the Coconino movement. The outer ejecta is primarily red in the TIR image and white in the Google Earth. The white ejecta is largely contained inside the blue arrow, and near the crater rim except where I have drawn linears through it. The linears represent fractures that opened up primarily along linear 1 and 2 through faults that opened up in the adiabatic conversion. I invite you to read Chapter 8 for a much more lengthy discussion of the evidence. The downward COMPRESSION forced breccia, produced by the ADIABATIC CONVERSION, down into the fractures. The resulting EXPANSION pushed up the rim and sent breccia out by the fractures beyond the rim through these linears. Primarily, the rubble is contained within the original rim, but the heat and pressure converted breccia radiates outwards by ejection through fractures. I expect this to be the pattern in all craters except the expression of heat/energy will be proportional to the size of the impactor and resultant crater. The crater bowl produced by some large craters would not be produced by ballistic excavation but compression, and the bottom (Moho) would be surfaced by recrystallized melt from that crater. While in college I witnessed the ignition of 13 sticks of melted dynamite in a grazed field of dry winter wheat. It blew the top and sides of the wooden box to splintered and compressed a 5 foot disk of earth with the box bottom about 6 inches, but left the wheat stalks under the lid only flattened on the surface.
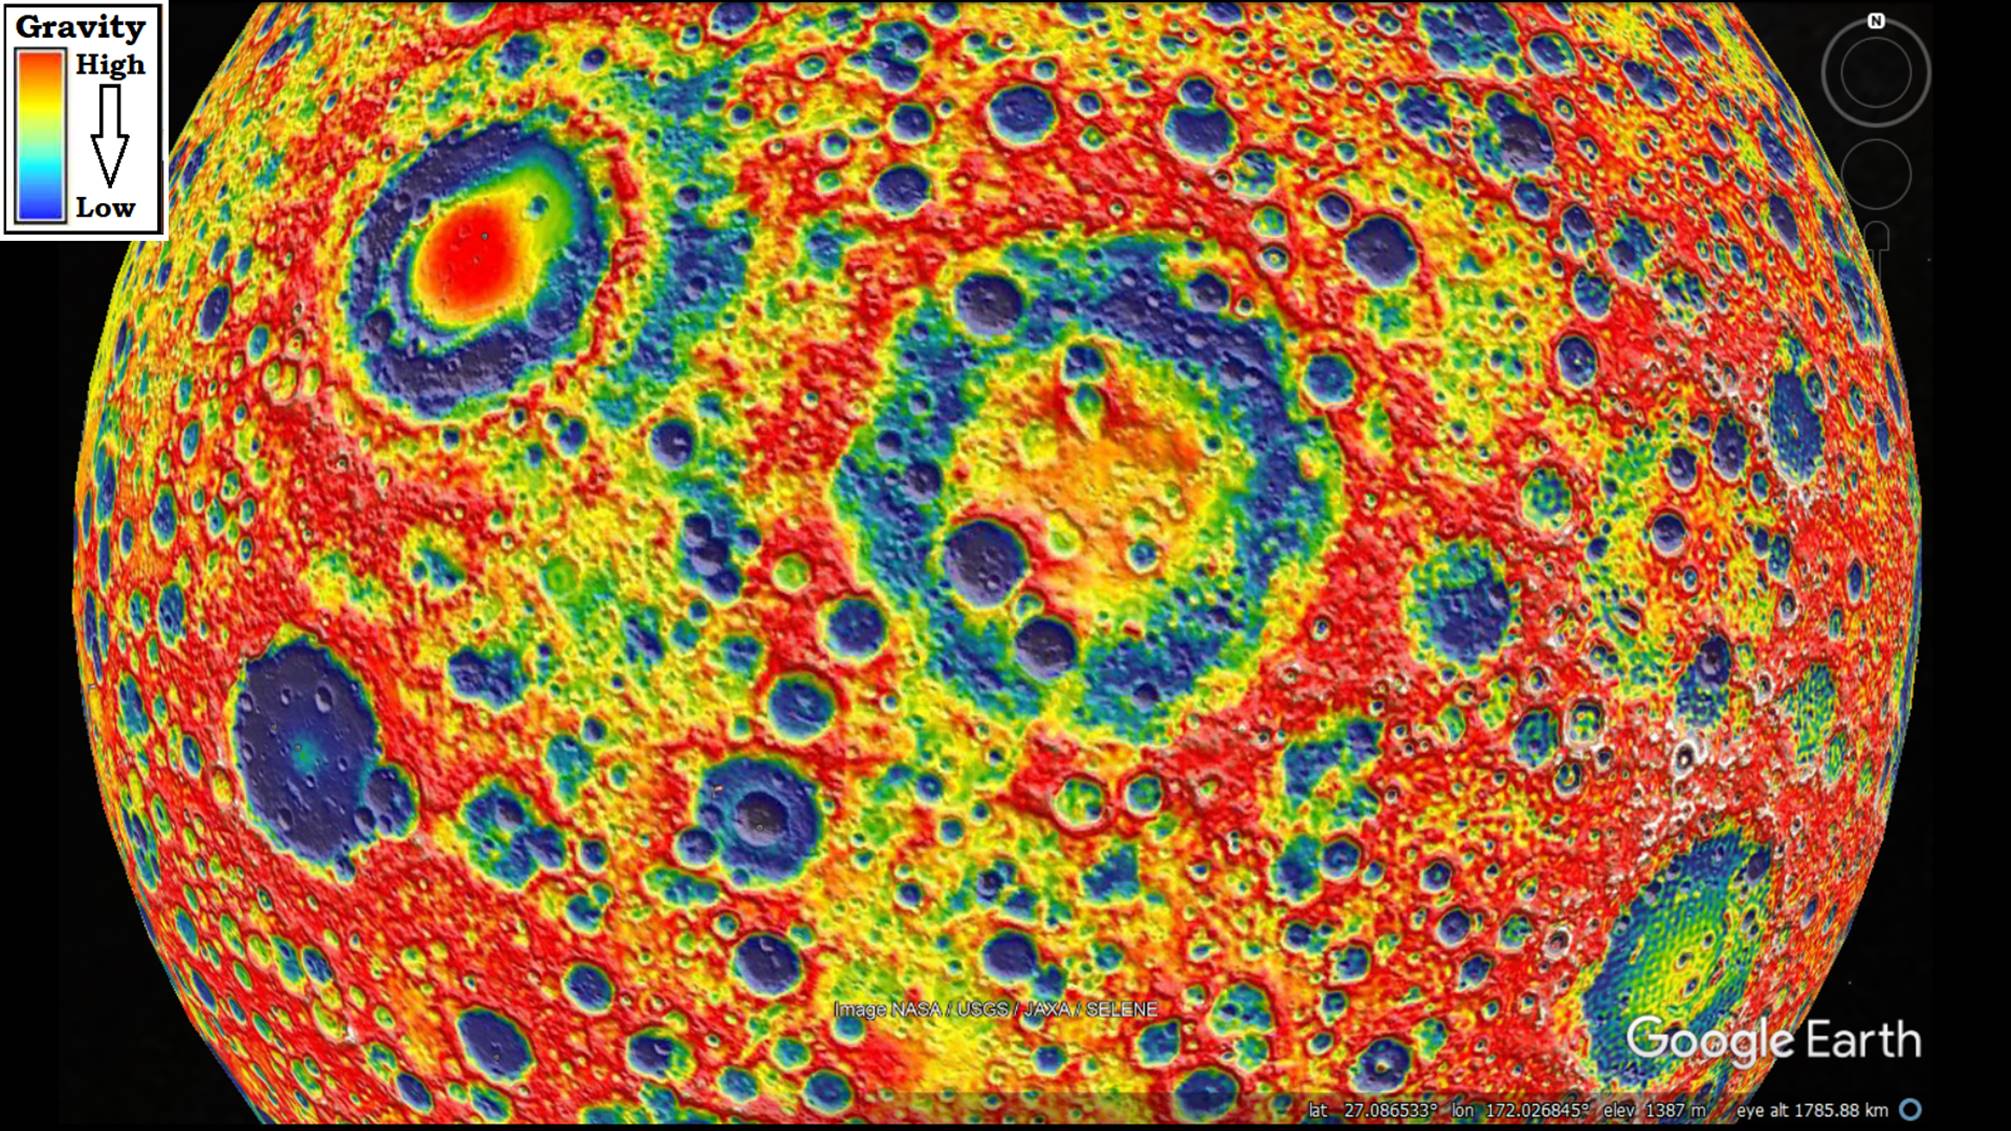 Figure 7: This is the farside of the moon. It is often called the “high-lands” much more like the continental areas of earth which are the earth’s “high-lands”. Much of this cratering study will use strangely colored maps of both the moon and earth. These are gravity map. Gravity maps DO NOT correspond to topography maps, but often they look similar. On a topography map a mountain may show high because its shape is tall, and in a gravity map it may show high because it has denser lithology (more gravity) than surrounding rocks. It is a subtle difference but extremely important because not all landforms with high topography have high gravity, and some low landforms have high gravity. The Compression/shock wave will produce high gravity whether it produced high topography or not. And by contrast, Expansion/release waves will produce low gravity whether they later are pushed to great heights. The bull-eye pattern seen on the moon are high compression/red gravity ringed with low expansion/blue gravity rings repeating outward.
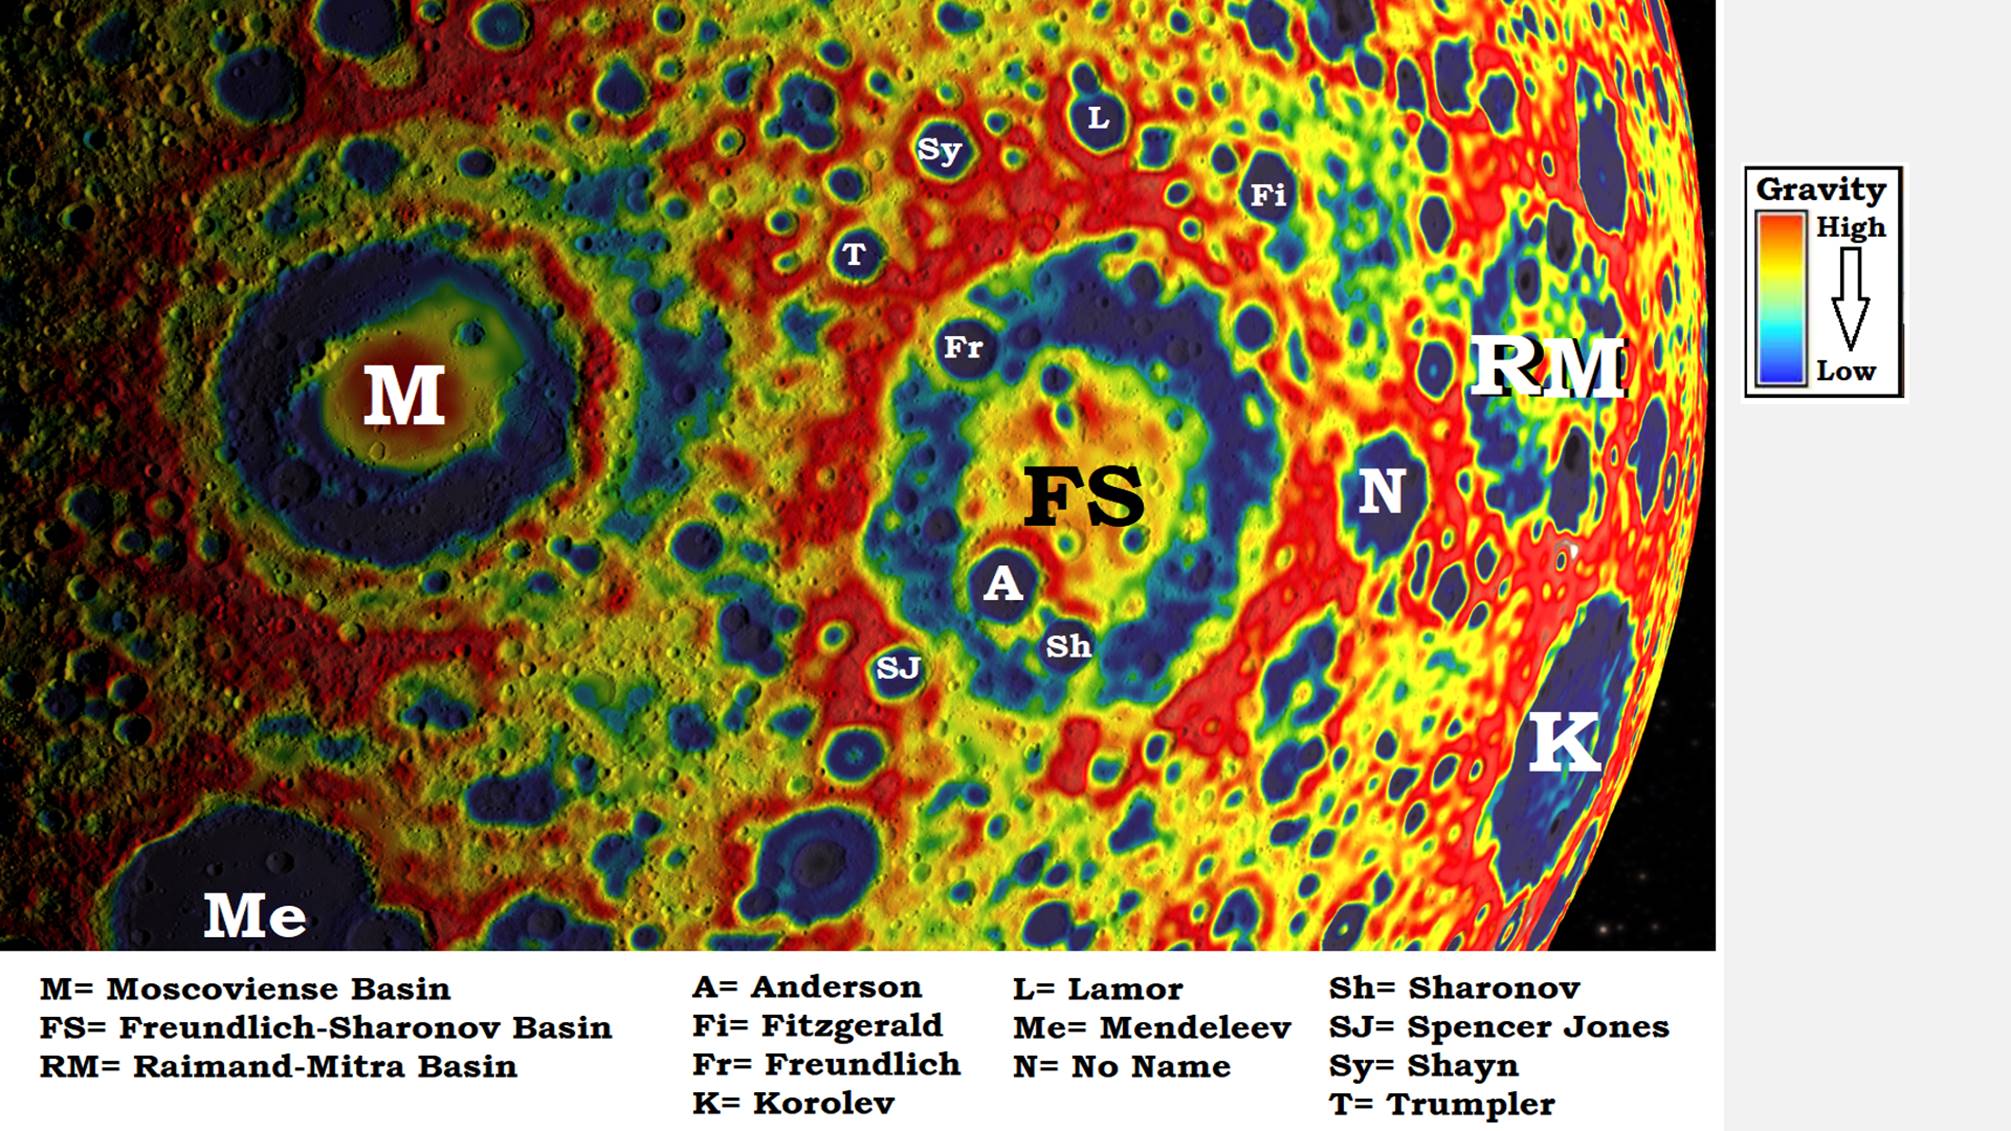 Figure 8: On the farside of the moon some craters are still designated basins because bureaucracy is slow changing names to show recognized craters. I may refer to them as craters, which they are. We need to first consider where to gather data. NASA provides three wonderful maps of the moon: GRAIL (gravity, seen here), Crustal Thickness, and Topography. If you are using Google Earth, you can paste these as pictures on Google Moon and the landmark names and distances will show up appropriately. A fourth map is very useful, Red Relief, that comes from the JAXA, Japan Aerospace Exploration Agency (their NASA), and can also be pasted on Google Moon. For Gravity on Earth, Scripps Institute of Oceanography (UCSD) offers a Global Gravity Anomaly overlay for Google Earth that you cannot do without. You will find web addresses at the end. First of all notice that nearly all of the craters, large and small, but especially the medium size ones, have a dark blue center. That is LOW gravity. But by contrast three of the largest, Moscoviense, Freundlich-Sharonov, and Raimand-Mitra Basins, have red centers. The red center is referred to as a Mascon, a mass concentration. These basins did not show up as individual craters until the GRAIL gravity map was produced, but it is now easy to recognize the red/denser/ high gravity rings from the blue/ low gravity rings between. We can deduce from this view that the normal center of a crater in not necessarily low topography, but it is low gravity until a mascon forms.
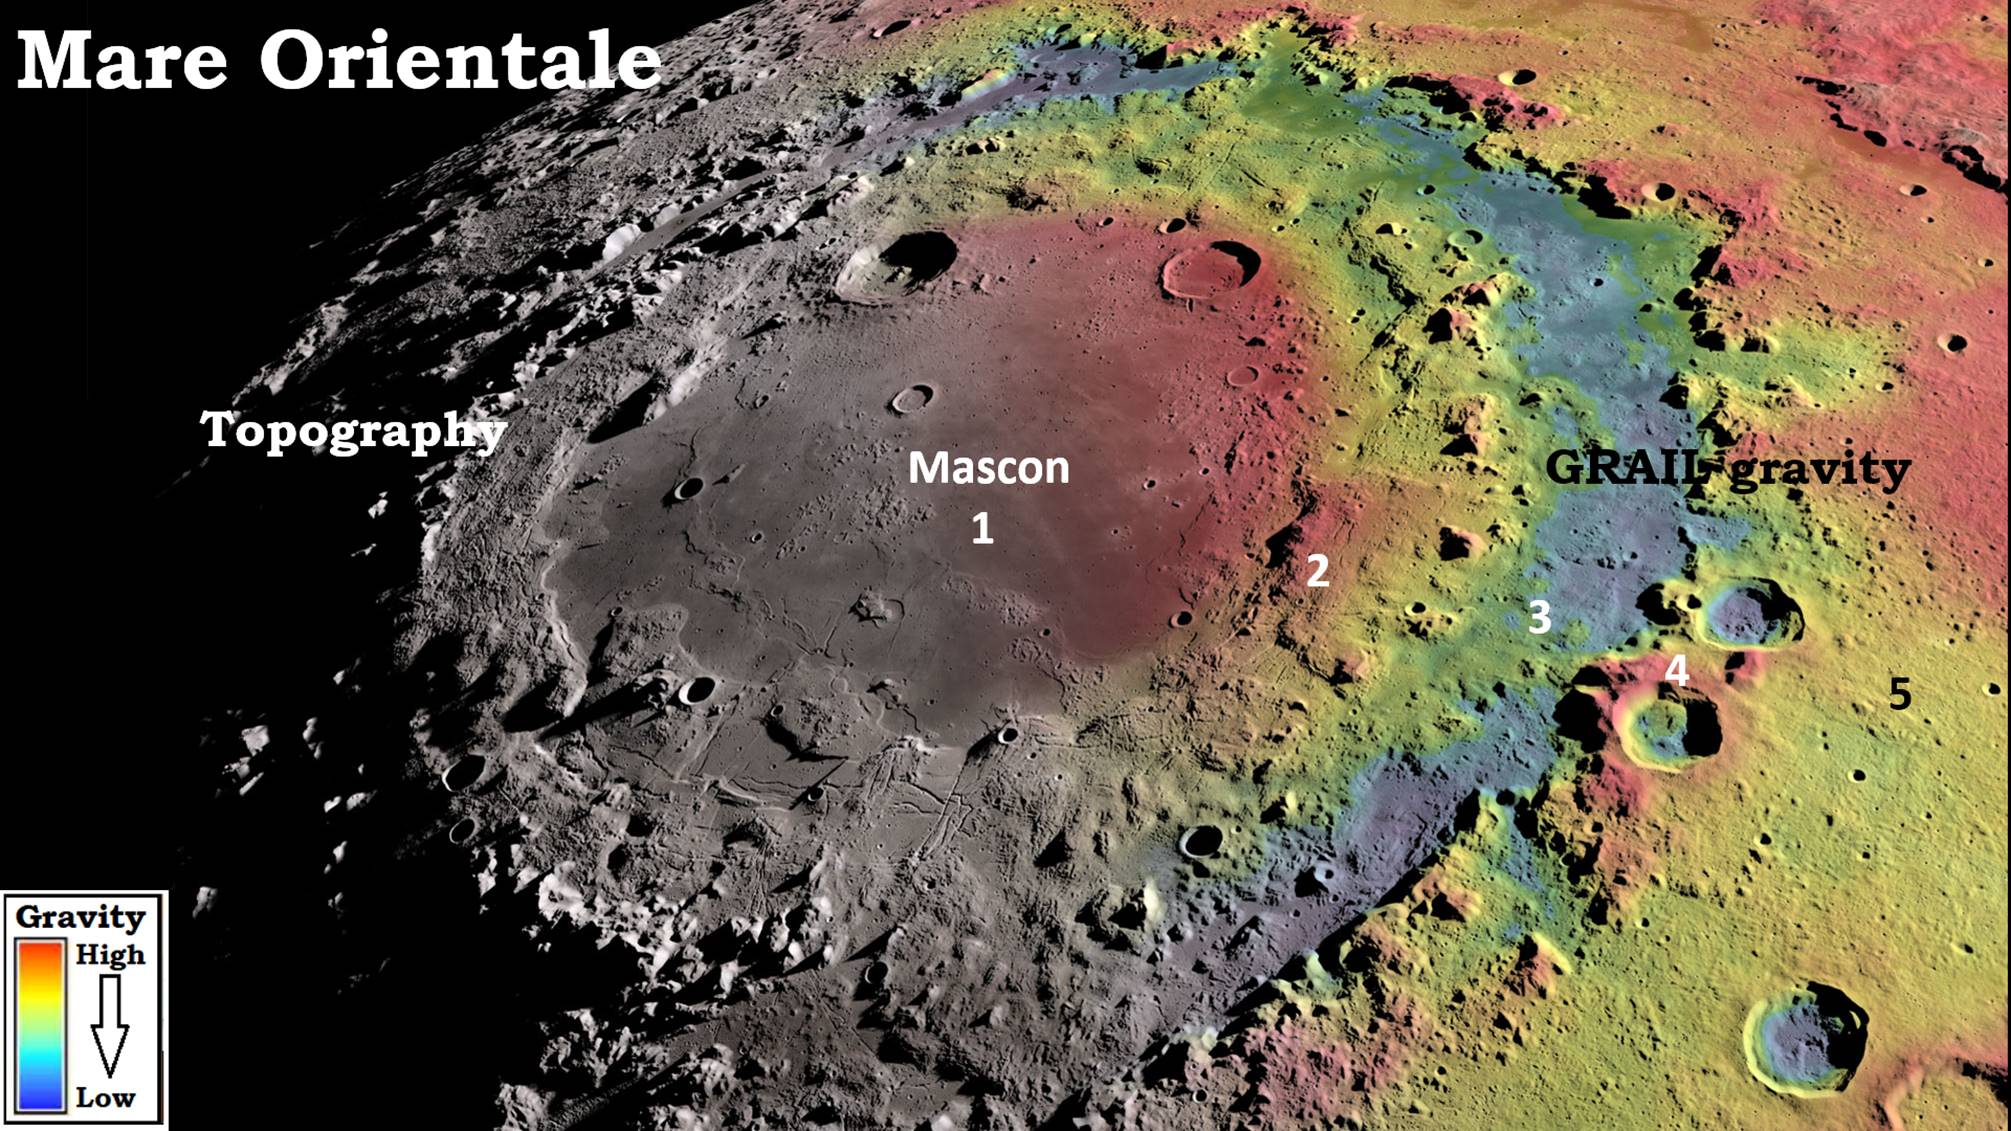 Figure 9: The first view the public got of the GRAIL data was pasted over the east half of Mare Orientale, a NASA produced image for Science Magazine. It shows the correlation between tall topography and high gravity, except at the center. The red 1-center/mascon is such high gravity it totally mask topography and other small changes in gravity. 2-Ring is red, yellow and green, so it shows high and lower gravity, more than the topography suggest. 3-Ring is low gravity, but it has topographic highs in it. 4-ring varies similarly to 2-ring. 5-ring does not show low gravity with blue. But. It does show lower gravity in a small circular area just below the “5”. It becomes a task of judging how comparatively low and how comparatively high.
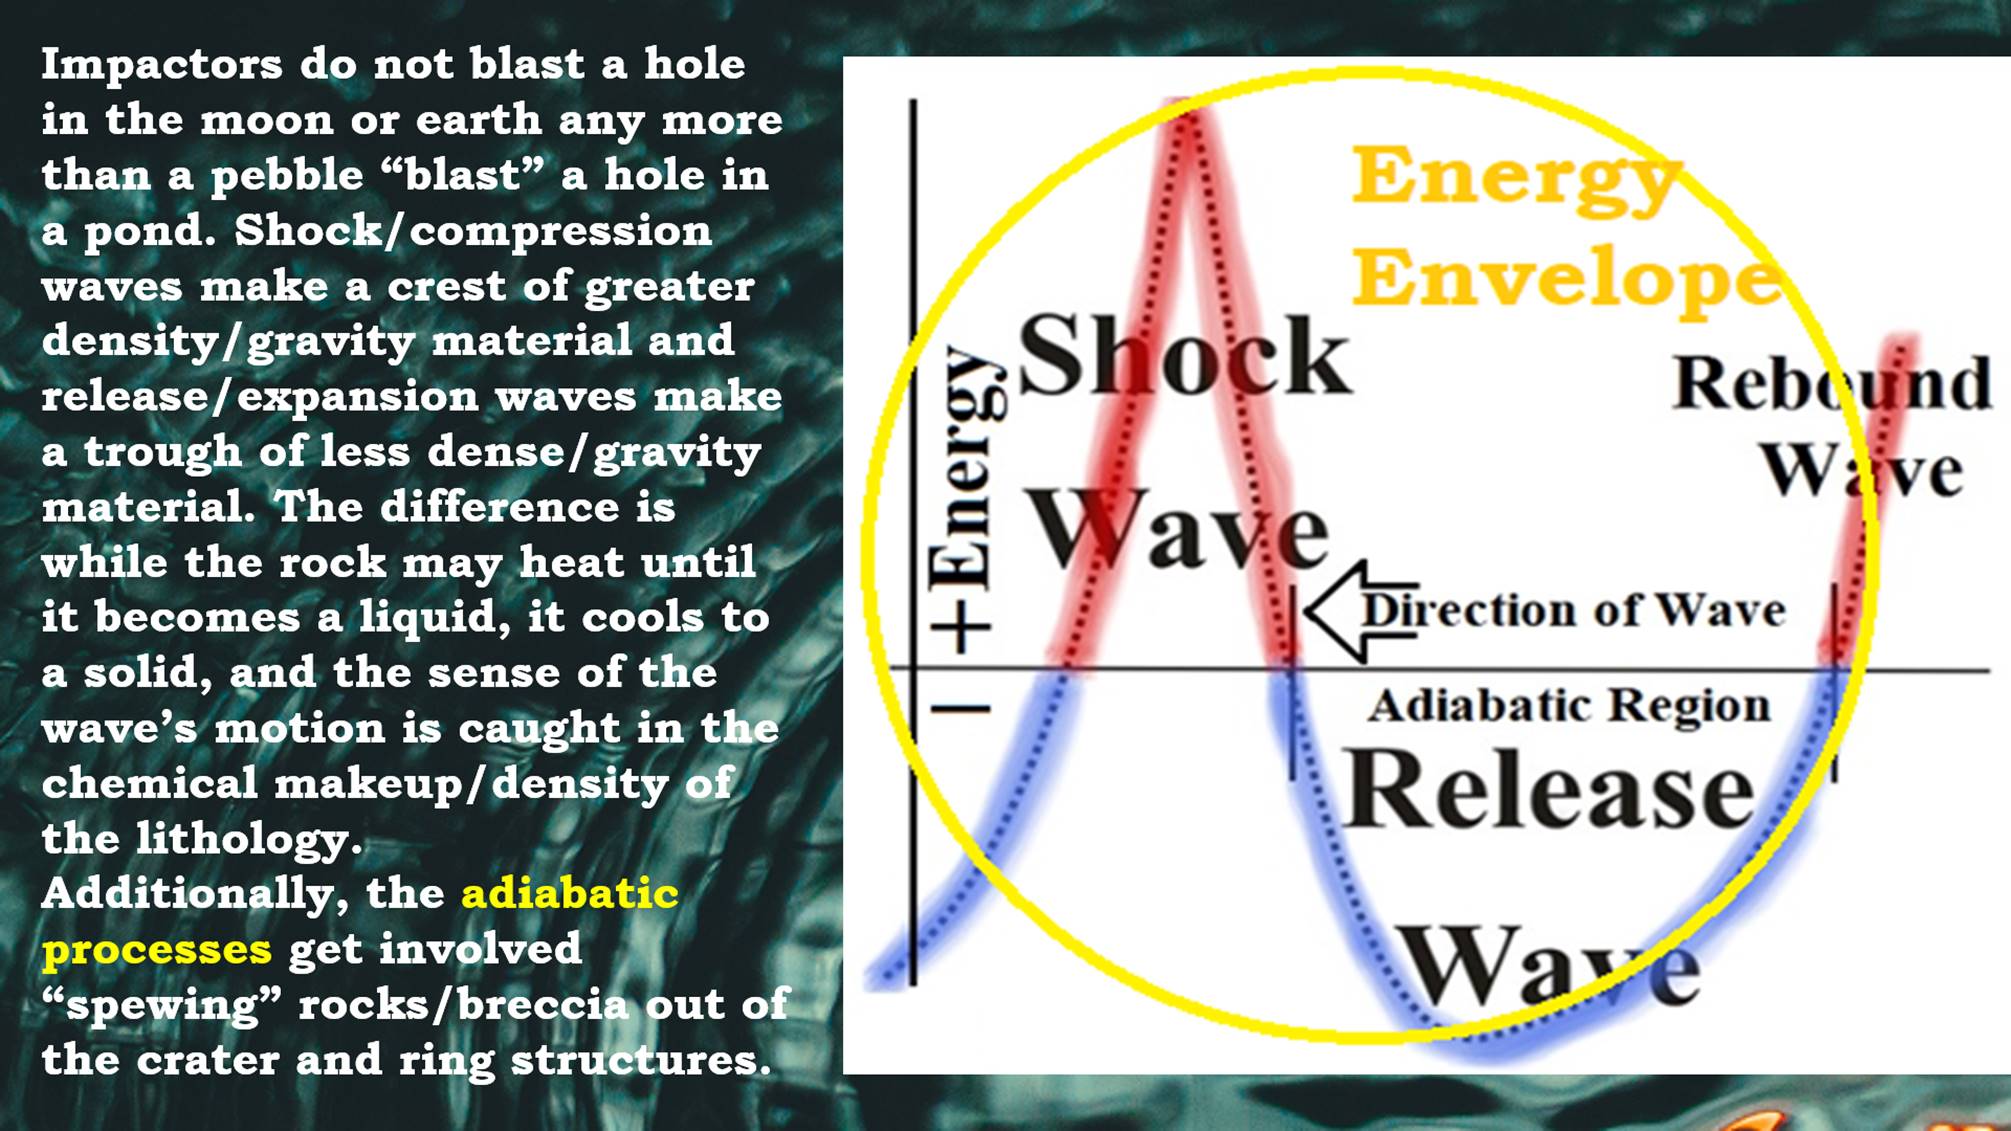 Figure 10: Energy envelope will be an important concept for seeing craters on moon or earth. When an impactor strikes a body it does not blast a hole in it, any more than a pebble “blast” a hole in a pond when it is thrown it. It will make a splash, but not blast-out a hole. Shock/Compression waves make a crest of greater density/gravity material and release/expansion waves make a trough of less dense/gravity material. The difference is while a rock may compress until it becomes a liquid, it cools to a solid, and the sense of the wave’s motion is caught in the chemical makeup/density of the rock. Additionally, the adiabatic processes get involved “spewing” ablated (rounded) rocks/breccia out of the crater and ring structures. An energy envelope will then consist of one expression each of the compression wave and expansion wave, generally a ring of red with a ring of blue inside of it.
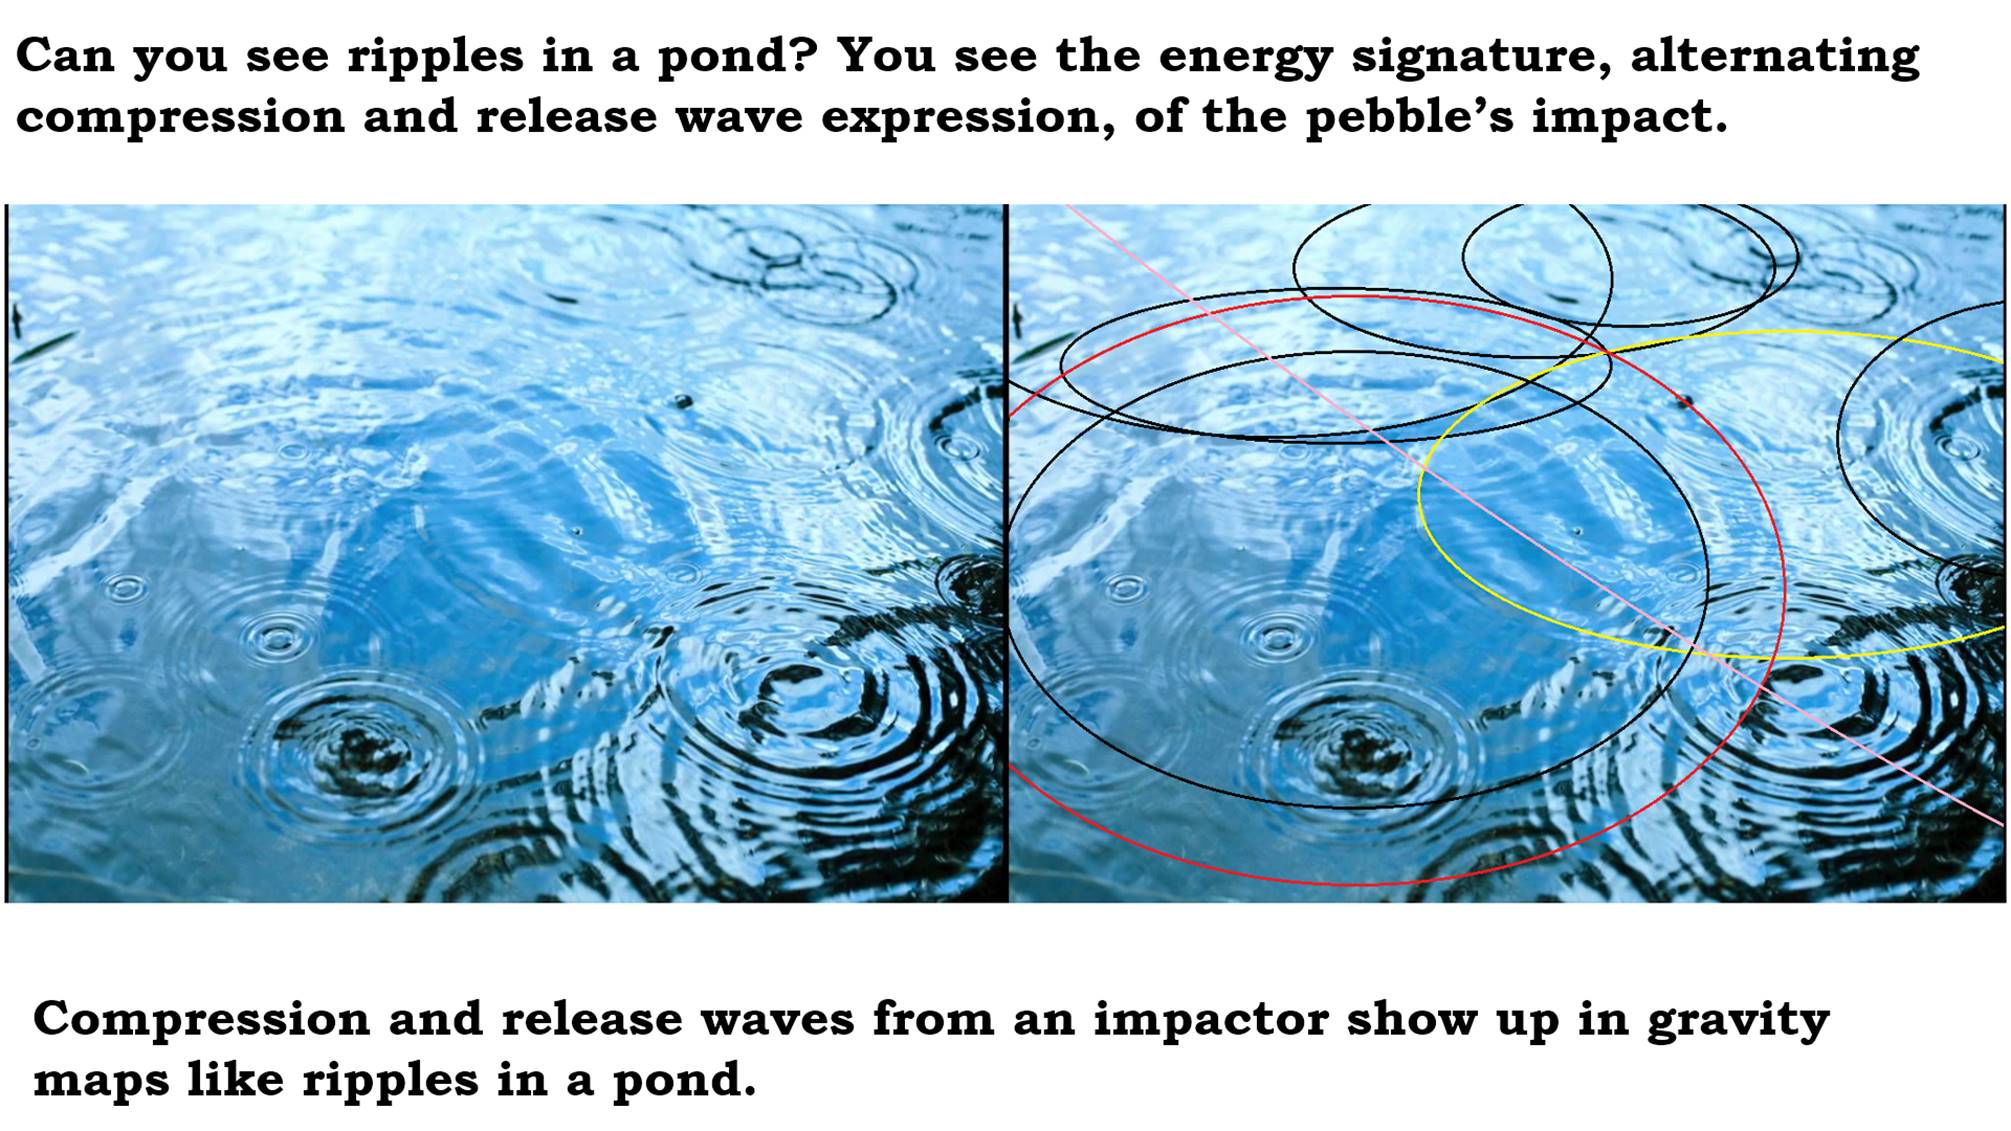 Figure 11: When you see ripples in a pond, you are seeing the energy signature, alternating shock/compression waves and release/expansion waves. This is an expression of the pebble’s impact energy. Look at the image on the left, how many ripples can you pick out? Can you see the one that is colored red on the right? We can all probably see the one in black inside of it, and if we look carefully we can probably pick out some expressions of the red-ring within and between other ripples. Can you see the yellow-ring? It is pretty obvious in the center and towards the right edge, but will probably take a little looking to see it along the far distant edge. Can you see the pink line? Again it is obvious in the center and becomes less so within the other ripple patterns. But, ripples show us one very important characteristic, other sets of ripples do not obliterate previous ones, they just add to their expression. Look at the obvious pattern in the lower right hand corner. When ripples overlap, they form a system of nodes, with the additive and subtractive combinations for the energy put into each water molecule. So, as it is a wave, the energy is not expended but it keeps on moving outward until it is dissipated and lost in noise.
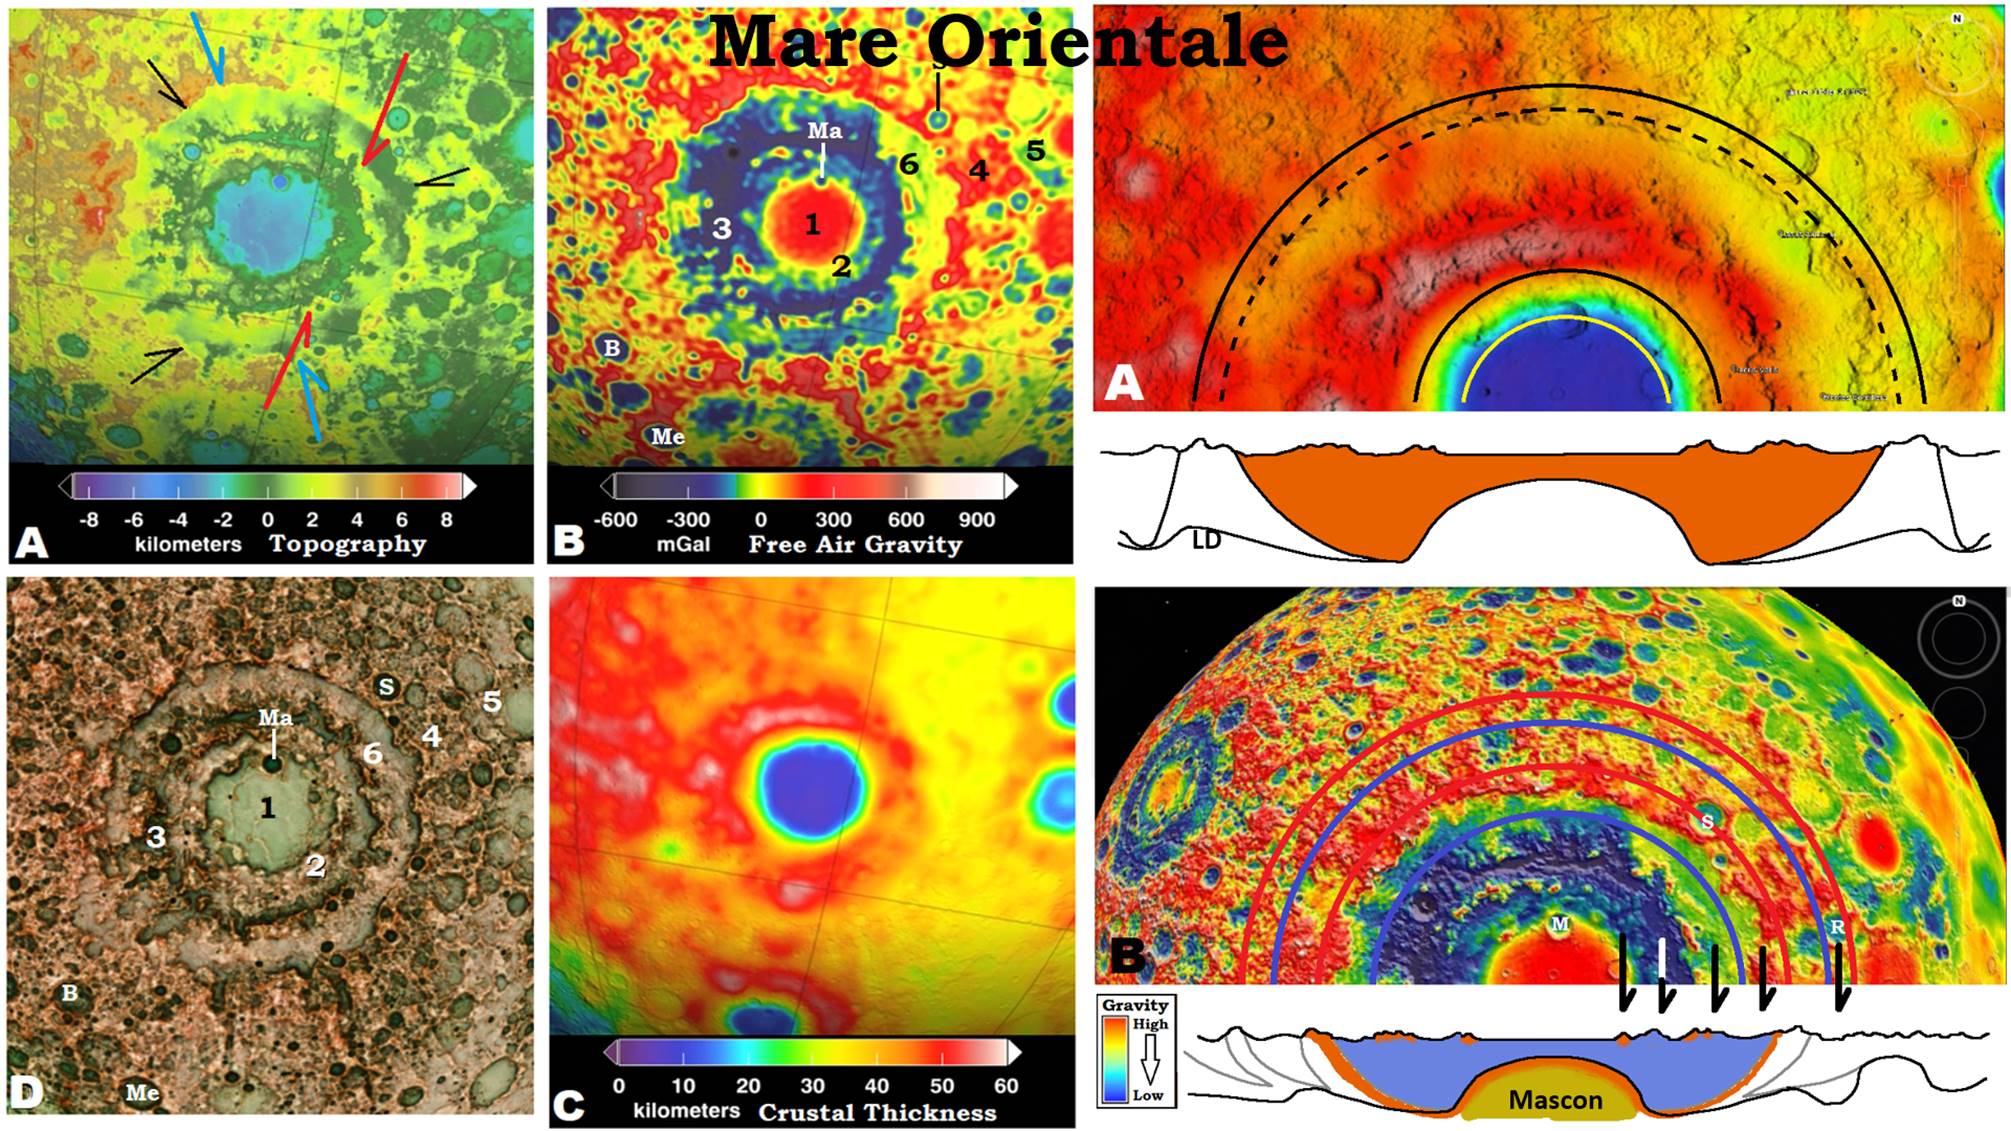 Figure 12: Looking at Mare Orientale in greater detail, (A) shows some linear ridges and valleys that cut across the first few rings. Most of these can be traced even further out with greater detail afforded by the zoom feature on Google Earth. The crater center is amongst the lowest topographic points seen, but Gravity in (B) shows it to be a mascon with the bright red/highest gravity center. Crustal thickness shows the center to be the thinnest crust in the immediate area with a red ring, thickest crust just inside 4-ring. So the densest crust is just outside the thickest crust. A possible structural cross section in shown at upper right, with the orange showing crustal thickness, and the Lunar Discontinuity (LD), equivalent to the Moho on earth, showing variation in depth between crust and mantle. With the gravity map in lower right, the mascon is indicated as probably a pull-up of the mantle in the rebound of the crater floor. (Chapter 10 and 16 in the book.) The five arrows represent where Hartmann in his 1963 book placed them.
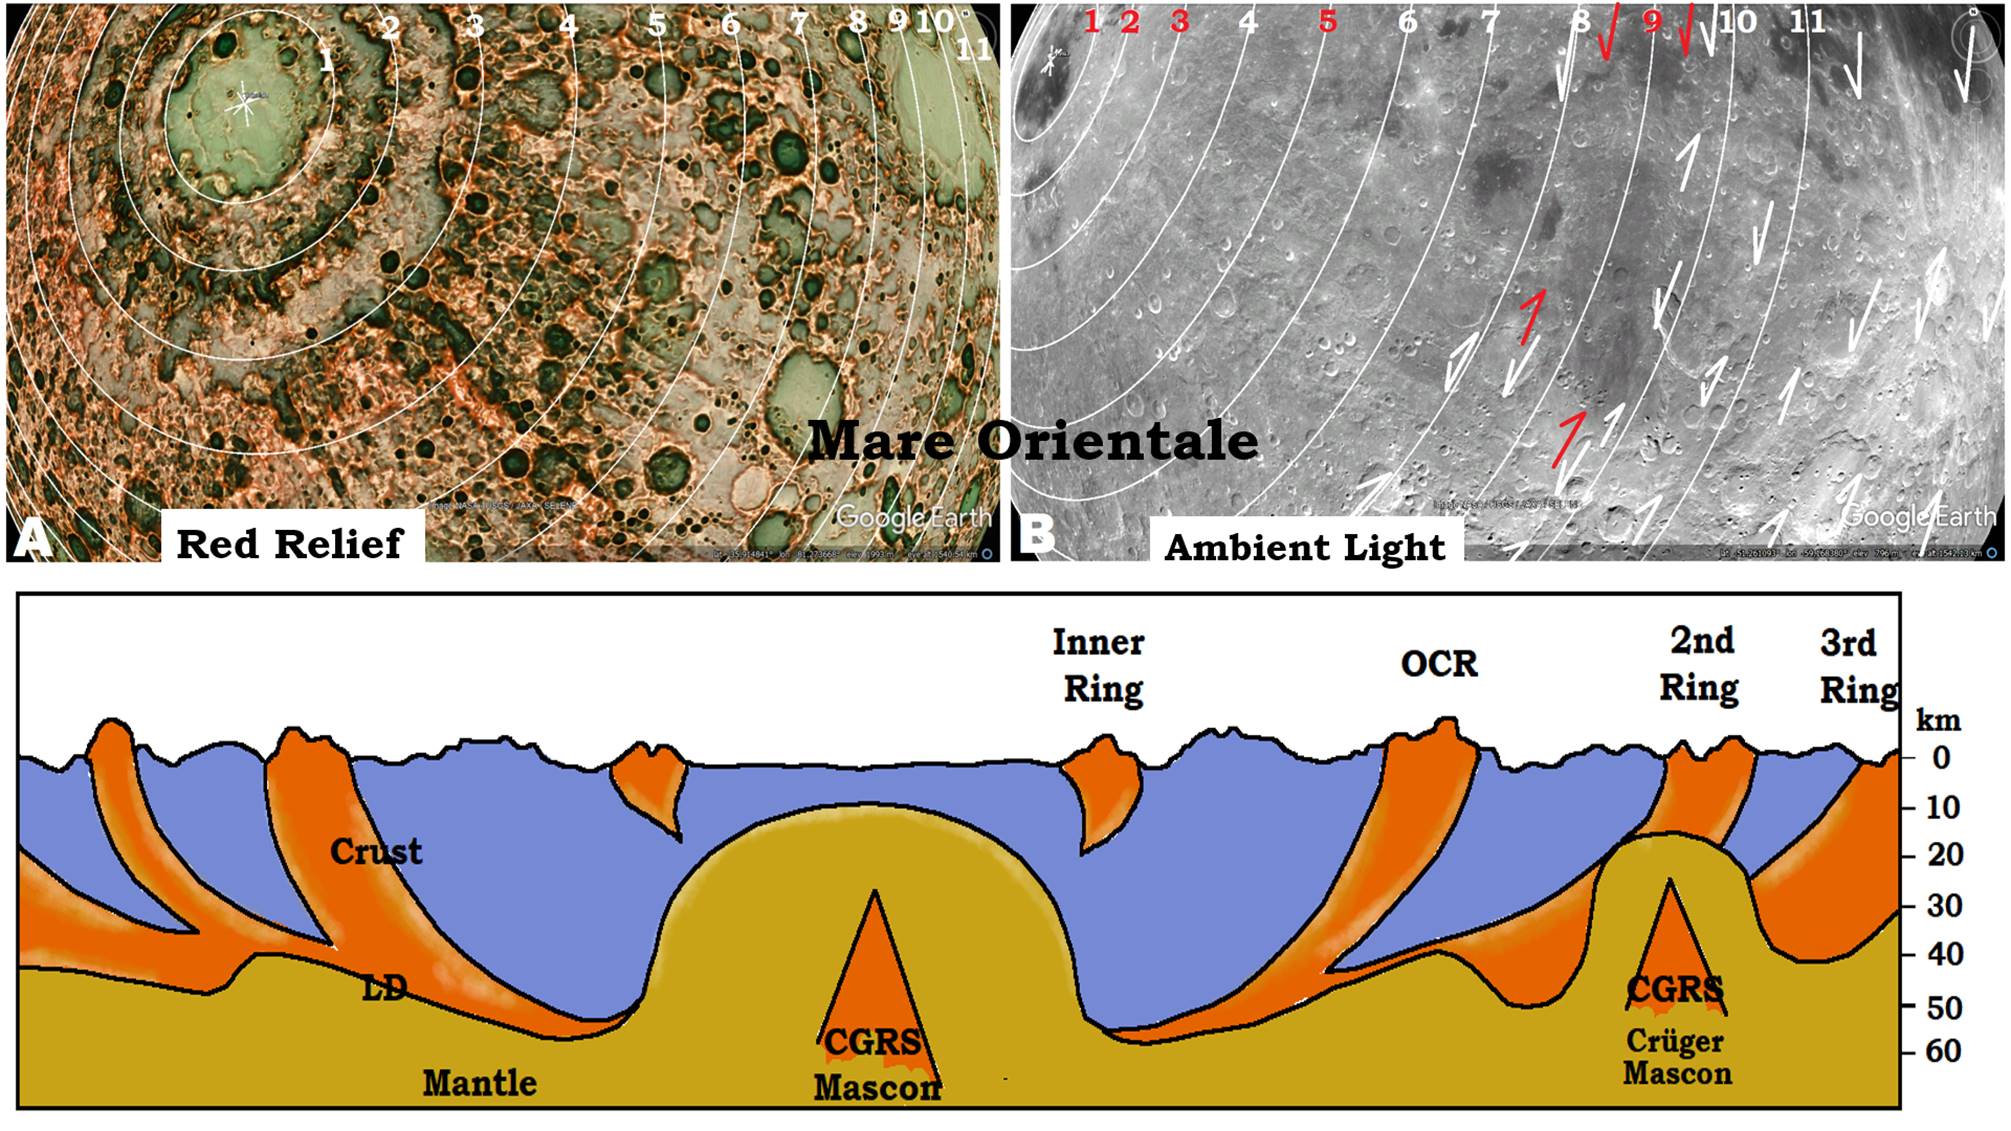 Figure 13: Moving on outwards, using Red Relief, which emphasizes changes in topography (JAXA), 11-rings are located and verified with Ambient light. These more distant annulus to the cratering event are referred to as Concentric Global Ring Structures (CGRS). Rings 1, 2, 3 and 5 of Hoffmann were verified, and several concentric linears in between them, and then extending even further out are added. I believe Mare Orientale’s 2-ring (at 930 km diameter), was the (Original Cratering Rim) OCR-ring, and the crater was possibly the last large crater in its area. Maybe this is why it left such a clear record in the topography seen with ambient light. The cross section of Mare Orientale is the most detailed I could draw with this information. Chapters 8, 9, 10A, and 12 give much more information how I developed these cross sections. Scale on the right represents the depths. Regrettably, I have better information on lunar craters, so I cannot provide nearly this clear a picture of earth craters, until we look at some smaller structures (Uncompahgre crater, ~460 km diameter OCR-ring [Original crater rim]).
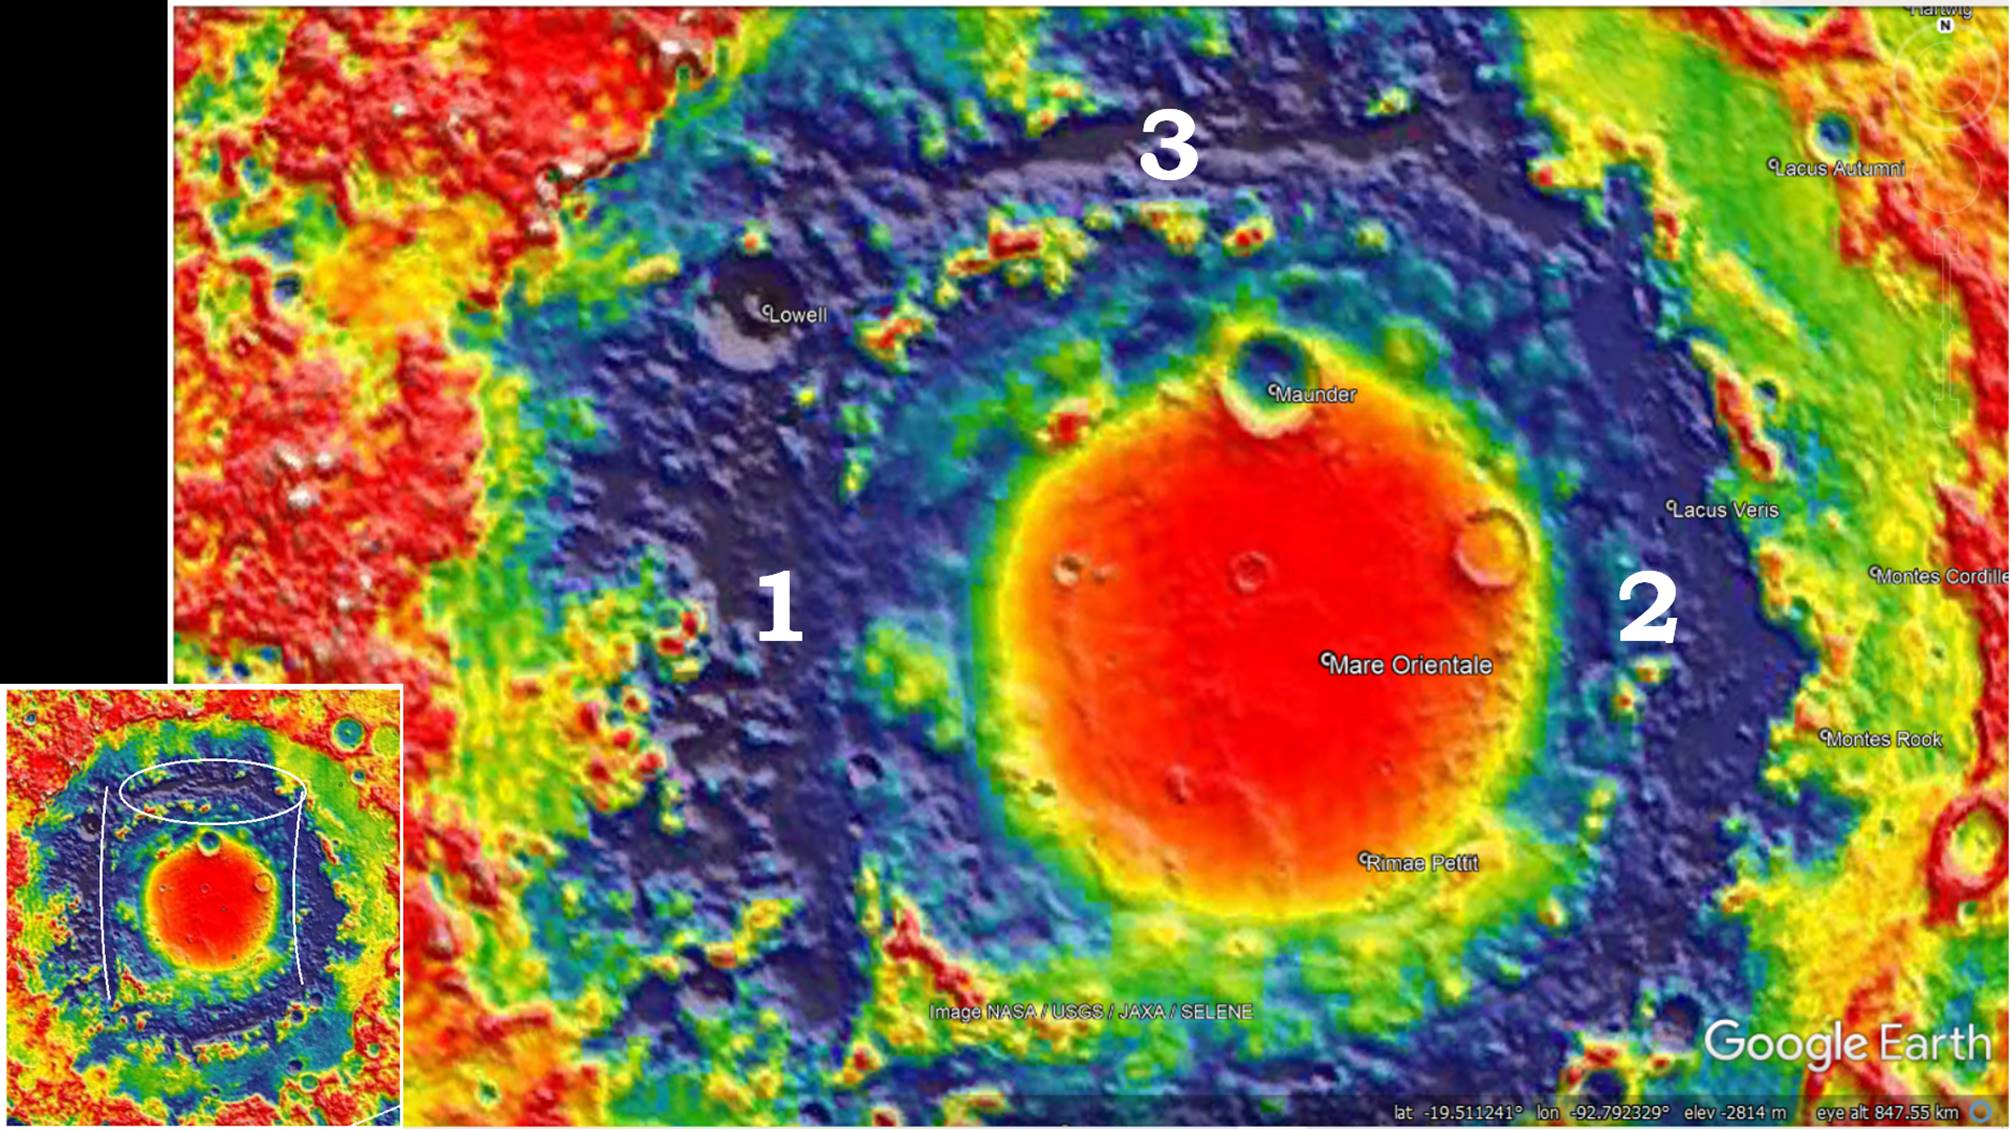 Figure 14: Looking closely back at Mare Orientale’s blue/low gravity center, outside the Mascon we see 3 distinct blue linears. “1” is the most distinct, but “2” has some green to orange in its center. I will classify both of these slightly arced linears as Release-Valleys similar to the Unaweep Release-wave Valley of Colorado (Chapter 1). Linear 3 is also a release valley, and its wiggly line reminds me of the Grand Canyon when viewed in Gravity map. This has been a rapid review of the cratering process and how to read gravity maps, but before we get to the Grand Canyon we need to cover some more preliminary information about my model.
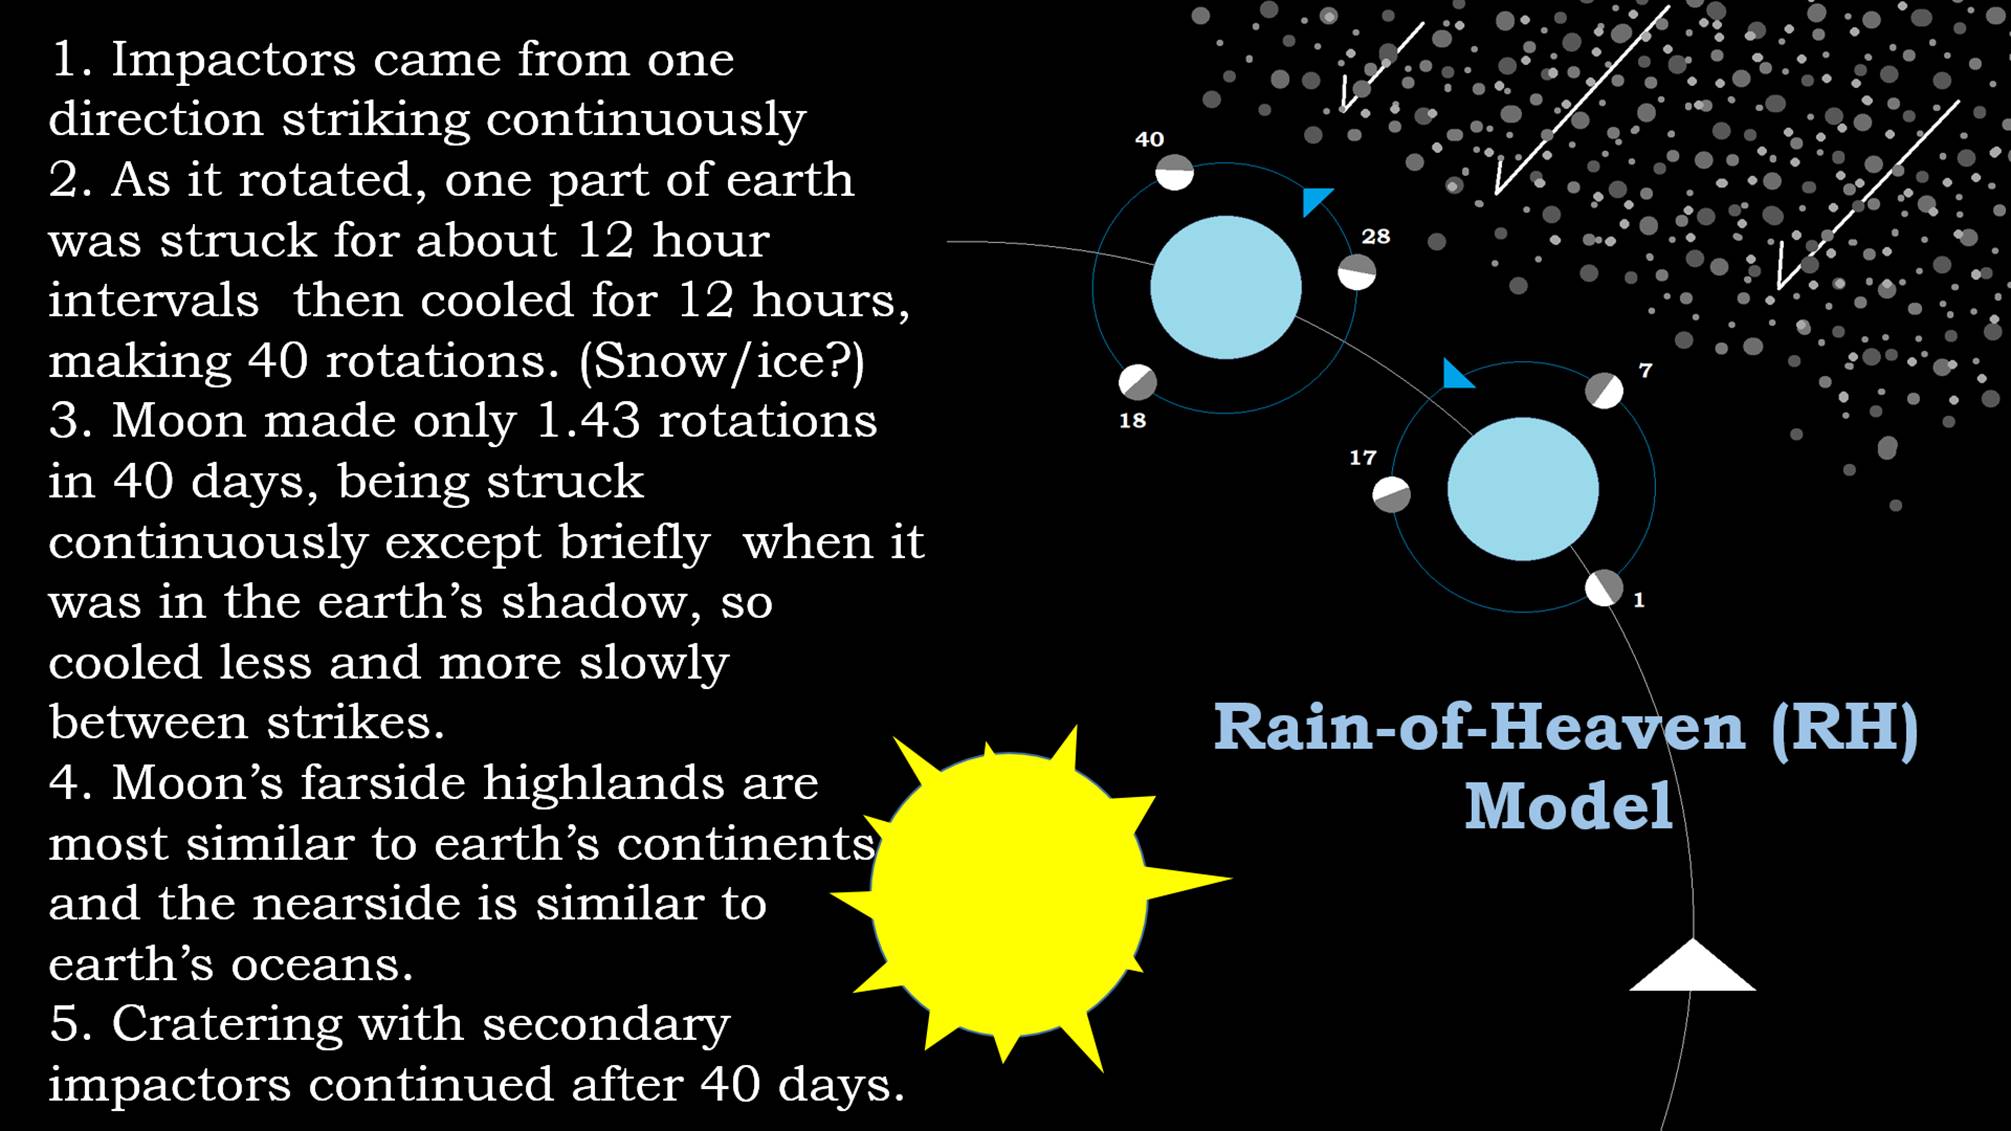 Figure 15: This is the bare-bones, “Cliff Note,” version. I will call it the “Rain-of-Heaven” Cratering Model. It contains only 5 points at present. 1. Impactors came from only one direction striking continuously from when the “Windows of Heaven” were open until they were closed. As I assume these impactors were headed for the sun, this means that all cratering took place at night. If the Taurid Meteor Shower is the remnants of this rain, the Flood likely started in our Fall Months. 2. As it rotated, one part of earth was struck for about 12 hour intervals then cooled for 12 hours. Making 40 rotations, dividing the Flood into 40 distinct intervals of cratering on earth. As the first impactors were some of the largest, possibly much water was blasted into space where it was flash frozen and probably fell as ice during the day partially cooling the substrate. 3. Moon made only 1.43 rotations in 40 days, being struck continuously except briefly when it was in the earth’s shadow, so cooled less and more slowly between strikes (here the light half of the moon represents it nearside, and the gray half represents its farside. Small numbers represent the approximate juxtaposition of the moon’s sides to the earth and to the arriving impactors on that day’s number.) 4. Moon’s farside highlands are most similar to earth’s continents and the nearside is similar to earth’s oceans. Therefore, continents are determined by the amount of cratering in that location. More craters = continents, less craters = oceans. 5. Cratering with secondary impactors continued after 40 days, finally ending about Abraham’s time frame with Sodom and Gomorrah. Possibly allowing for some significant post-Flood catastrophism.
 Figure 16: If the moon’s bombardment started in the vicinity of Mare Orientale, made a full 1.43 rotations; it would rotate through the highlands, across the front side lowlands and then back through the highlands. If this concentration of impactors for a second time in the same area resulted in a greater percent of alkaline magmas, this would correlate with returning over the same crust results in bringing more alkaline material towards the surface where it can be accessed by the cratering process. Such a concentration of alkaline material will account for earth’s continents as well, not basalt vs granite which is usually cited.
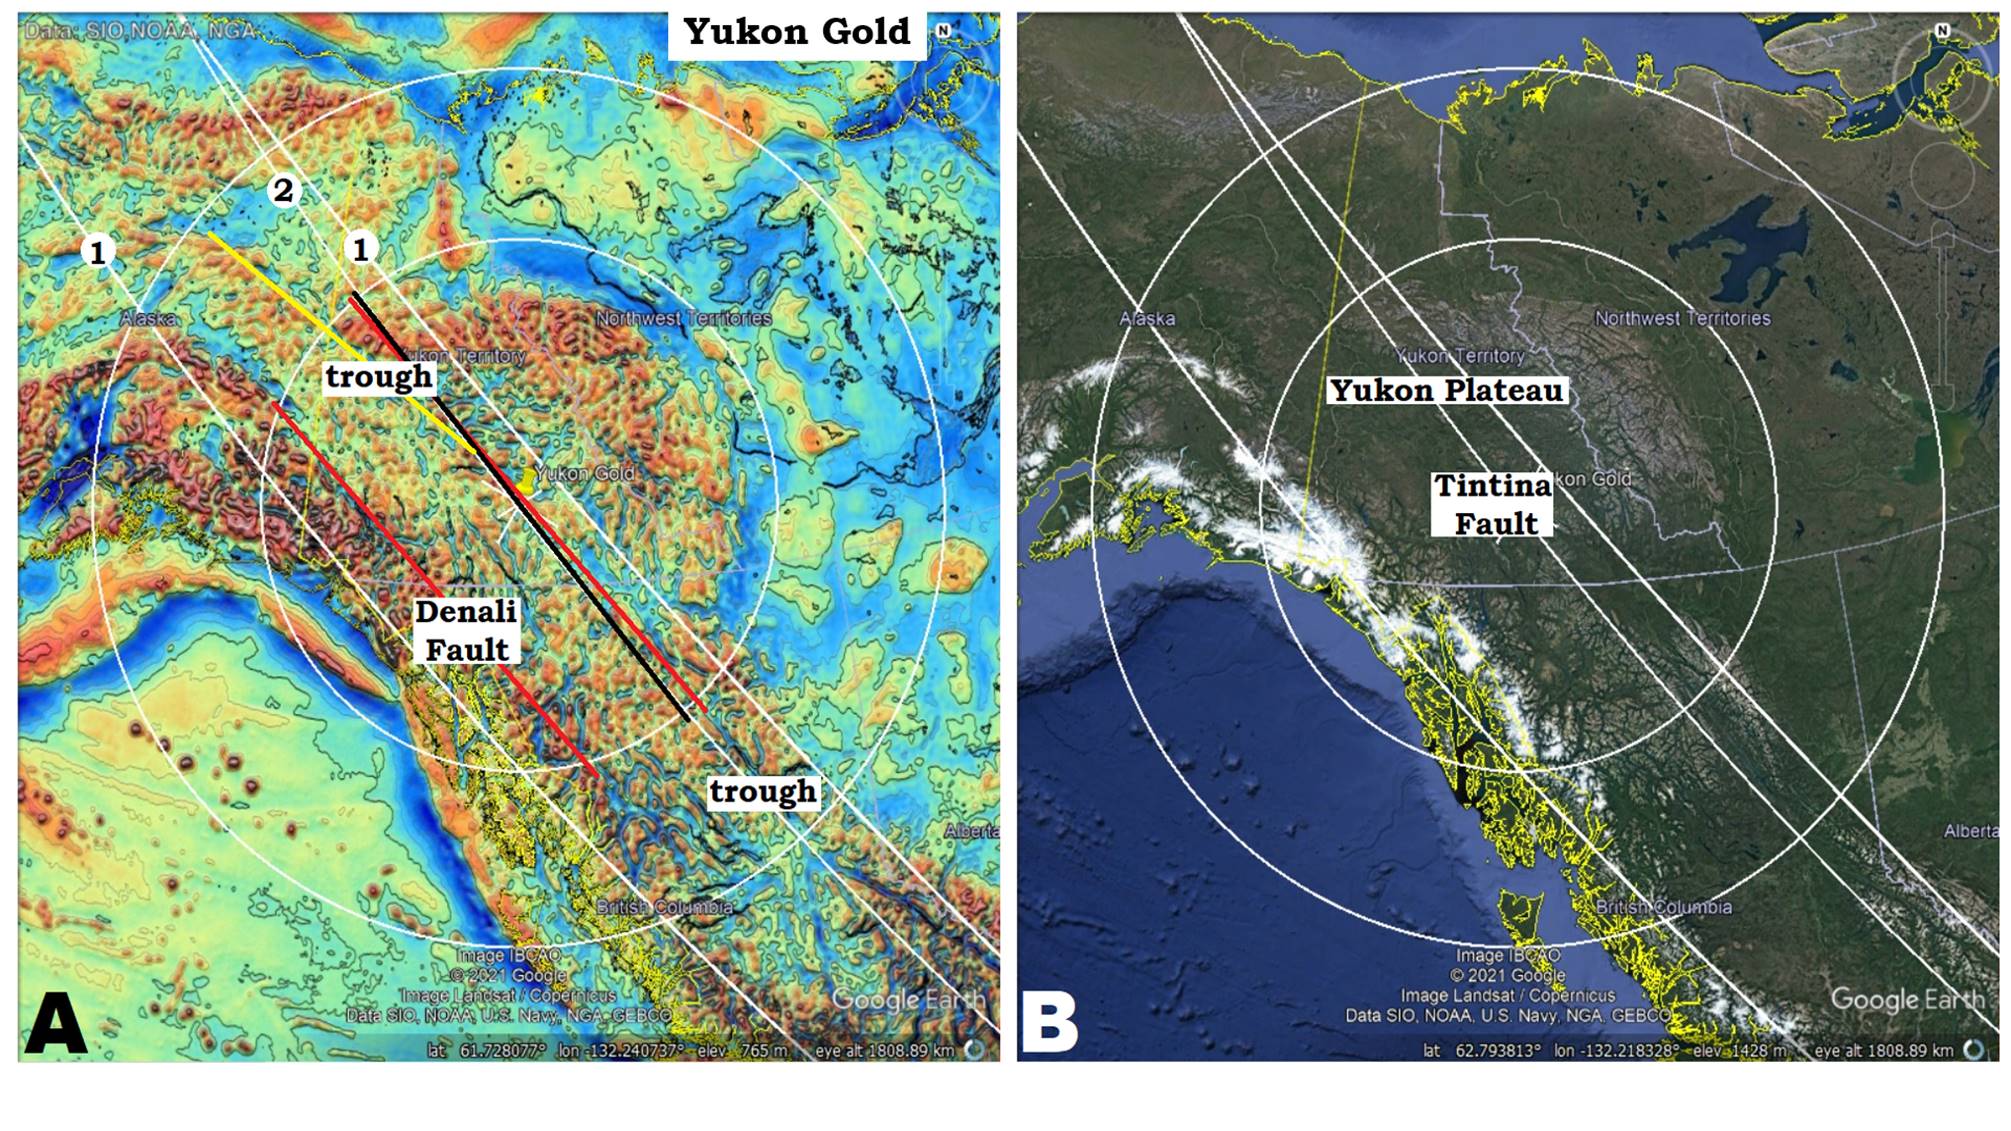 Figure 17: This is a gravity map of the earth. In this presentation I will usually pair it with a Google Earth Landsat image so that you can relate the gravity map to familiar mapped locations. If you are going to work in cratering, you will have to learn to recognize the important landmarks while in gravity maps. The Yukon Gold crater anchors the northern end of the Sevier Orogeny. It extends from Alaska to British Columbian, and includes most of the Yukon Territory inside its inner ring. You can see the thin white circle outside of the obvious blue half ring. If this was ripples in a pond, you would have no problems recognizing the ripple pattern from this much information. The Yukon Gold crater is recognized for it “energy envelope” (alternating high and low gravity) seen in the gravity map. The slightly arced linears are distant CGRS/annulus from (1) the Tasman Sea crater and (2) the Azores crater, The Azores crater caused the Tintina Fault, and the Tasman crater caused this portion of the Denali Fault.
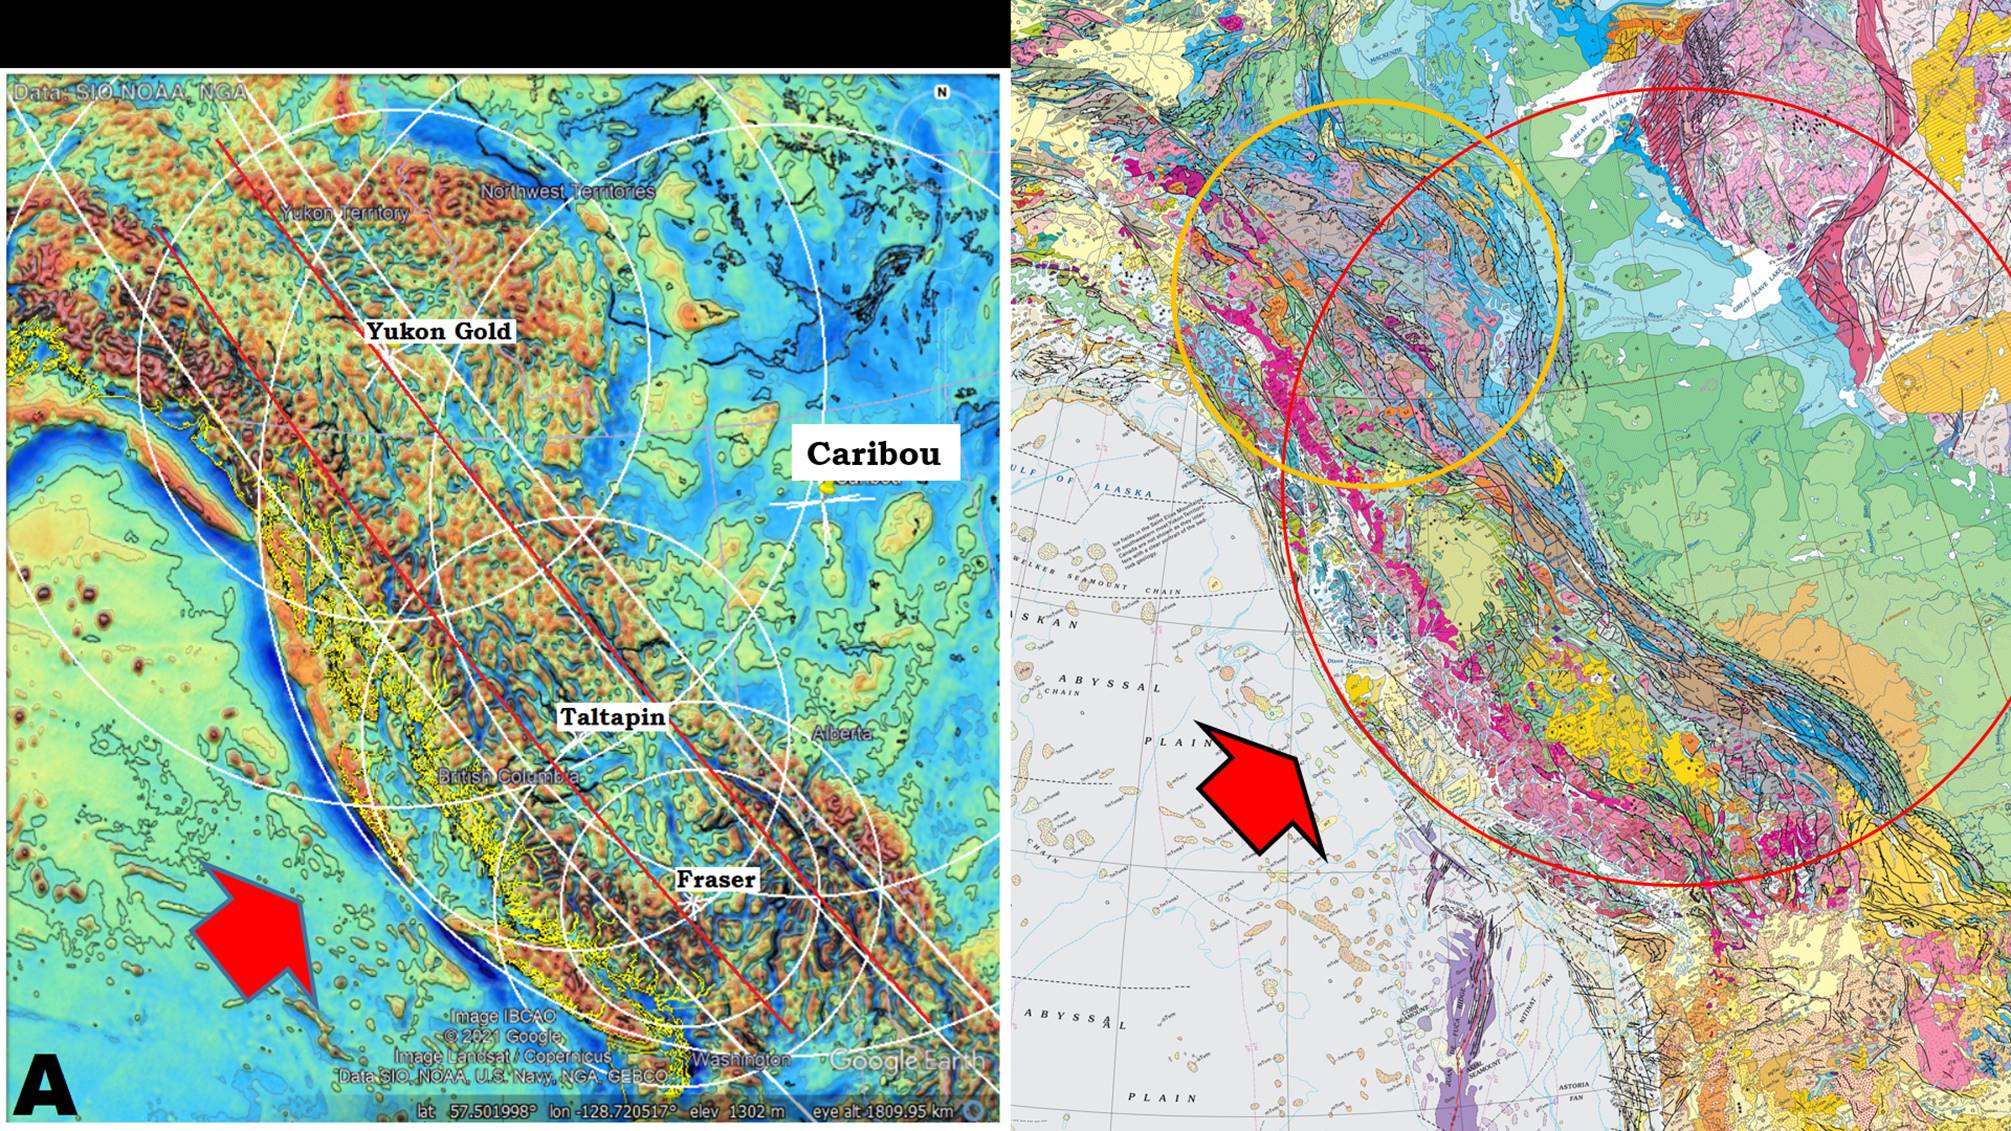 Figure 18: Now that you have seen the Yukon Gold, can you see the much larger Caribou crater? It is most obvious with its projection off of the continent into the Pacific Ocean. The Taltapin and Fraser craters are much harder to see, but as you train your eye, they also become visible. Can you see diagonal lines going through the mountains of British Columbia? That is Concentric Global Ring Structures (CGRS) from the Tasman Sea crater. They are also the source of one of the Mid Continental arches touted in some geologist analyses, extending down through Colorado. For this mid-continental arch, the source of shear lies 12,000 km (7,500 miles) away. Is it any wonder I will not allow any continental/plate or any other significant movement in the earth’s past. It just doesn’t work. Admittedly, I located the crater before I recognized the linear of the arch. But could this be a coincident that the plate moved into precisely the exact location to fit? By the way, I have located 20-30 of these distant correlations. In my book I document at least 8 covering the entire State of California. Is it a coincidence that the Yukon Gold and Caribou crater rings are reflected in surface geology in the right-hand map? I think not. Cratering not only determined the topography but also the lithologic makeup of the topography.
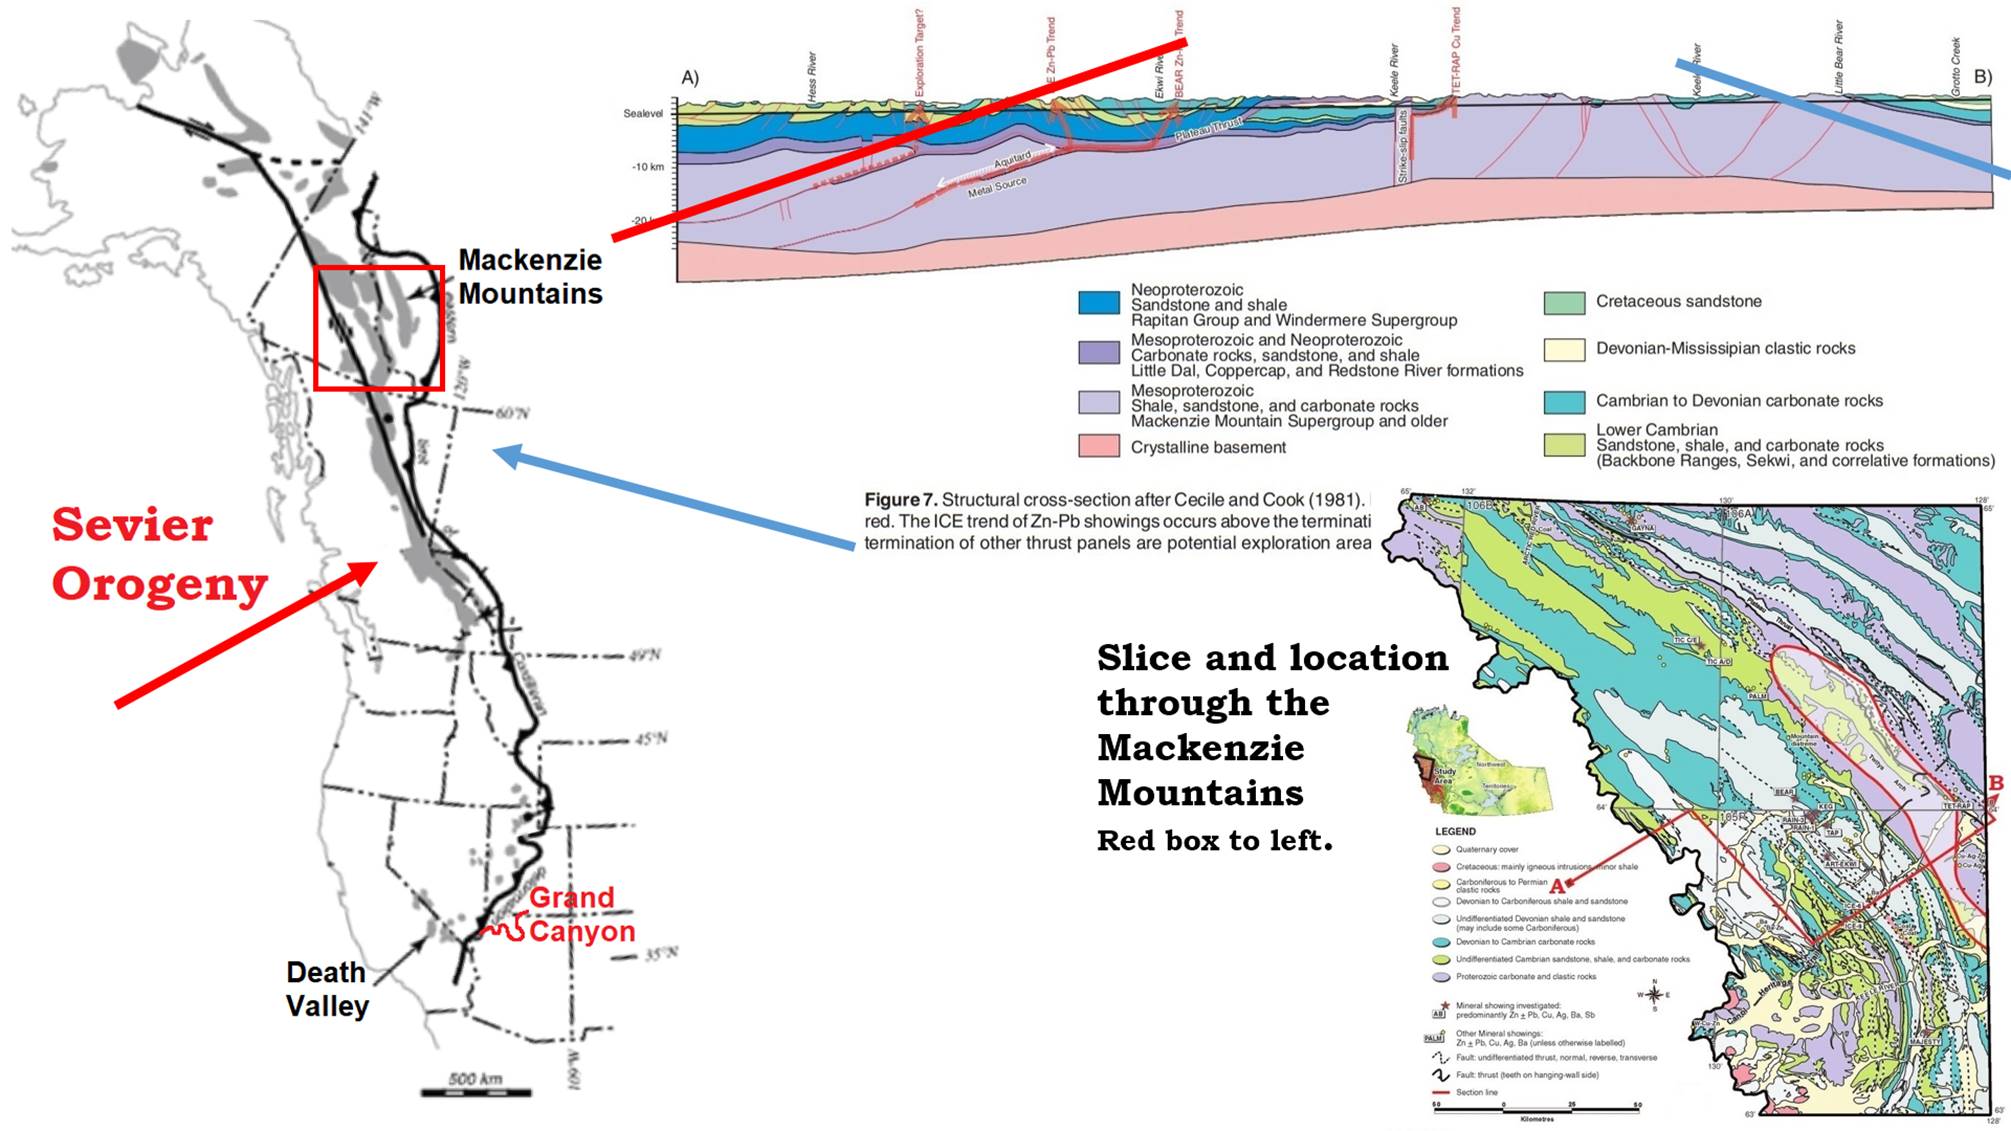 Figure 19: These lines and arcs in Plate Tectonics are referred to the Sevier Orogeny (fancy word for “mountain building”). The red arrow shows direction of thrust (the direction from the Tasman Sea to here), but the blue arrow shows another direction of thrust that runs near the Tasman line, It is only slightly different but it was real fun solving the small conundrum it caused. That source of shear/thrust from the east is the Azores crater. Yes, originating off of the coast of Spain, only 7,200 km (4500 miles) from where it shows up. I wish I could spend all of my time explaining the direction and special relationships in the Mackenzie Mountains, but that is an only partly written chapter in my book. But note, at the lower end of the Sevier Orogeny lies the Grand Canyon, and we want to get there.
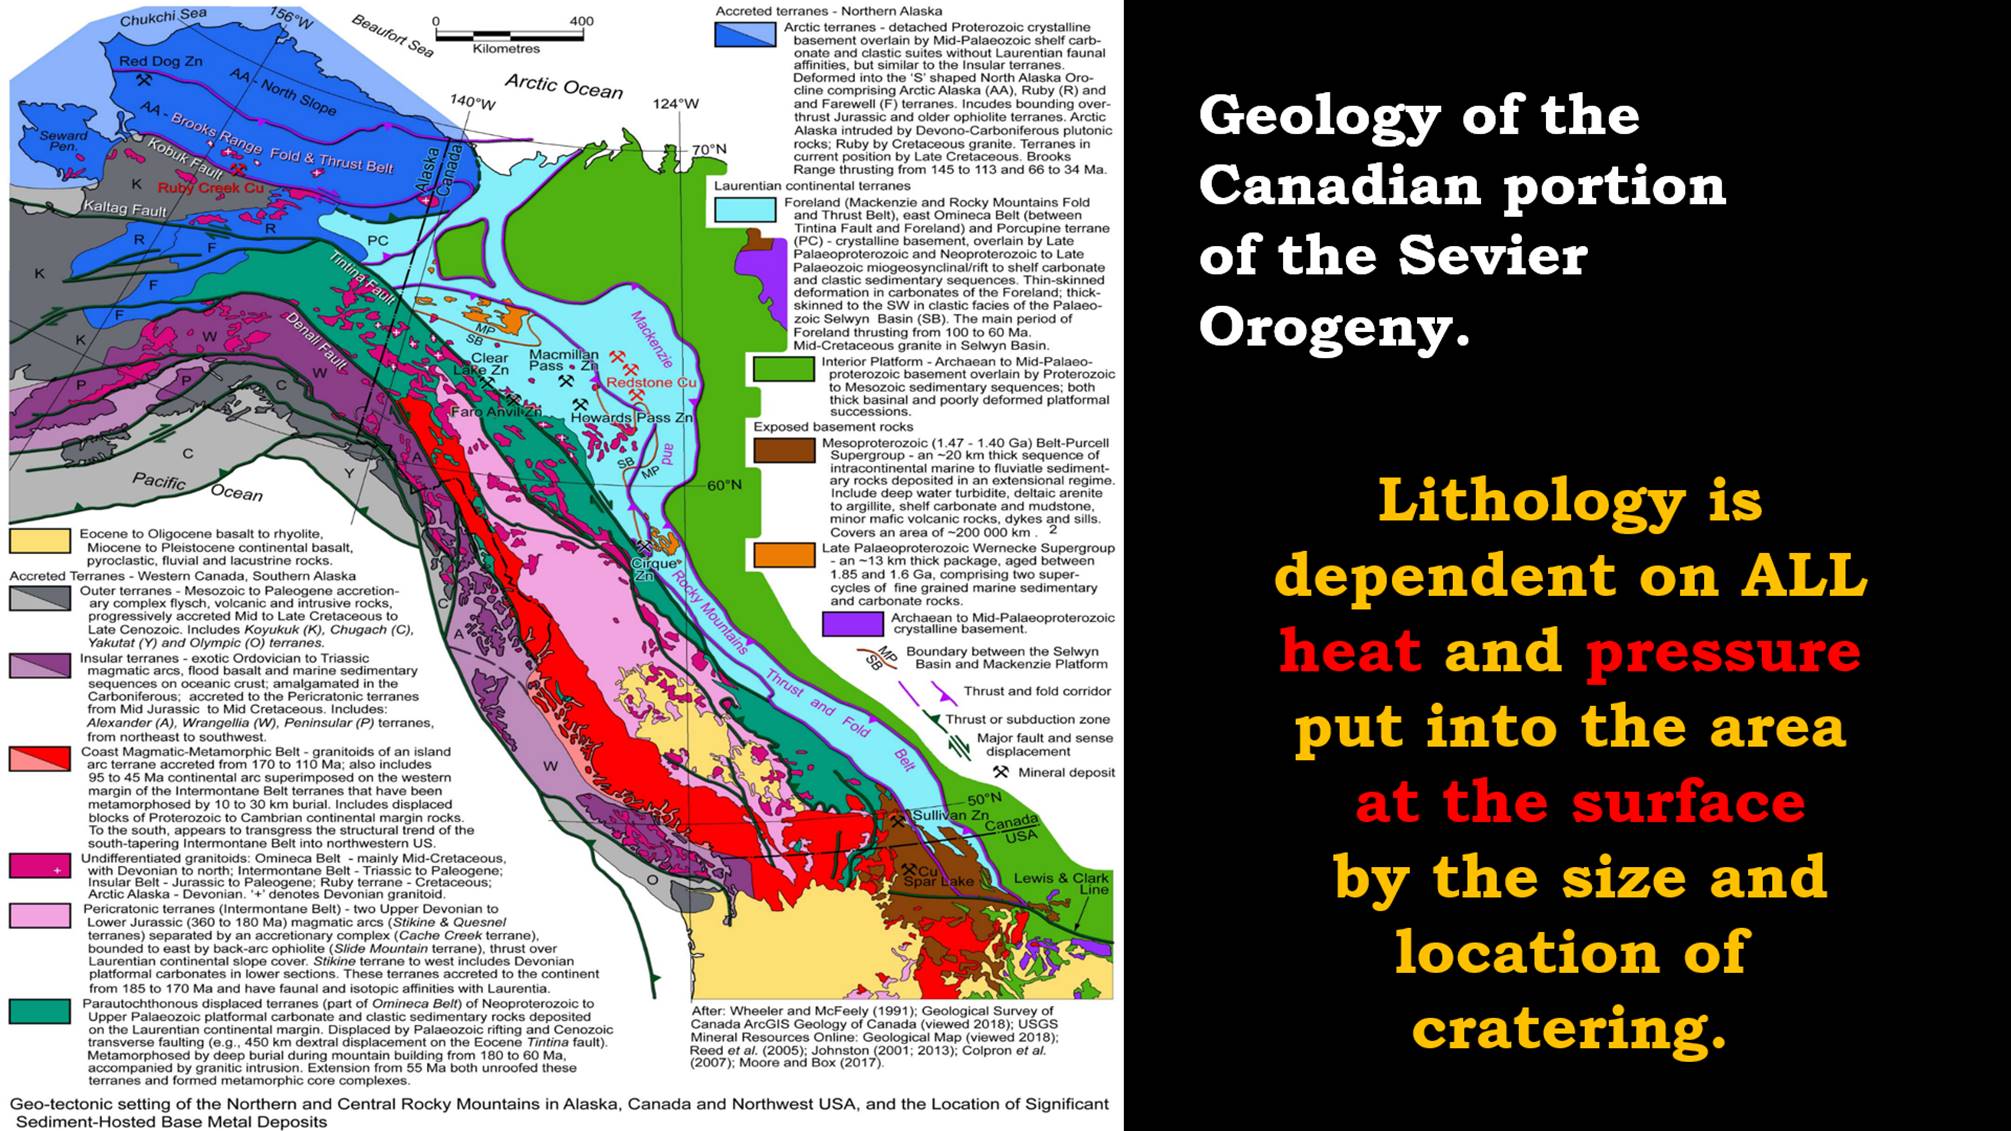 Figure 20: This is a Geology map of the same area of Canada. We can only see partial remnants of the cratering pattern. That is because the craters and lines work together to form much of the lithology. Events that occur together have results that reflect ALL of the involved sources of shear. Also, the heat and pressure that were already put into that patch of ground by large, previous crater. They all work together to bring the chemical composition up from the mantle together and crystallize the specific pattern of minerals found there dependent on heat and pressure. The pressure does not come from deep burial, but cratering on the surface. Carbon is pulled up in one place and turned to carbonate rock and in another place formed into kerogen, bitumen, and petroleum based compounds. The chemistry all depend on the available heat and pressure, the final energy envelope expression in the specific area.
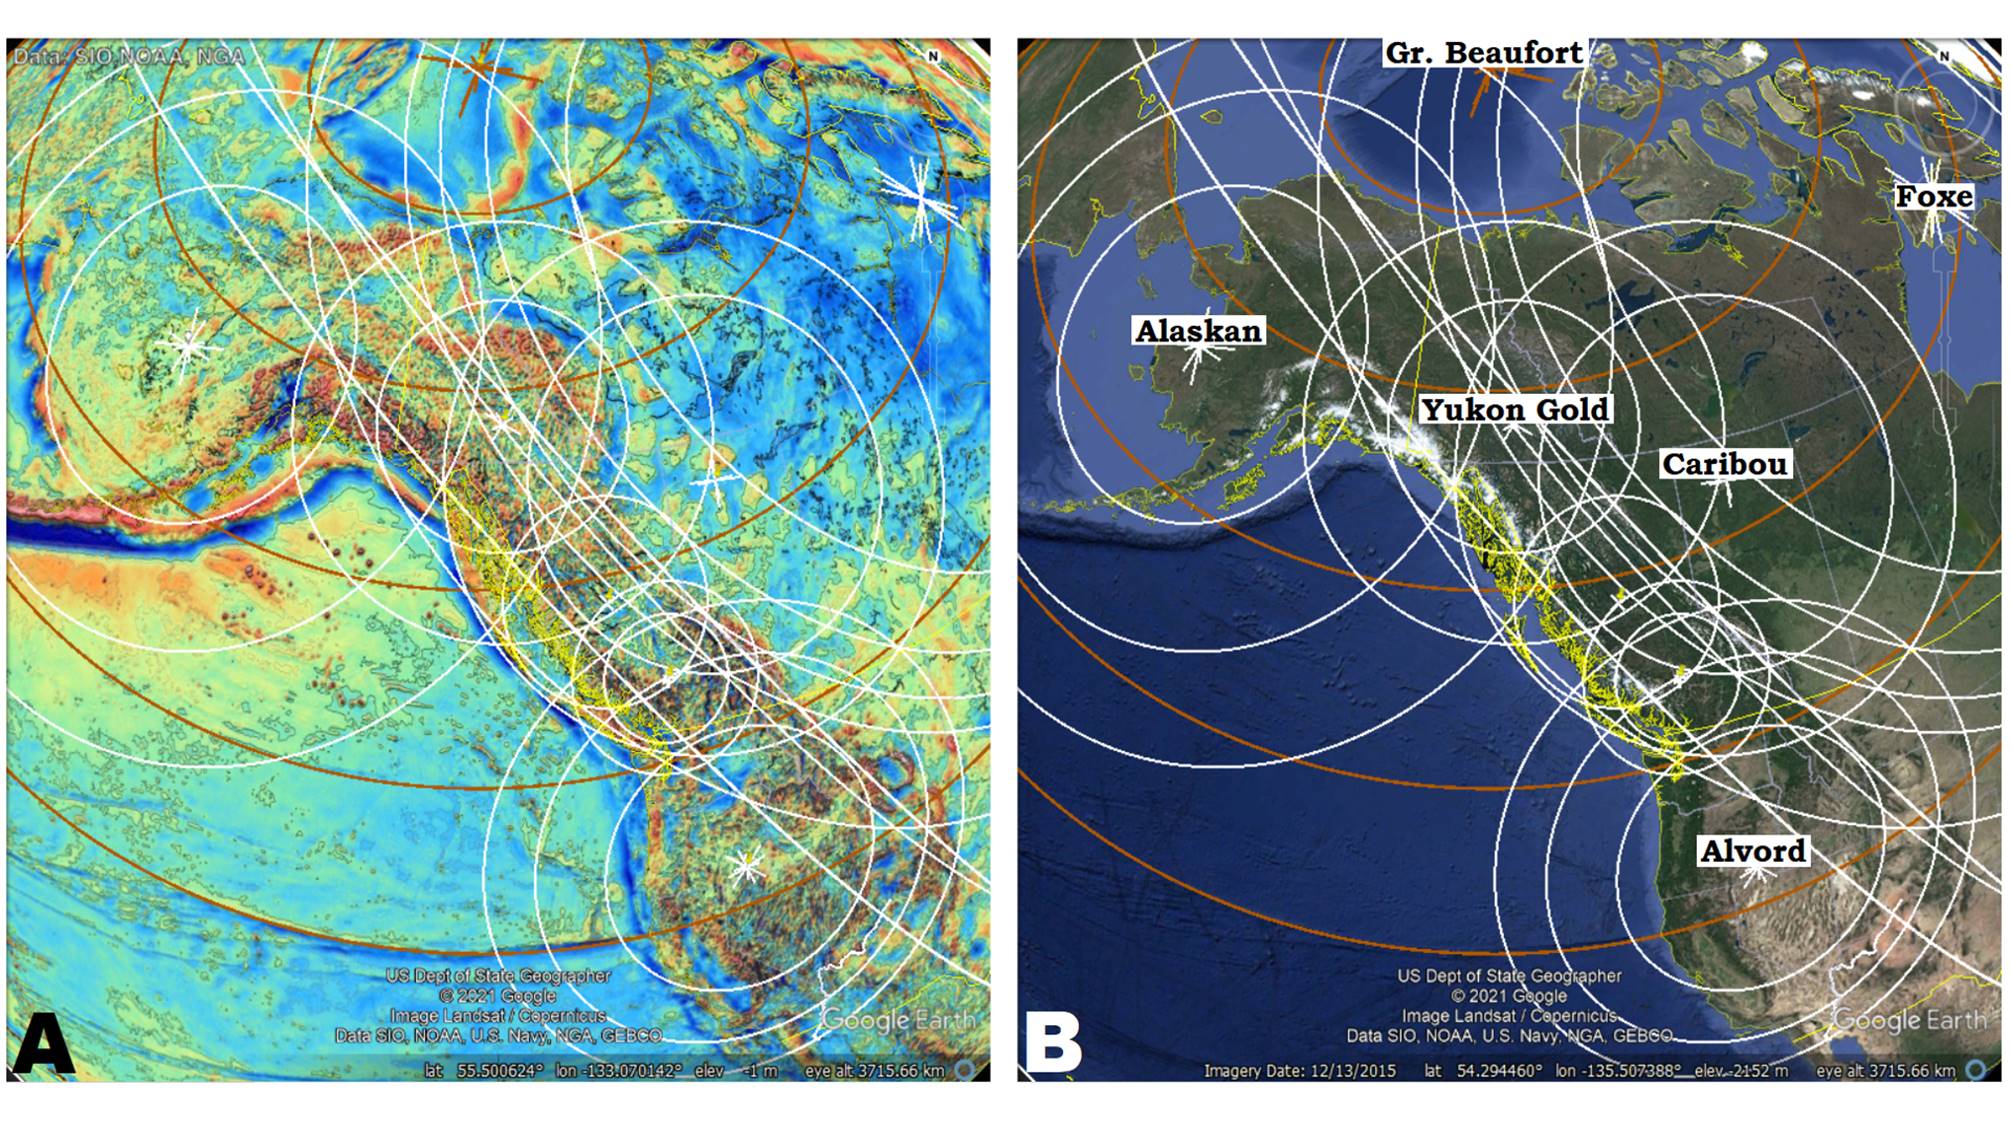 Figure 21: Ok, we got that much figured out, but don’t get too smug. Here is a slightly larger picture including Alaska to California. The Alaskan crater makes a HUGE impression on the northern end, and the Alvord makes a pretty big one on the south end. But the Greater Beaufort and Foxe made additional contribution. The Greater Beaufort was a bit later than the Foxe and opened up some of its concentric fractures to spew the Franklin Large Igneous Province out over much of Northern Canada. Yes, volcanics are a direct result of cratering. Can I expect you to understand all of these cratering circles? If you take only one thing from this, I hope that you will take a mental image of the globe covered with all of these circles. Circles that have their source in points of shear pressure caused by astral-impactors that created the craters that formed the lithology and shaped the topography. These circles are associated with all of the geology we know, and the more we study them the more we can explain the geology.
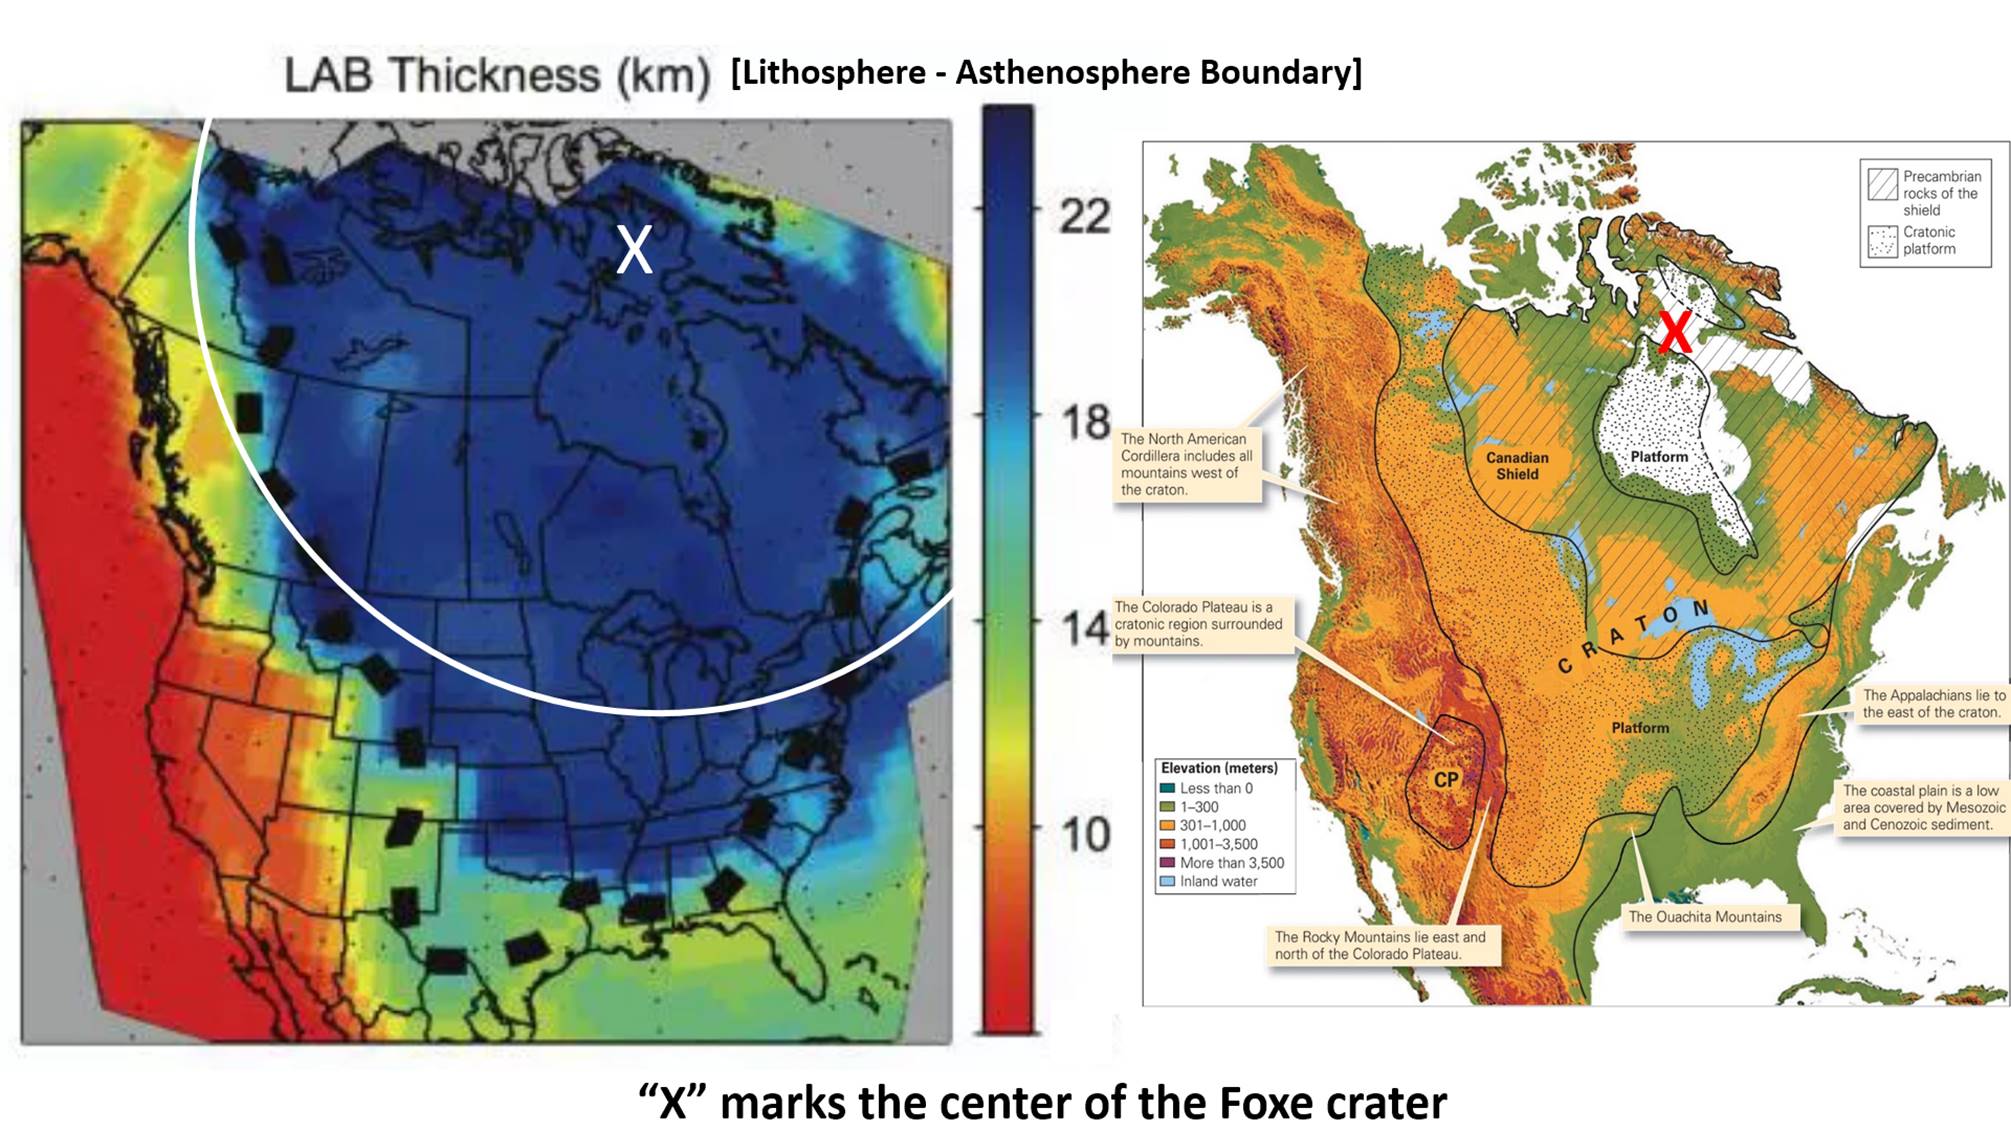 Figure 22: A craton is defined as a large stable piece of deep crystalline rock lithosphere with sedimentary layers on top. The large blue area is certainly the thickest portion of the crust? Could that be a result of the large Foxe crater that compression melted the rocks to great depth? As a result, energy signatures of later craters were simply lost in the massive energy signature of the Foxe crater leaving what I term “ghost crater.” It looks like South Pole-Aiken on the moon. How similar the craton and the deep LAB boundary is to a maps of the Laramide Ice Sheet. When I first saw this spatial relationship and realized cratering produced rock surface scour, large erratic boulders, and piles of small breccia to sand to loess sized particles. The same evidence that is used to support the ideas of glaciers and an Ice Age. Did an Ice Age happen, or are we mistaken in the genesis of the evidence ascribed to them?
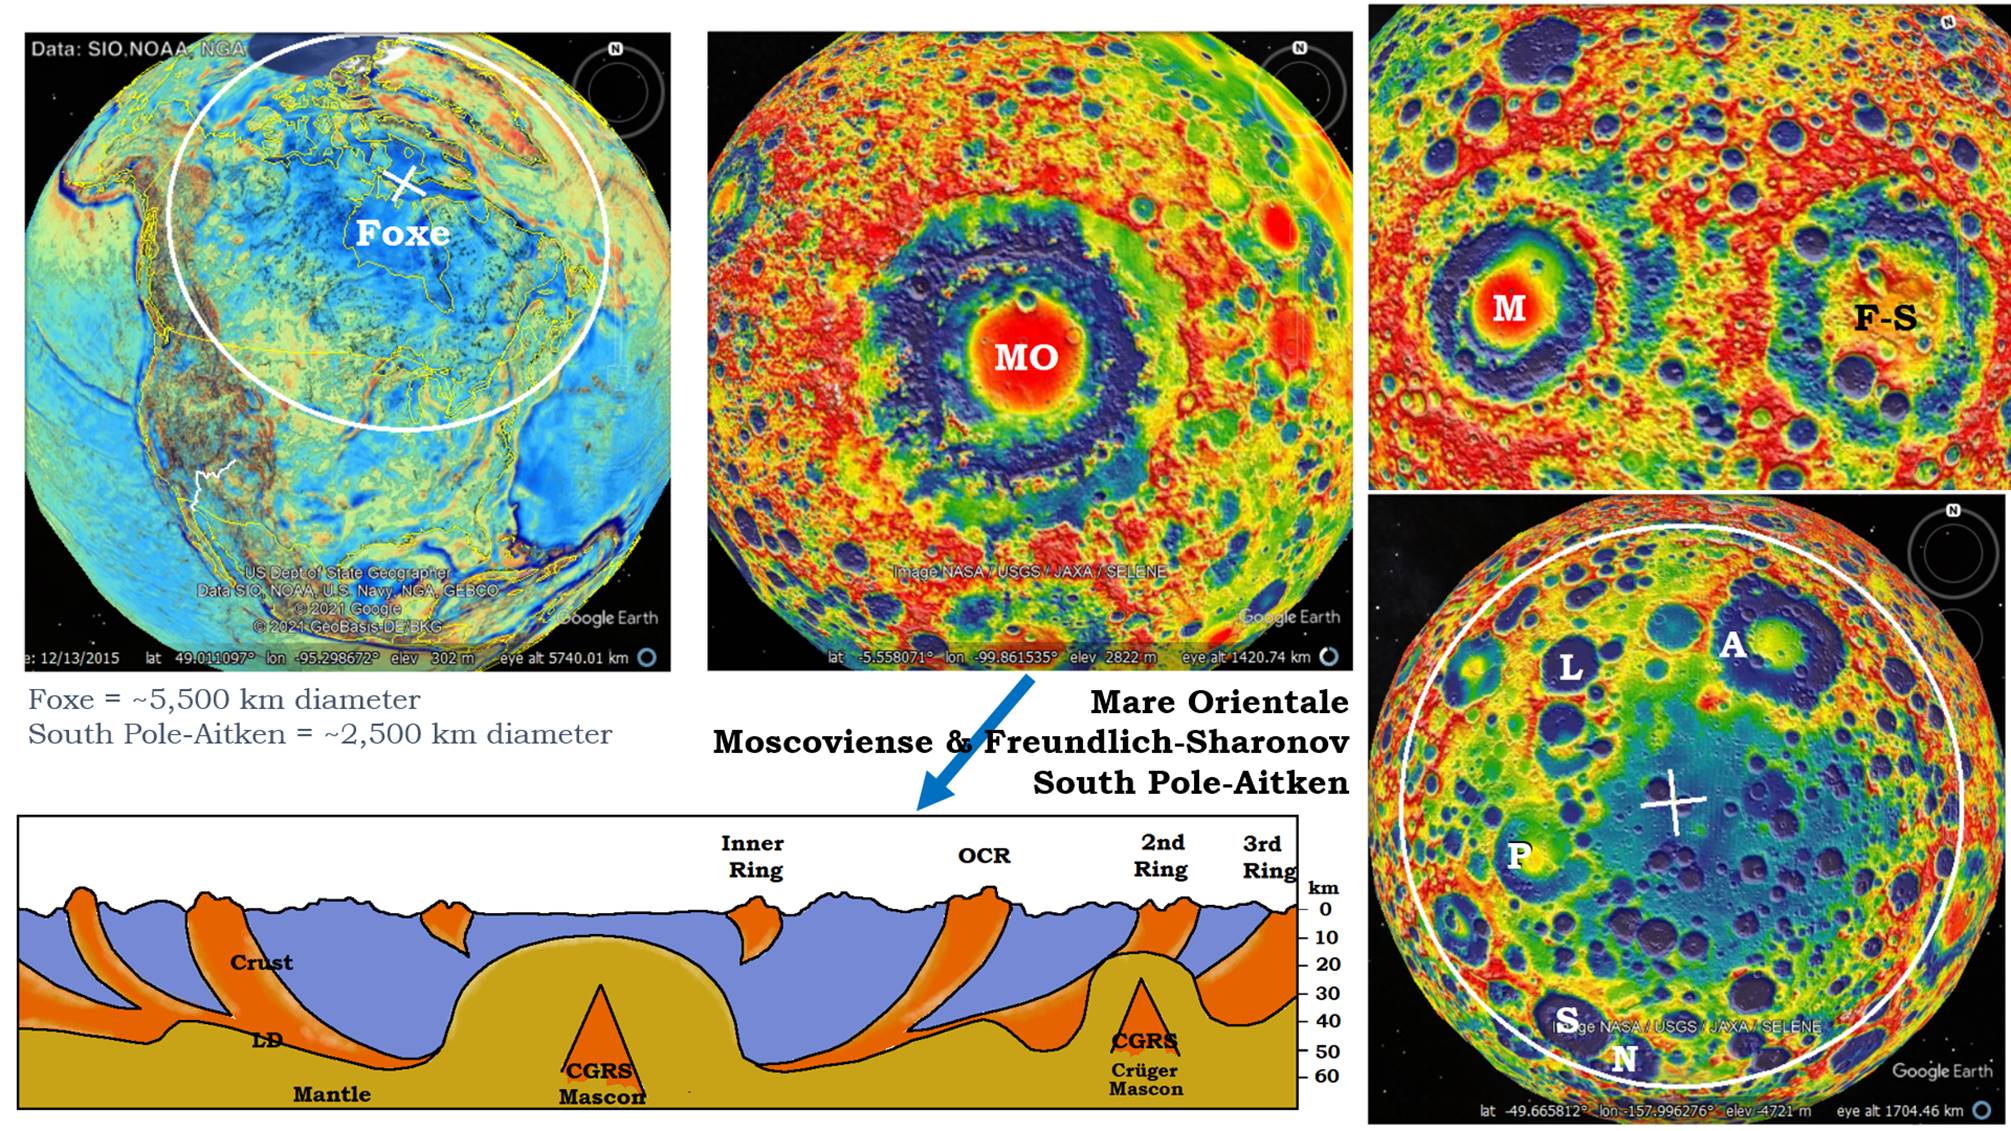 Figure 23: Compare the Foxe crater image with several moon craters. These are all gravity images, so all of them have large blue centers of low gravity, but several of the moon craters have a red mascon in the center of the blue. Since the mascon is a dense up thrust (CGRS) from the mantle originating at a distant shear/cratering center, the craters would have had to form after some other large craters which would produce the CGRS that formed the mascon. South Pole-Aitken, lower right, and the Foxe craters do not have obvious mascons, and I will propose part of the reason is that they were both formed early before other large craters could form CGRS to produce mascons in there centers. There could be other differences as well. We know the South Pole-Aitken is a mantle cored crater, so a mantle up warp is not enough to form a mascon. It has to have an additional up-thrust compressed by the shock wave’s CGRS from another crater.
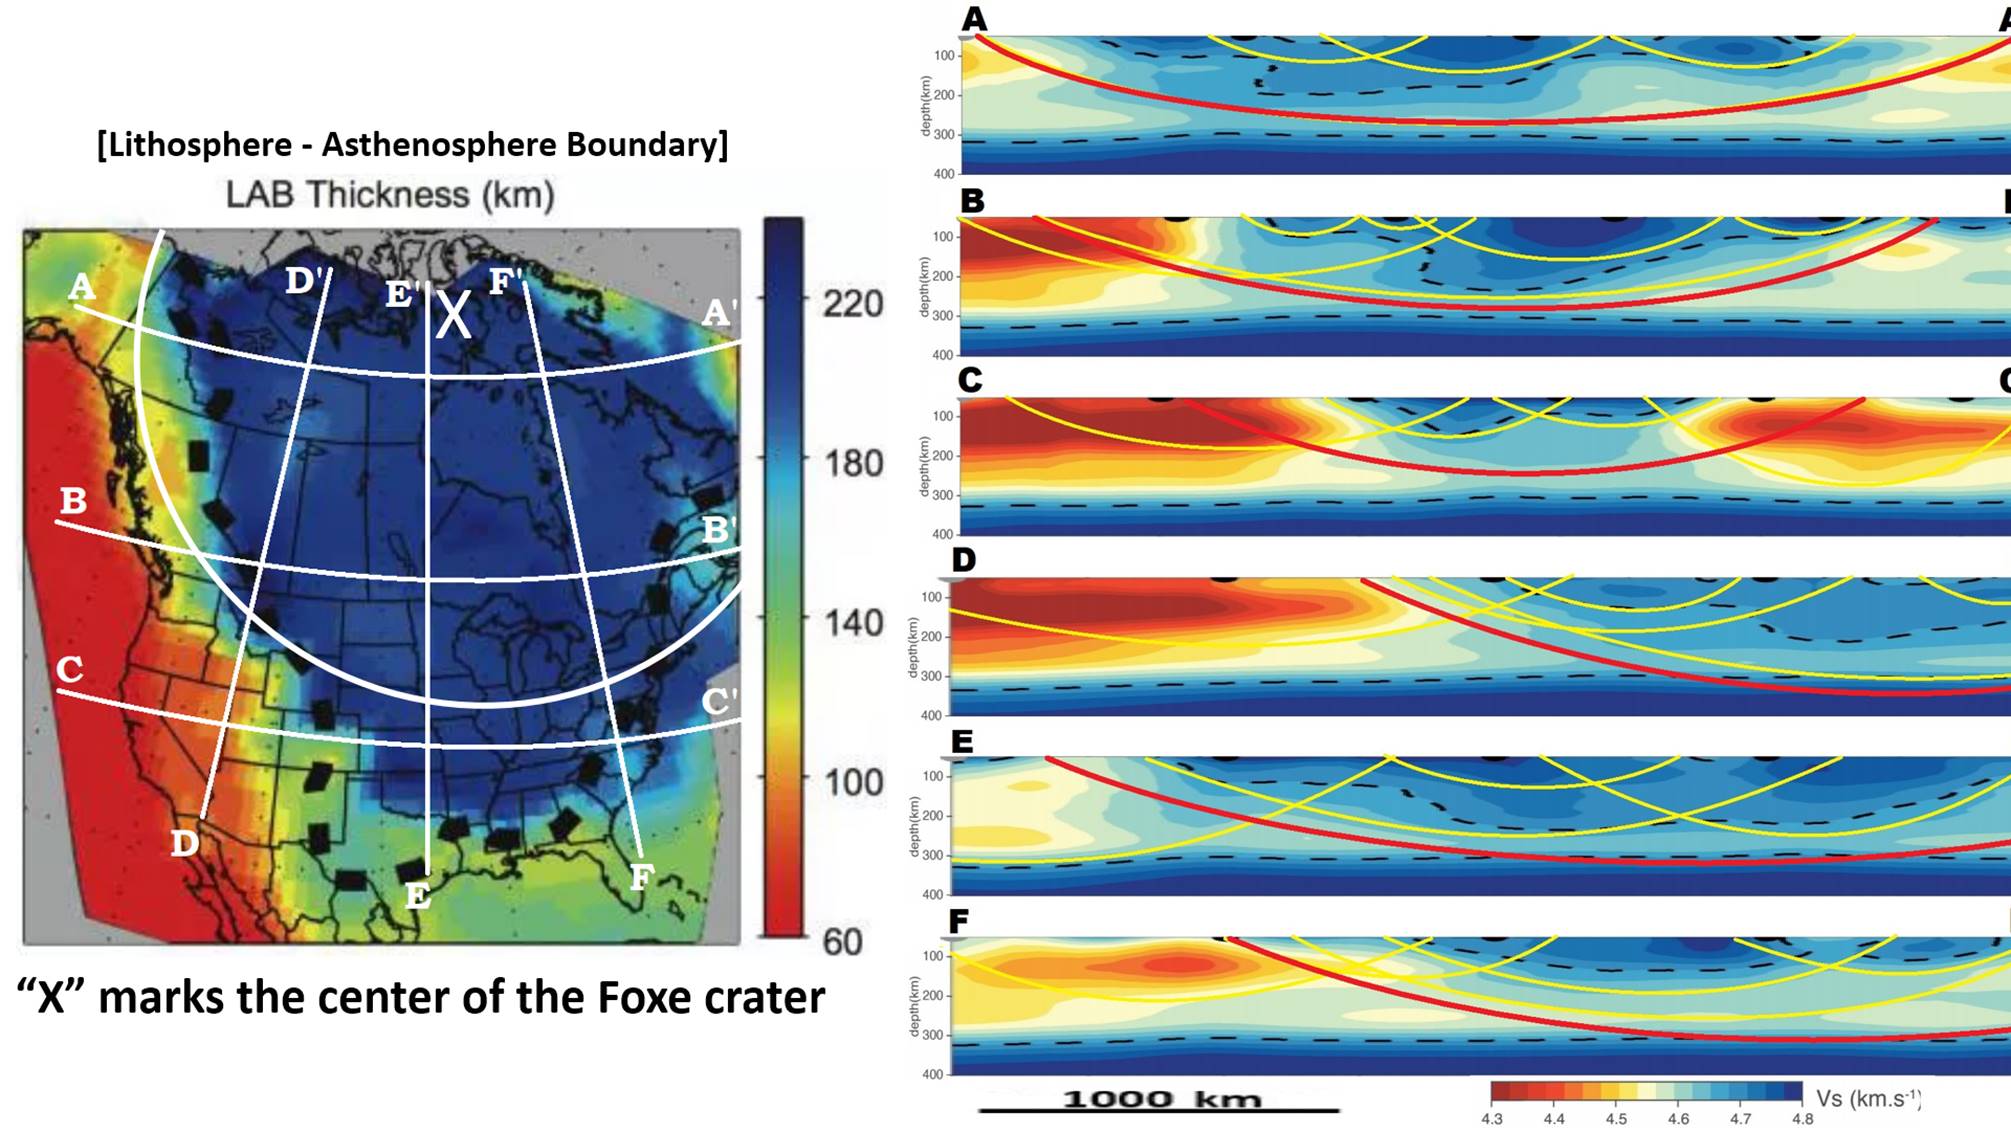 Figure 24: These are six tomographic sections through the North American continent, three west to east and three north to south. The resultant arcs are the proposed pressure energy signature of the bowl depth of craters. I have indicated in yellow some other contained pressure bowls of later and smaller crater. There are alternative interpretations when more detail is seen. Robert Watchorn is one of the few individuals I can locate worldwide that is significantly studying craters.
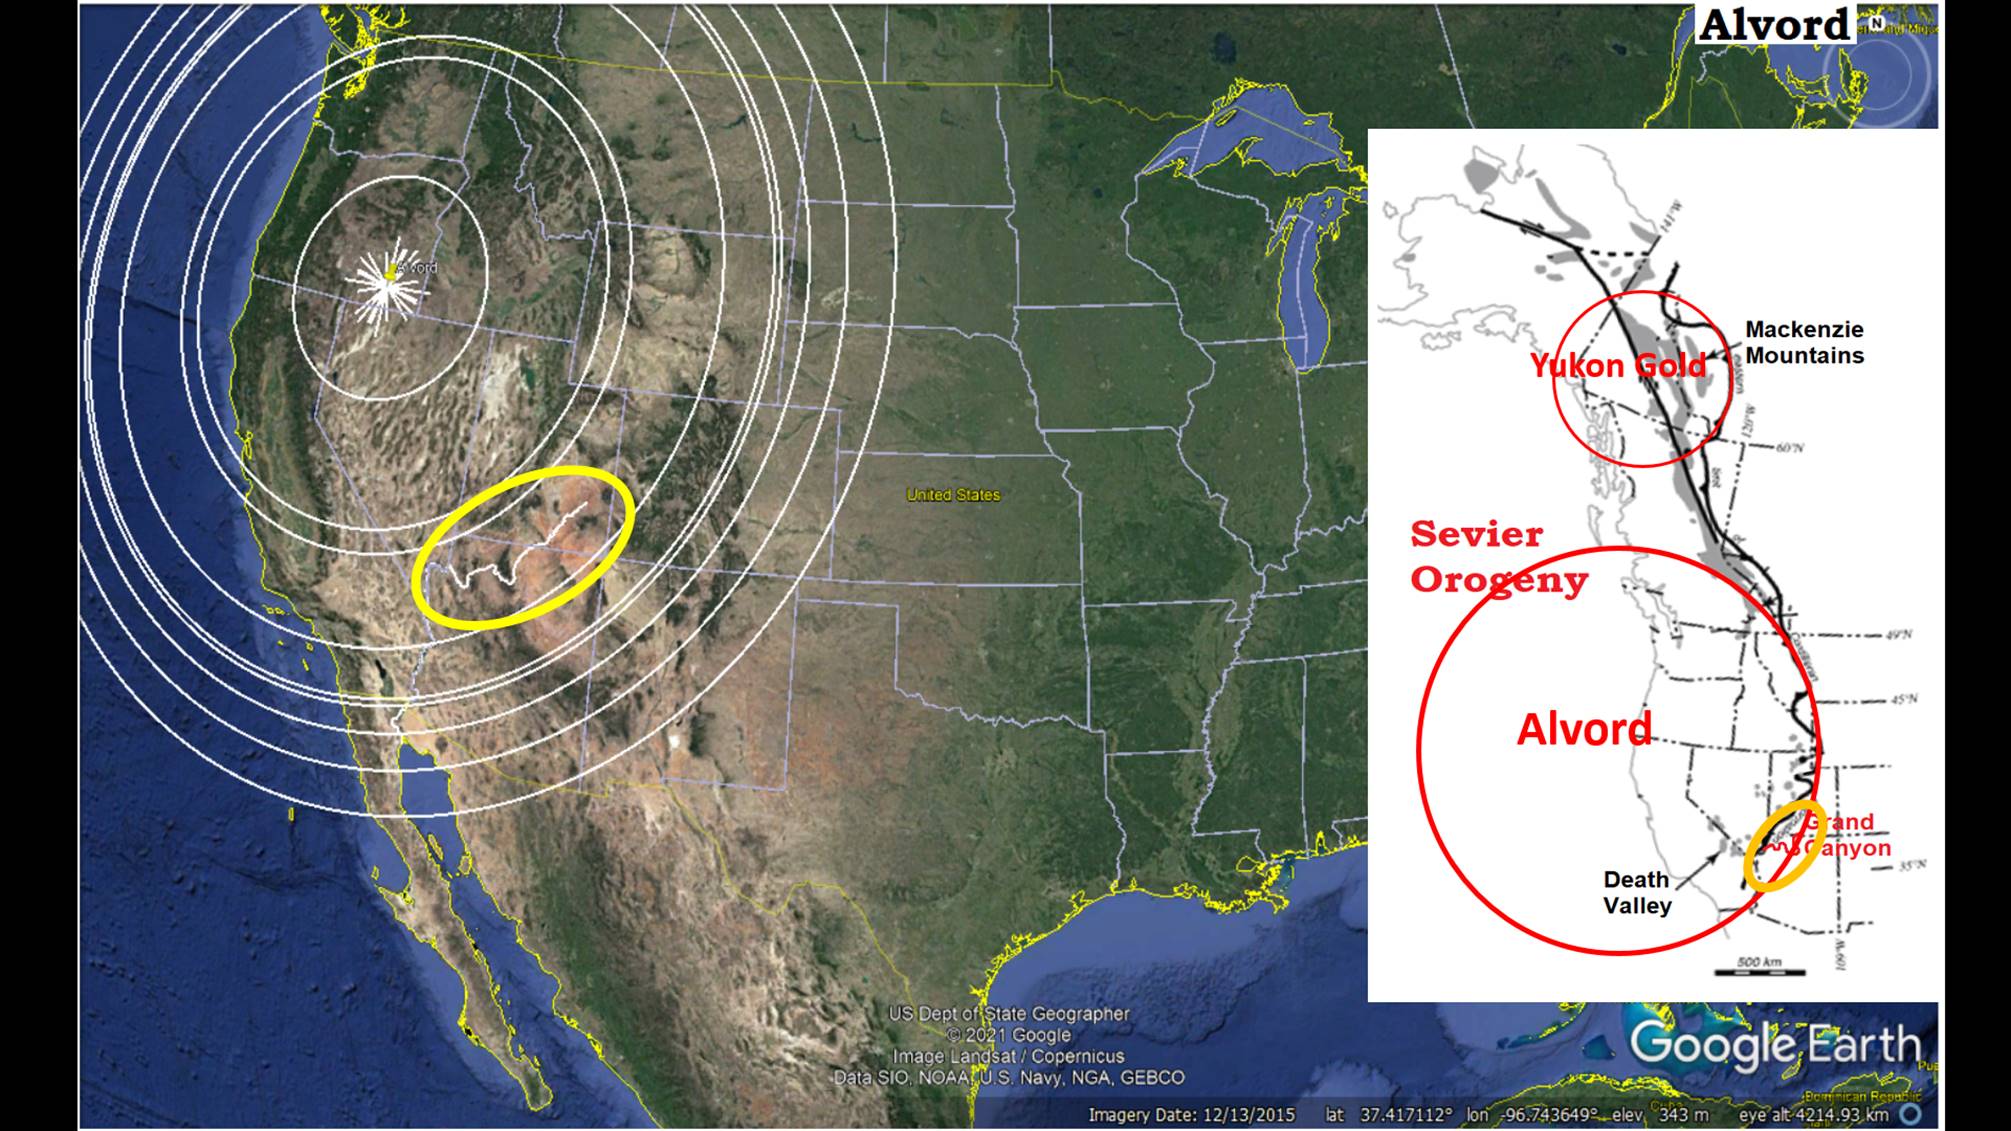 Figure 25: The Alvord crater anchors the south end of the Sevier Orogeny thrust zone like Yukon Gold crater anchors the northern end, connected by the Tasman Sea linears. See the white wiggly line between the 3 and 4-ring? That is the location of the Grand Canyon.
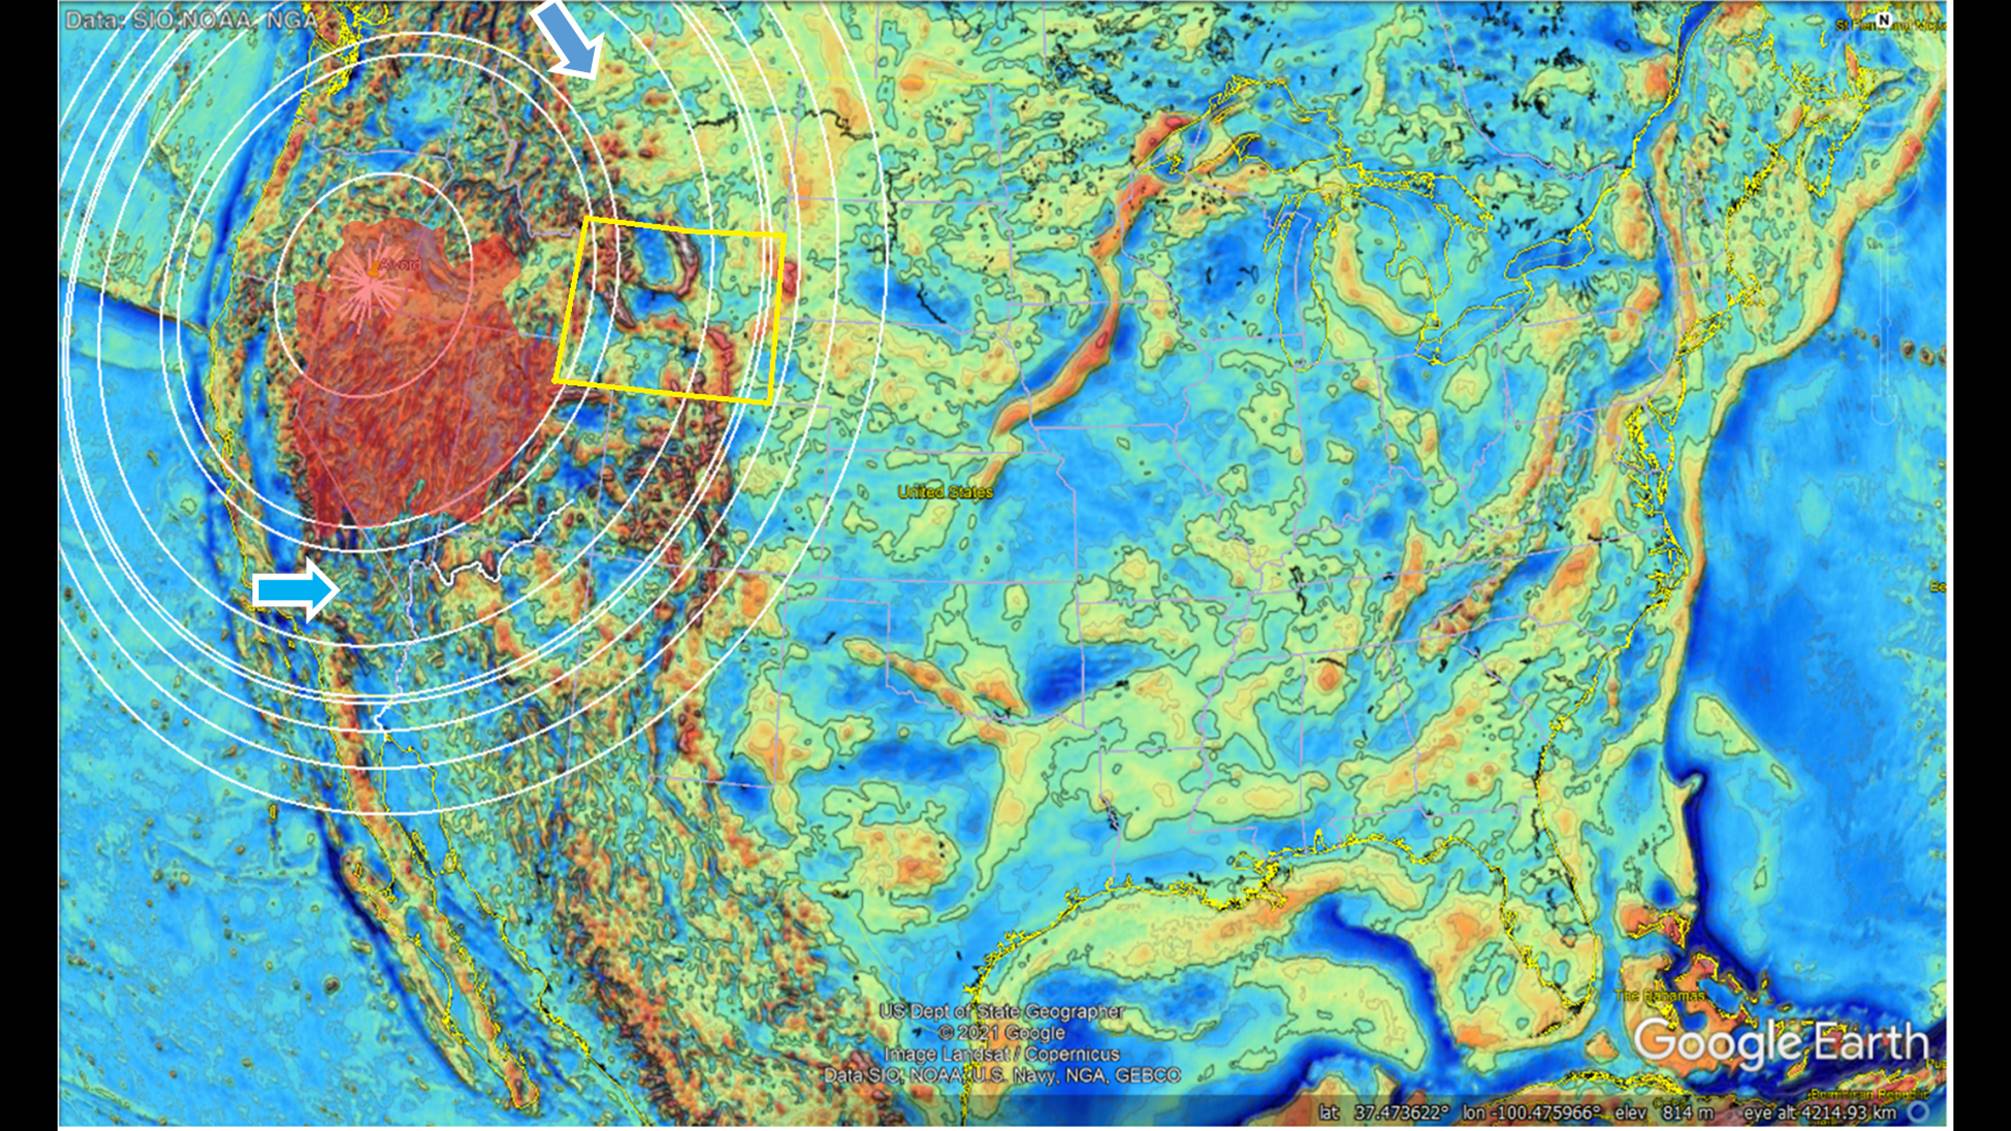 Figure 26: Seeing the Alvord crater in gravity map, the Great Basin is at its center and the Grand Canyon between rings 3 and 4 in a wide primarily dark blue ring. Just inside this blue ring, the 2-3-ring is the location of the Sevier Precambrian Thrust Belt of western Wyoming. The early Alvord crater is not alone in this position. Is it just a coincidence that the Grand Canyon occurs in the broad dark blue area of low gravity?
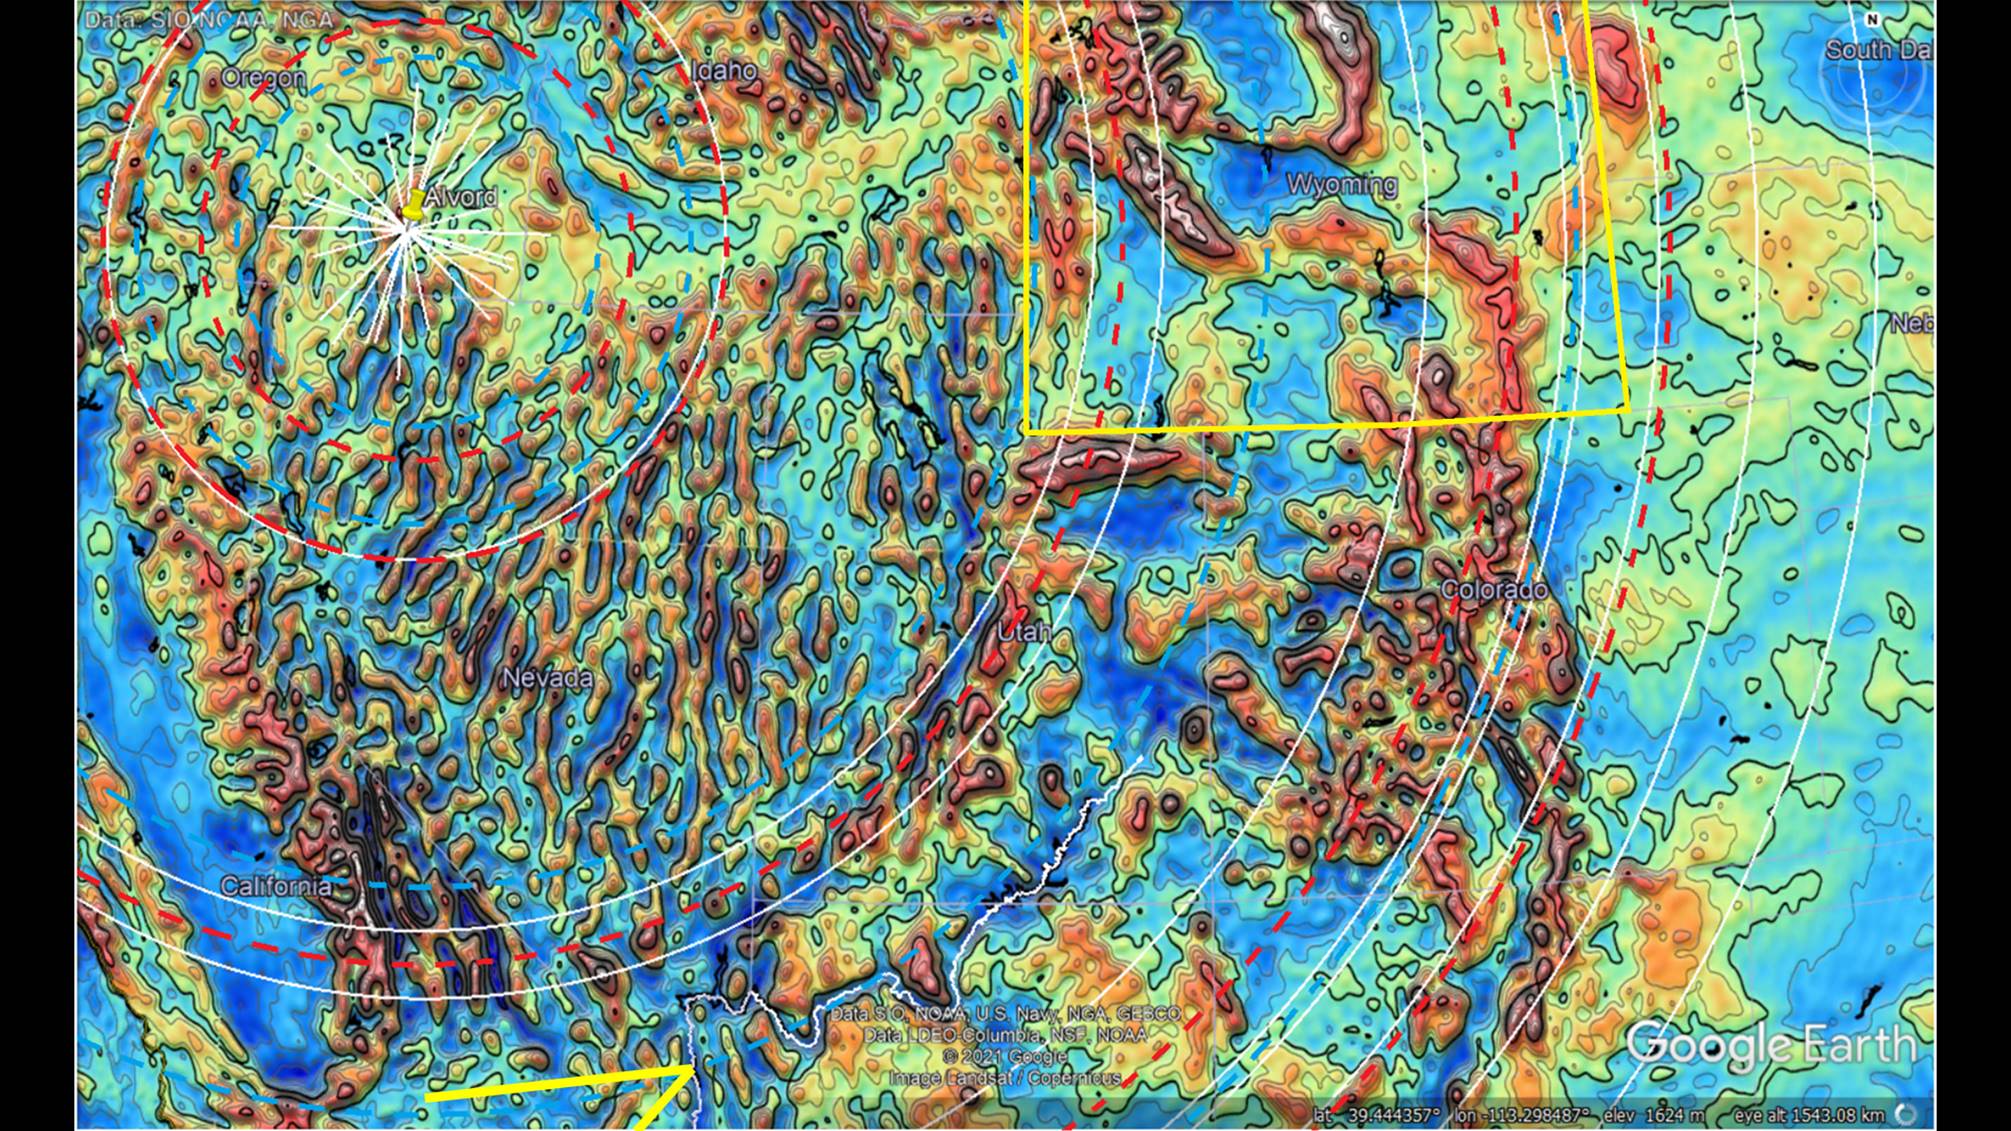 Figure 27: Remember near the start, I said seeing impact shockwaves in gravity is like seeing ripples from a pebble in a pond. Everyone is asking the question, how do I see the Alvord crater? I see the ripples and you can too. Some compression rings are shown with dashed red linears. The one between the two white rings near the west edge of Wyoming is the one that formed the Sevier Thrust Belt. If you look inside that red dotted linear, you will see a blue dashed linear. I admit the blue ones are easier to see in gravity, and the red ones are recognized for their relationship to the dark blue linears. The wide dark blue containing the Grand Canyon (marked with yellow arrow) is most obvious. But, can you pick out the 5 high gravity wave ridges?? Yet, the Sevier Thrust Belt was not formed by the Alvord crater alone. Across Wyoming its thrust edge has been overridden by another crater slightly to the west. This belongs to the Blowout Mountain impactor.
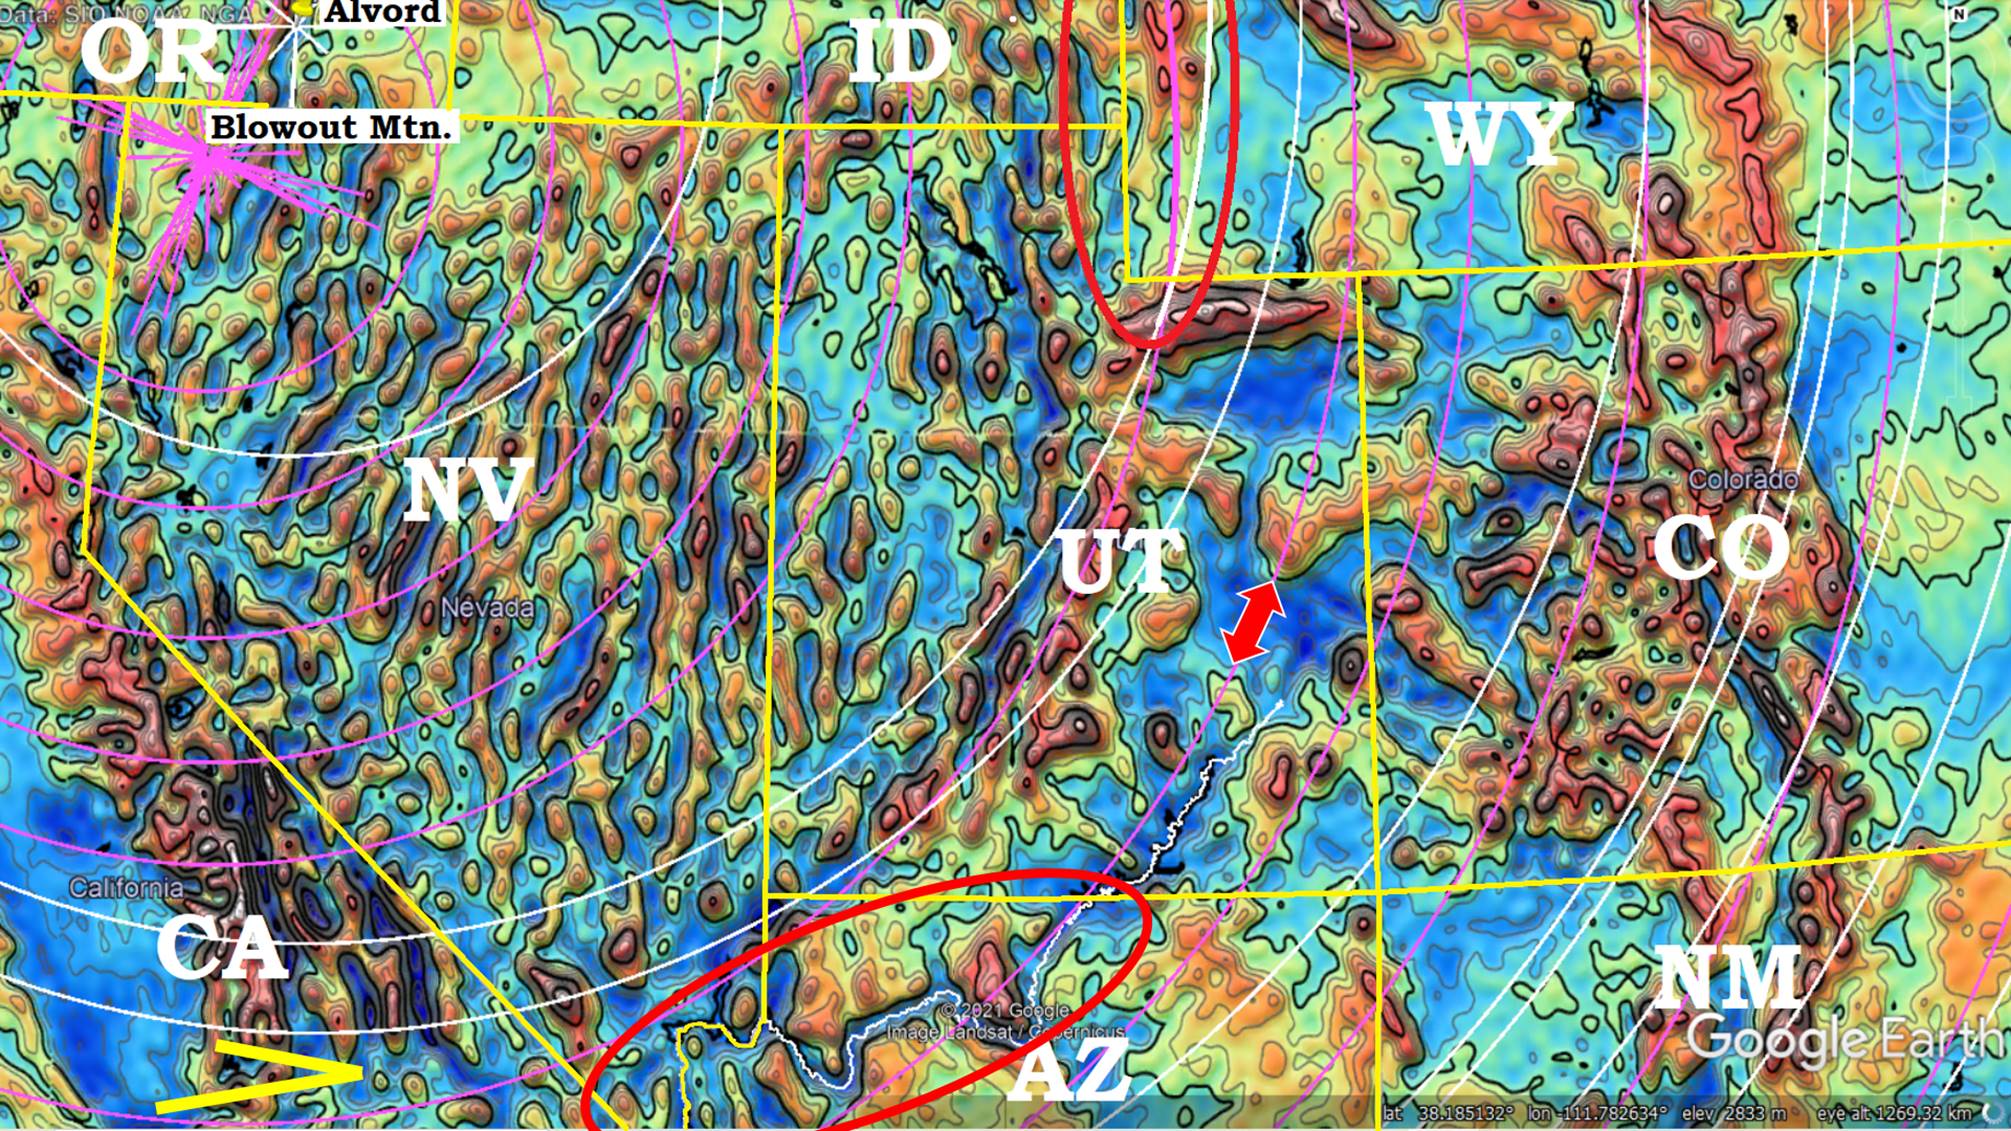 Figure 28: An enlarged view from Figure 27, including the pink rings of the Blowout Mountain crater. The Blowout Mountain center is in nearly the same location as the Alvord, but slightly to the west. That causes the Sevier Thrust Belt to draw back towards the west, nearer the western edge of Wyoming. The thrust edge is marked in a red dashed linear. Just inside the high gravity ridge is the following release-valley marked with a blue dashed linear (yellow arrow). It was this section of the blue ring that first led me to separate the thrust ridges of the Alvord from that of Blowout Mountain. The high gravity ridge marked with the red arrow is almost lost in that wide blue linear from the Alvord, but it does correspond with a couple high points near the Grand Canyon. The combination of the Alvord and Blowout Mountain faults has led to the assumption in geology that faults can be formed in the Precambrian and later reactivated in the Cretaceous. Alvord crater’s sediments and faults are dated as Precambrian, and Blowout Mountain’s sediments are dated as Cretaceous or later. They both have a significant presence across the entire Rocky Mountain region as their own distinct fault, not reactivated.
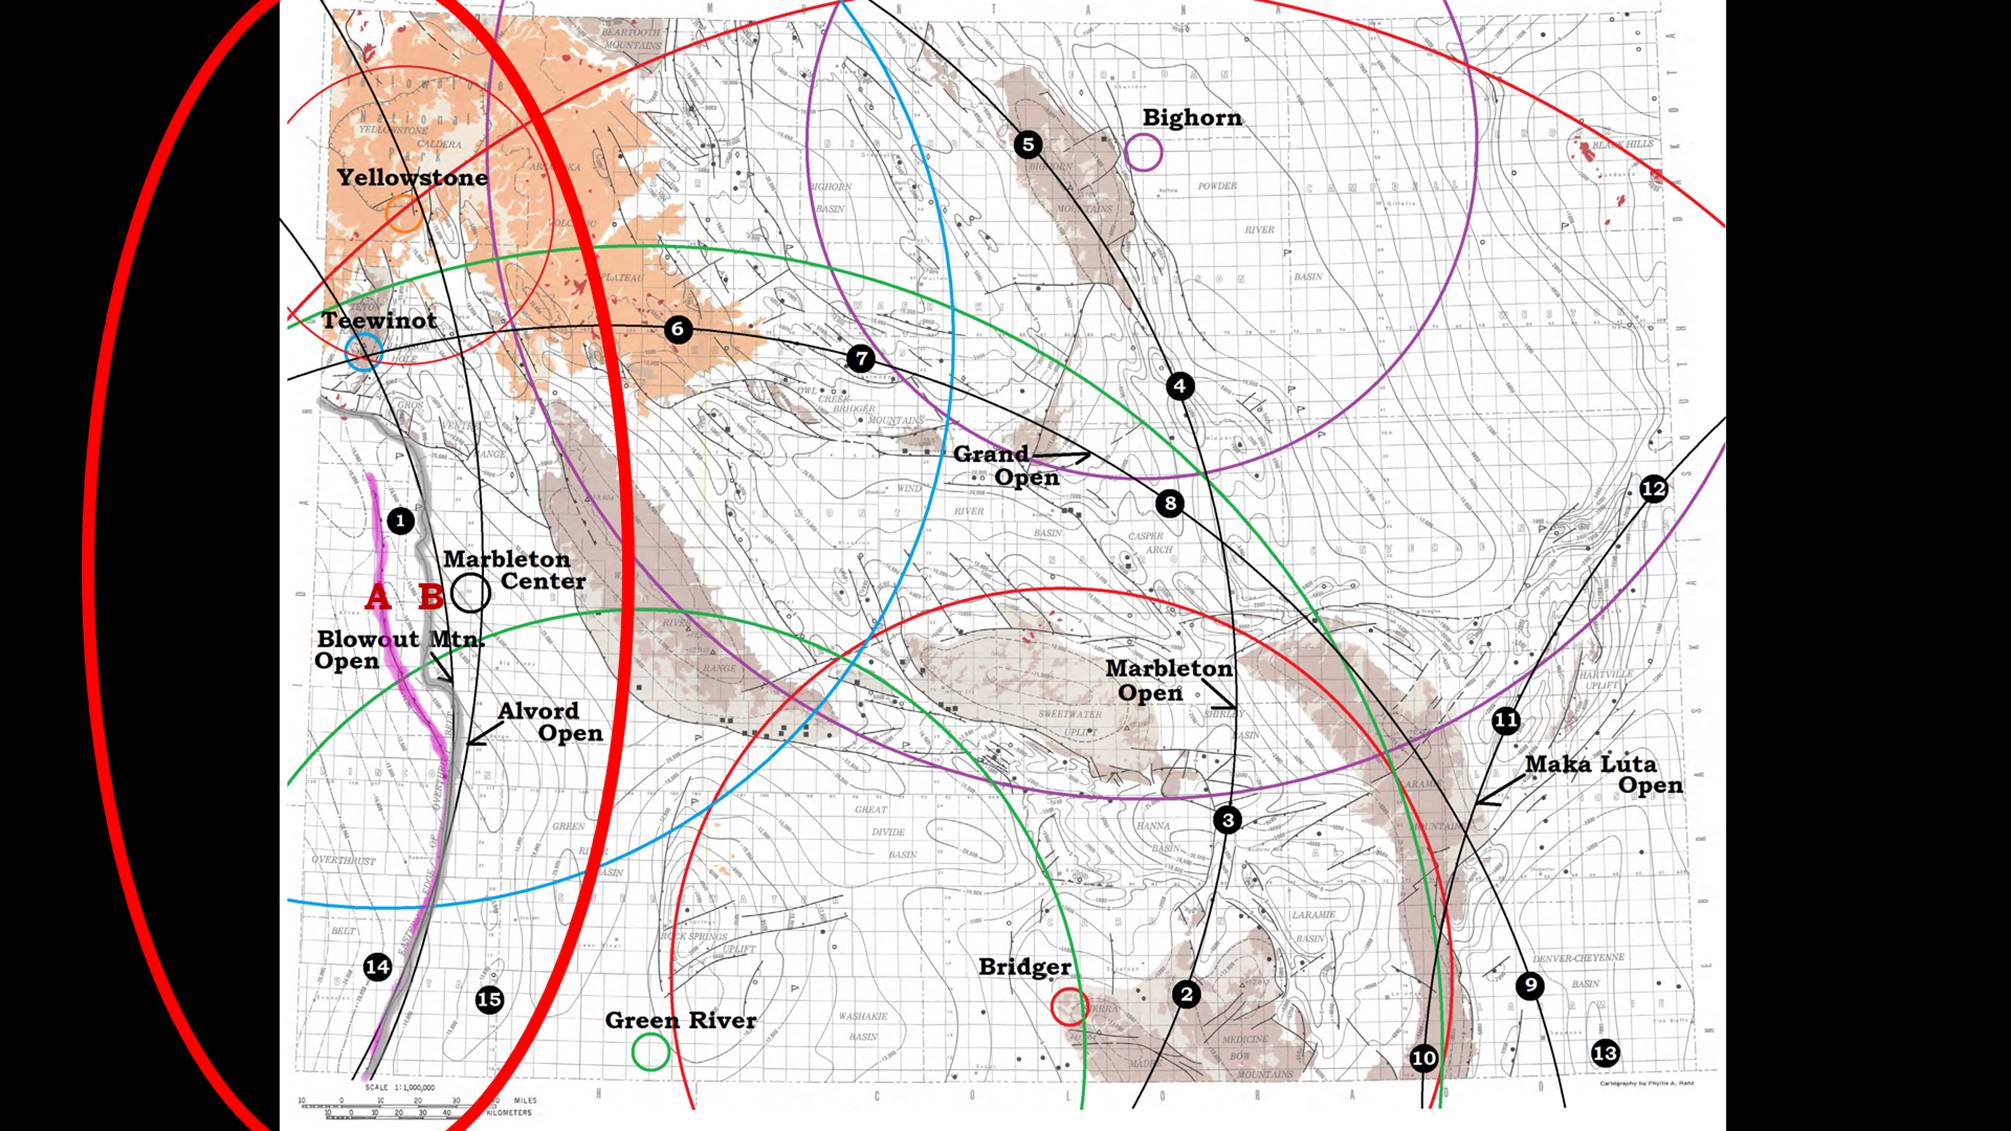 Figure 29: On the Pre Cambrian surface map of Wyoming the two thrust faults of the Sevier Orogeny (A and B) show near the southwest corner. The Open-rings of the Alvord and Blowout Mountain craters are shown in the red oval. The thrust zones have been displaced to the southwest by the later Bighorn crater and pushed south by the Teewinot crater. Many of the basement morphologic features are shown correlated with medium size craters generally associated with Cretaceous and later deposits.
 Figure 30: An active fault map of Utah confirms the location of the Sevier Thrust Zone in this area. It is noted that not many of the faults lie in the direction of the up-thrust or crater rims, but because later craters were adding to the energy signature of the up-thrust, the later craters were able to leave faults for their up-thrust. The small generalized section is taken at the black line. It shows a much generalized section through a few of the large craters showing how they contributed their sediments around the two uplift. The Alvord crater (Chuar Group of Grand Canyon) was very early, shortly after the Tatanka (Unkar Group of Grand Canyon which is prior to the Sevier Orogeny). The Maka Luta crater (Tonto Group: Tapeats Sandstone, Bright Angel Shale, and Mauve Limestone/Dolomite Rock of Grand Canyon) arrived after the Alvord but covered more of the continent, similar to the Tatanka’s dispersion. The Grand crater (Schnebly Hills Sandstone, Fort Apache Limestone, and Coconino Sandstone) is separated by the craters depositing the Redwall and Supai Formations from the Maka Luta crater, and is followed by the Blowout Mountain crater forming the more westerly edge of the Sevier Orogeny. The Uinta Mountains extends right across the Sevier thrust zone, because it was formed by a later crater which struck almost atop the thrust zones and pulled up the Uinta Mountains is an earth mascon. (Moon Mascons are mass concentrations of gravity in the center of many larger craters on the moon. They are all formed by CGRS from distant craters, see Chapters 10A and 16.)
 Figure 31: Where is the start of the Flood boundary in the Grand Canyon? That is not easy to find, but it is easy to define. The start of the Flood boundary is below the lowest cratering. If layer 3 is the Alvord crater, and it is mixed up with the evidence for the Blowout Mountain crater, 5; it is easy to see there is much to sort out. Actually, crater 6 is my diagraming of the Laramide Orogeny, like the Uinta or Bighorn Mountains. Mascons are short mountain ranges that are pulled up when the crater bottom rebounds. The difference in the Sevier and Laramide Orogeny is covered in Chapter 10B of my book. I will define the start of the Flood as below the crystalline basement.
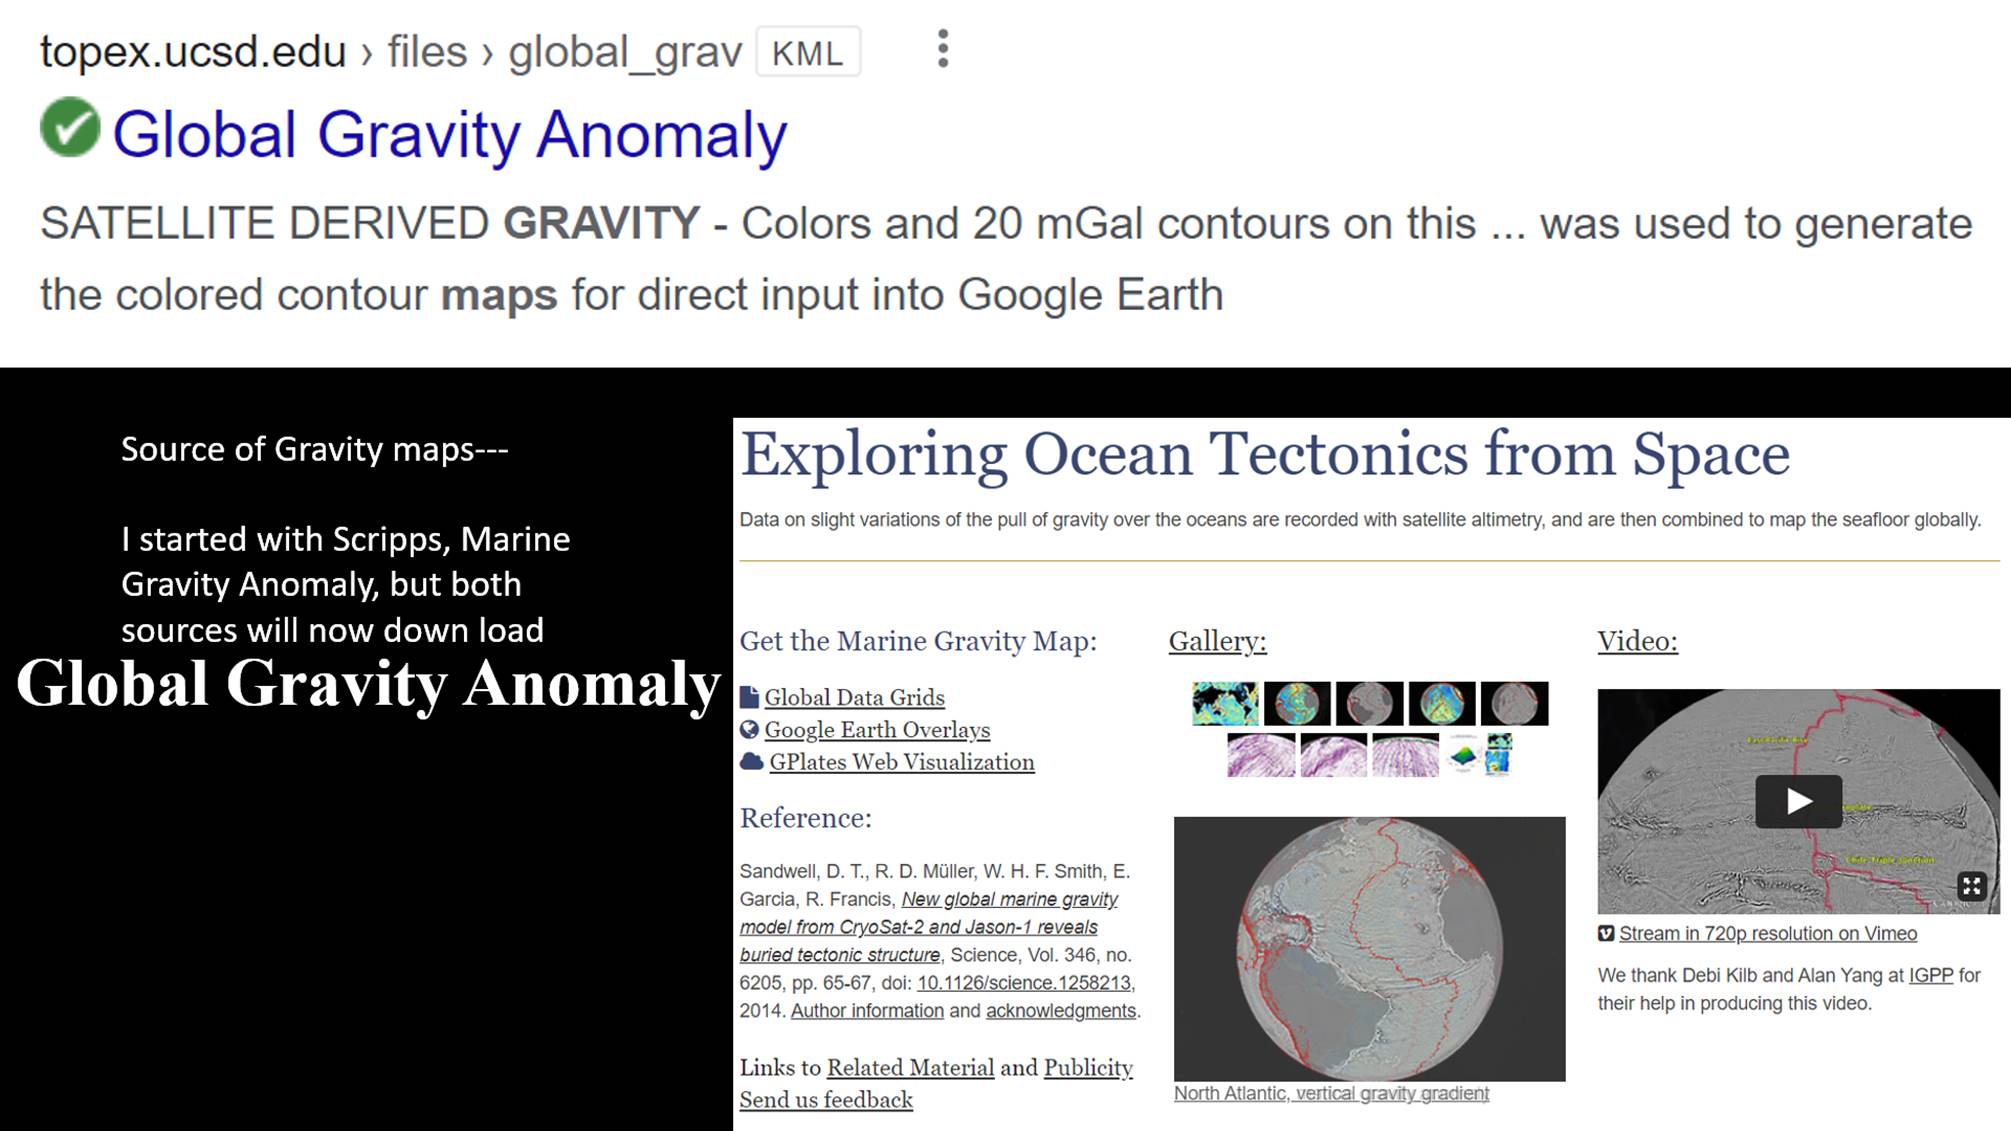 Have you now recognized the need for a good gravity overlay? There are two addresses for Global Gravity Anomaly. I used the download from UCSD. The reference in the Scripps site gives the background on how it was derived and a little about it. Scripps Institute of Oceanography is part of University of California at San Diego (UCSD) so you can down load the same KML file for Google Earth from either webpage. But, if you want to see the craters, you need to get it.
Sevier and Grand Canyon, Pt 1
 There may be no other plot of ground so often used to illustrate many of the geologic processes espoused in textbooks than the Grand Canyon. Geologist talk about it like they have the processes all figured out. Is it just possible that they have gotten it all wrong? This presentation is going to suggest unimaginable cratering was responsible for everything we see in the Grand Canyon, from the rocks, the sequence, the faults, and the actual canyon. None of it got there by geological processes we can see happening around us today. We will question if some of the processes even work the way everyone has assumed they would. Gentle reader, do not be afraid to questions the rocks, the processes, even my model, but above all, question the assumptions both you and I have made. Our God is a God of mystery, but He is also a God of Knowledge. And in knowing, He is worthy of our praise.
 Figure 1: Any reader may question why a discussion of the Grand Canyon would start with looking at the northern edges of Canada. We share a common continent with the northern reaches of Canada, and we share the results of those early cratering processes. One of the earliest mountain building events was the Sevier Orogeny, which extends from northern Canada down to the Grand Canyon. While the canyon is not normally included in the orogeny’s events we will see that it springs from a common point of origin. While it would be convenient to start in on the deepest strata in the canyon, the Crystalline Basement, we must first look at the cratering process to define our terms and understand together the foundations of our discussion.
 Figure 2: How do impactors form their crater? Shoemaker in 1973 looked at the Meteor Crater and saw a hole very much like the Teapot ESS crater that had recently been blasted in the Nevada nuclear test site. But nuclear test are routinely buried in deep shafts so that the dirt fallback buries a significant portion of the radioactivity. Between step 6 and step 7, he envisioned the conversion between the shock wave to the release wave generating a lot of projectiles which were ballistically ejected in step 8. The fallback from this ballistic ejection builds a crater rim of fallback as well as largely filling the crater.
 Figure 3: Looking at the documentary footage from the Sedan Nuclear Test in 1962. This test was conducted with a 104 kiloton explosion under 635 feet (194 m) of alluvium. Times on the images is running time. Narrator said the third image was approximately 3 seconds after ignition, so film footage was exposed faster than shown. Fist image, a matrix bubble is seen to be forming below ground, and in less than a second the bubble is seen to be bursting with flames of energy, until the heat release consumes the bubble shell. The Shock wave was sent out with the original ignition. As it converts to the Release wave tremendous amounts of the original compression wave is converted to heat because it is released to rapidly to travel in an orderly manner from molecule to molecule. This heat is the actual flames seen shooting out of the expanding bubble. Twelve mega tons of dirt were displaced largely because it was detonated at depth. The bombs over Hiroshima and Nagasaki produced NO crater because they were exploded slightly in the air for maximum destruction.
 Figure 4: In the Sedan explosion some chunks of superheated rocks produced steam or dust trails as the continued on their limited trajectory, designed to stay very locally to localize and bury radioactivity. The raising of the rim was not primarily a build-up of ejecta, but the sediments forced outwards into the substrate in the shock compression expression, the bubble seem swelling and rising in first image of Figure 3.
 Figure 5: Central Arizona is the site of Meteor crater, also known as Barringer Crater; named for the family that owns it. Shoemaker developed his cratering model at Meteor Crater and NASA still uses it. Contrary to Shoemaker’s thinking, the rim was formed by lifting as compression forces some of the cratering material to retreat from the center of shear into openings between every particle of the surrounding substrate. A much thinner shell of earth than in the Sedan explosion formed at the far reaches of the expansion wave that then was pierced by a limited number of projectiles with a great release of heat. If we look outside Meteor Crater, this is a big hole, we should see some pieces of big rubble. We do not.
 Figure 6: The Google Earth view shows only a halo of small white rubble, extending to the northeast. This extension is called a “wind-streak.” Using Thermal Infrared image by NASA, the terrane is mostly Kaibab limestone (green) with many small patches of Moenkopi (blue), mainly to south and east. High silica Coconino (red) is the shattered white sandstone seen in Google Earth image. Most of the crater bottom and surrounding terrane still shows blue, the color for limestone in the infrared spectrum. That means the Kaibab limestone that originally covered the ground was compressed into the bottom of the crater, not blasted outward prior to the Coconino movement. The outer ejecta is primarily red in the TIR image and white in the Google Earth. The white ejecta is largely contained inside the blue arrow, and near the crater rim except where I have drawn linears through it. The linears represent fractures that opened up primarily along linear 1 and 2 through faults that opened up in the adiabatic conversion. I invite you to read Chapter 8 for a much more lengthy discussion of the evidence. The downward COMPRESSION forced breccia, produced by the ADIABATIC CONVERSION, down into the fractures. The resulting EXPANSION pushed up the rim and sent breccia out by the fractures beyond the rim through these linears. Primarily, the rubble is contained within the original rim, but the heat and pressure converted breccia radiates outwards by ejection through fractures. I expect this to be the pattern in all craters except the expression of heat/energy will be proportional to the size of the impactor and resultant crater. The crater bowl produced by some large craters would not be produced by ballistic excavation but compression, and the bottom (Moho) would be surfaced by recrystallized melt from that crater. While in college I witnessed the ignition of 13 sticks of melted dynamite in a grazed field of dry winter wheat. It blew the top and sides of the wooden box to splintered and compressed a 5 foot disk of earth with the box bottom about 6 inches, but left the wheat stalks under the lid only flattened on the surface.
 Figure 7: This is the farside of the moon. It is often called the “high-lands” much more like the continental areas of earth which are the earth’s “high-lands”. Much of this cratering study will use strangely colored maps of both the moon and earth. These are gravity map. Gravity maps DO NOT correspond to topography maps, but often they look similar. On a topography map a mountain may show high because its shape is tall, and in a gravity map it may show high because it has denser lithology (more gravity) than surrounding rocks. It is a subtle difference but extremely important because not all landforms with high topography have high gravity, and some low landforms have high gravity. The Compression/shock wave will produce high gravity whether it produced high topography or not. And by contrast, Expansion/release waves will produce low gravity whether they later are pushed to great heights. The bull-eye pattern seen on the moon are high compression/red gravity ringed with low expansion/blue gravity rings repeating outward.
 Figure 8: On the farside of the moon some craters are still designated basins because bureaucracy is slow changing names to show recognized craters. I may refer to them as craters, which they are. We need to first consider where to gather data. NASA provides three wonderful maps of the moon: GRAIL (gravity, seen here), Crustal Thickness, and Topography. If you are using Google Earth, you can paste these as pictures on Google Moon and the landmark names and distances will show up appropriately. A fourth map is very useful, Red Relief, that comes from the JAXA, Japan Aerospace Exploration Agency (their NASA), and can also be pasted on Google Moon. For Gravity on Earth, Scripps Institute of Oceanography (UCSD) offers a Global Gravity Anomaly overlay for Google Earth that you cannot do without. You will find web addresses at the end. First of all notice that nearly all of the craters, large and small, but especially the medium size ones, have a dark blue center. That is LOW gravity. But by contrast three of the largest, Moscoviense, Freundlich-Sharonov, and Raimand-Mitra Basins, have red centers. The red center is referred to as a Mascon, a mass concentration. These basins did not show up as individual craters until the GRAIL gravity map was produced, but it is now easy to recognize the red/denser/ high gravity rings from the blue/ low gravity rings between. We can deduce from this view that the normal center of a crater in not necessarily low topography, but it is low gravity until a mascon forms.
 Figure 9: The first view the public got of the GRAIL data was pasted over the east half of Mare Orientale, a NASA produced image for Science Magazine. It shows the correlation between tall topography and high gravity, except at the center. The red 1-center/mascon is such high gravity it totally mask topography and other small changes in gravity. 2-Ring is red, yellow and green, so it shows high and lower gravity, more than the topography suggest. 3-Ring is low gravity, but it has topographic highs in it. 4-ring varies similarly to 2-ring. 5-ring does not show low gravity with blue. But. It does show lower gravity in a small circular area just below the “5”. It becomes a task of judging how comparatively low and how comparatively high.
 Figure 10: Energy envelope will be an important concept for seeing craters on moon or earth. When an impactor strikes a body it does not blast a hole in it, any more than a pebble “blast” a hole in a pond when it is thrown it. It will make a splash, but not blast-out a hole. Shock/Compression waves make a crest of greater density/gravity material and release/expansion waves make a trough of less dense/gravity material. The difference is while a rock may compress until it becomes a liquid, it cools to a solid, and the sense of the wave’s motion is caught in the chemical makeup/density of the rock. Additionally, the adiabatic processes get involved “spewing” ablated (rounded) rocks/breccia out of the crater and ring structures. An energy envelope will then consist of one expression each of the compression wave and expansion wave, generally a ring of red with a ring of blue inside of it.
 Figure 11: When you see ripples in a pond, you are seeing the energy signature, alternating shock/compression waves and release/expansion waves. This is an expression of the pebble’s impact energy. Look at the image on the left, how many ripples can you pick out? Can you see the one that is colored red on the right? We can all probably see the one in black inside of it, and if we look carefully we can probably pick out some expressions of the red-ring within and between other ripples. Can you see the yellow-ring? It is pretty obvious in the center and towards the right edge, but will probably take a little looking to see it along the far distant edge. Can you see the pink line? Again it is obvious in the center and becomes less so within the other ripple patterns. But, ripples show us one very important characteristic, other sets of ripples do not obliterate previous ones, they just add to their expression. Look at the obvious pattern in the lower right hand corner. When ripples overlap, they form a system of nodes, with the additive and subtractive combinations for the energy put into each water molecule. So, as it is a wave, the energy is not expended but it keeps on moving outward until it is dissipated and lost in noise.
 Figure 12: Looking at Mare Orientale in greater detail, (A) shows some linear ridges and valleys that cut across the first few rings. Most of these can be traced even further out with greater detail afforded by the zoom feature on Google Earth. The crater center is amongst the lowest topographic points seen, but Gravity in (B) shows it to be a mascon with the bright red/highest gravity center. Crustal thickness shows the center to be the thinnest crust in the immediate area with a red ring, thickest crust just inside 4-ring. So the densest crust is just outside the thickest crust. A possible structural cross section in shown at upper right, with the orange showing crustal thickness, and the Lunar Discontinuity (LD), equivalent to the Moho on earth, showing variation in depth between crust and mantle. With the gravity map in lower right, the mascon is indicated as probably a pull-up of the mantle in the rebound of the crater floor. (Chapter 10 and 16 in the book.) The five arrows represent where Hartmann in his 1963 book placed them.
 Figure 13: Moving on outwards, using Red Relief, which emphasizes changes in topography (JAXA), 11-rings are located and verified with Ambient light. These more distant annulus to the cratering event are referred to as Concentric Global Ring Structures (CGRS). Rings 1, 2, 3 and 5 of Hoffmann were verified, and several concentric linears in between them, and then extending even further out are added. I believe Mare Orientale’s 2-ring (at 930 km diameter), was the (Original Cratering Rim) OCR-ring, and the crater was possibly the last large crater in its area. Maybe this is why it left such a clear record in the topography seen with ambient light. The cross section of Mare Orientale is the most detailed I could draw with this information. Chapters 8, 9, 10A, and 12 give much more information how I developed these cross sections. Scale on the right represents the depths. Regrettably, I have better information on lunar craters, so I cannot provide nearly this clear a picture of earth craters, until we look at some smaller structures (Uncompahgre crater, ~460 km diameter OCR-ring [Original crater rim]).
 Figure 14: Looking closely back at Mare Orientale’s blue/low gravity center, outside the Mascon we see 3 distinct blue linears. “1” is the most distinct, but “2” has some green to orange in its center. I will classify both of these slightly arced linears as Release-Valleys similar to the Unaweep Release-wave Valley of Colorado (Chapter 1). Linear 3 is also a release valley, and its wiggly line reminds me of the Grand Canyon when viewed in Gravity map. This has been a rapid review of the cratering process and how to read gravity maps, but before we get to the Grand Canyon we need to cover some more preliminary information about my model.
 Figure 15: This is the bare-bones, “Cliff Note,” version. I will call it the “Rain-of-Heaven” Cratering Model. It contains only 5 points at present. 1. Impactors came from only one direction striking continuously from when the “Windows of Heaven” were open until they were closed. As I assume these impactors were headed for the sun, this means that all cratering took place at night. If the Taurid Meteor Shower is the remnants of this rain, the Flood likely started in our Fall Months. 2. As it rotated, one part of earth was struck for about 12 hour intervals then cooled for 12 hours. Making 40 rotations, dividing the Flood into 40 distinct intervals of cratering on earth. As the first impactors were some of the largest, possibly much water was blasted into space where it was flash frozen and probably fell as ice during the day partially cooling the substrate. 3. Moon made only 1.43 rotations in 40 days, being struck continuously except briefly when it was in the earth’s shadow, so cooled less and more slowly between strikes (here the light half of the moon represents it nearside, and the gray half represents its farside. Small numbers represent the approximate juxtaposition of the moon’s sides to the earth and to the arriving impactors on that day’s number.) 4. Moon’s farside highlands are most similar to earth’s continents and the nearside is similar to earth’s oceans. Therefore, continents are determined by the amount of cratering in that location. More craters = continents, less craters = oceans. 5. Cratering with secondary impactors continued after 40 days, finally ending about Abraham’s time frame with Sodom and Gomorrah. Possibly allowing for some significant post-Flood catastrophism.
 Figure 16: If the moon’s bombardment started in the vicinity of Mare Orientale, made a full 1.43 rotations; it would rotate through the highlands, across the front side lowlands and then back through the highlands. If this concentration of impactors for a second time in the same area resulted in a greater percent of alkaline magmas, this would correlate with returning over the same crust results in bringing more alkaline material towards the surface where it can be accessed by the cratering process. Such a concentration of alkaline material will account for earth’s continents as well, not basalt vs granite which is usually cited.
 Figure 17: This is a gravity map of the earth. In this presentation I will usually pair it with a Google Earth Landsat image so that you can relate the gravity map to familiar mapped locations. If you are going to work in cratering, you will have to learn to recognize the important landmarks while in gravity maps. The Yukon Gold crater anchors the northern end of the Sevier Orogeny. It extends from Alaska to British Columbian, and includes most of the Yukon Territory inside its inner ring. You can see the thin white circle outside of the obvious blue half ring. If this was ripples in a pond, you would have no problems recognizing the ripple pattern from this much information. The Yukon Gold crater is recognized for it “energy envelope” (alternating high and low gravity) seen in the gravity map. The slightly arced linears are distant CGRS/annulus from (1) the Tasman Sea crater and (2) the Azores crater, The Azores crater caused the Tintina Fault, and the Tasman crater caused this portion of the Denali Fault.
 Figure 18: Now that you have seen the Yukon Gold, can you see the much larger Caribou crater? It is most obvious with its projection off of the continent into the Pacific Ocean. The Taltapin and Fraser craters are much harder to see, but as you train your eye, they also become visible. Can you see diagonal lines going through the mountains of British Columbia? That is Concentric Global Ring Structures (CGRS) from the Tasman Sea crater. They are also the source of one of the Mid Continental arches touted in some geologist analyses, extending down through Colorado. For this mid-continental arch, the source of shear lies 12,000 km (7,500 miles) away. Is it any wonder I will not allow any continental/plate or any other significant movement in the earth’s past. It just doesn’t work. Admittedly, I located the crater before I recognized the linear of the arch. But could this be a coincident that the plate moved into precisely the exact location to fit? By the way, I have located 20-30 of these distant correlations. In my book I document at least 8 covering the entire State of California. Is it a coincidence that the Yukon Gold and Caribou crater rings are reflected in surface geology in the right-hand map? I think not. Cratering not only determined the topography but also the lithologic makeup of the topography.
 Figure 19: These lines and arcs in Plate Tectonics are referred to the Sevier Orogeny (fancy word for “mountain building”). The red arrow shows direction of thrust (the direction from the Tasman Sea to here), but the blue arrow shows another direction of thrust that runs near the Tasman line, It is only slightly different but it was real fun solving the small conundrum it caused. That source of shear/thrust from the east is the Azores crater. Yes, originating off of the coast of Spain, only 7,200 km (4500 miles) from where it shows up. I wish I could spend all of my time explaining the direction and special relationships in the Mackenzie Mountains, but that is an only partly written chapter in my book. But note, at the lower end of the Sevier Orogeny lies the Grand Canyon, and we want to get there.
 Figure 20: This is a Geology map of the same area of Canada. We can only see partial remnants of the cratering pattern. That is because the craters and lines work together to form much of the lithology. Events that occur together have results that reflect ALL of the involved sources of shear. Also, the heat and pressure that were already put into that patch of ground by large, previous crater. They all work together to bring the chemical composition up from the mantle together and crystallize the specific pattern of minerals found there dependent on heat and pressure. The pressure does not come from deep burial, but cratering on the surface. Carbon is pulled up in one place and turned to carbonate rock and in another place formed into kerogen, bitumen, and petroleum based compounds. The chemistry all depend on the available heat and pressure, the final energy envelope expression in the specific area.
 Figure 21: Ok, we got that much figured out, but don’t get too smug. Here is a slightly larger picture including Alaska to California. The Alaskan crater makes a HUGE impression on the northern end, and the Alvord makes a pretty big one on the south end. But the Greater Beaufort and Foxe made additional contribution. The Greater Beaufort was a bit later than the Foxe and opened up some of its concentric fractures to spew the Franklin Large Igneous Province out over much of Northern Canada. Yes, volcanics are a direct result of cratering. Can I expect you to understand all of these cratering circles? If you take only one thing from this, I hope that you will take a mental image of the globe covered with all of these circles. Circles that have their source in points of shear pressure caused by astral-impactors that created the craters that formed the lithology and shaped the topography. These circles are associated with all of the geology we know, and the more we study them the more we can explain the geology.
 Figure 22: A craton is defined as a large stable piece of deep crystalline rock lithosphere with sedimentary layers on top. The large blue area is certainly the thickest portion of the crust? Could that be a result of the large Foxe crater that compression melted the rocks to great depth? As a result, energy signatures of later craters were simply lost in the massive energy signature of the Foxe crater leaving what I term “ghost crater.” It looks like South Pole-Aiken on the moon. How similar the craton and the deep LAB boundary is to a maps of the Laramide Ice Sheet. When I first saw this spatial relationship and realized cratering produced rock surface scour, large erratic boulders, and piles of small breccia to sand to loess sized particles. The same evidence that is used to support the ideas of glaciers and an Ice Age. Did an Ice Age happen, or are we mistaken in the genesis of the evidence ascribed to them?
 Figure 23: Compare the Foxe crater image with several moon craters. These are all gravity images, so all of them have large blue centers of low gravity, but several of the moon craters have a red mascon in the center of the blue. Since the mascon is a dense up thrust (CGRS) from the mantle originating at a distant shear/cratering center, the craters would have had to form after some other large craters which would produce the CGRS that formed the mascon. South Pole-Aitken, lower right, and the Foxe craters do not have obvious mascons, and I will propose part of the reason is that they were both formed early before other large craters could form CGRS to produce mascons in there centers. There could be other differences as well. We know the South Pole-Aitken is a mantle cored crater, so a mantle up warp is not enough to form a mascon. It has to have an additional up-thrust compressed by the shock wave’s CGRS from another crater.
 Figure 24: These are six tomographic sections through the North American continent, three west to east and three north to south. The resultant arcs are the proposed pressure energy signature of the bowl depth of craters. I have indicated in yellow some other contained pressure bowls of later and smaller crater. There are alternative interpretations when more detail is seen. Robert Watchorn is one of the few individuals I can locate worldwide that is significantly studying craters.
 Figure 25: The Alvord crater anchors the south end of the Sevier Orogeny thrust zone like Yukon Gold crater anchors the northern end, connected by the Tasman Sea linears. See the white wiggly line between the 3 and 4-ring? That is the location of the Grand Canyon.
 Figure 26: Seeing the Alvord crater in gravity map, the Great Basin is at its center and the Grand Canyon between rings 3 and 4 in a wide primarily dark blue ring. Just inside this blue ring, the 2-3-ring is the location of the Sevier Precambrian Thrust Belt of western Wyoming. The early Alvord crater is not alone in this position. Is it just a coincidence that the Grand Canyon occurs in the broad dark blue area of low gravity?
 Figure 27: Remember near the start, I said seeing impact shockwaves in gravity is like seeing ripples from a pebble in a pond. Everyone is asking the question, how do I see the Alvord crater? I see the ripples and you can too. Some compression rings are shown with dashed red linears. The one between the two white rings near the west edge of Wyoming is the one that formed the Sevier Thrust Belt. If you look inside that red dotted linear, you will see a blue dashed linear. I admit the blue ones are easier to see in gravity, and the red ones are recognized for their relationship to the dark blue linears. The wide dark blue containing the Grand Canyon (marked with yellow arrow) is most obvious. But, can you pick out the 5 high gravity wave ridges?? Yet, the Sevier Thrust Belt was not formed by the Alvord crater alone. Across Wyoming its thrust edge has been overridden by another crater slightly to the west. This belongs to the Blowout Mountain impactor.
 Figure 28: An enlarged view from Figure 27, including the pink rings of the Blowout Mountain crater. The Blowout Mountain center is in nearly the same location as the Alvord, but slightly to the west. That causes the Sevier Thrust Belt to draw back towards the west, nearer the western edge of Wyoming. The thrust edge is marked in a red dashed linear. Just inside the high gravity ridge is the following release-valley marked with a blue dashed linear (yellow arrow). It was this section of the blue ring that first led me to separate the thrust ridges of the Alvord from that of Blowout Mountain. The high gravity ridge marked with the red arrow is almost lost in that wide blue linear from the Alvord, but it does correspond with a couple high points near the Grand Canyon. The combination of the Alvord and Blowout Mountain faults has led to the assumption in geology that faults can be formed in the Precambrian and later reactivated in the Cretaceous. Alvord crater’s sediments and faults are dated as Precambrian, and Blowout Mountain’s sediments are dated as Cretaceous or later. They both have a significant presence across the entire Rocky Mountain region as their own distinct fault, not reactivated.
 Figure 29: On the Pre Cambrian surface map of Wyoming the two thrust faults of the Sevier Orogeny (A and B) show near the southwest corner. The Open-rings of the Alvord and Blowout Mountain craters are shown in the red oval. The thrust zones have been displaced to the southwest by the later Bighorn crater and pushed south by the Teewinot crater. Many of the basement morphologic features are shown correlated with medium size craters generally associated with Cretaceous and later deposits.
 Figure 30: An active fault map of Utah confirms the location of the Sevier Thrust Zone in this area. It is noted that not many of the faults lie in the direction of the up-thrust or crater rims, but because later craters were adding to the energy signature of the up-thrust, the later craters were able to leave faults for their up-thrust. The small generalized section is taken at the black line. It shows a much generalized section through a few of the large craters showing how they contributed their sediments around the two uplift. The Alvord crater (Chuar Group of Grand Canyon) was very early, shortly after the Tatanka (Unkar Group of Grand Canyon which is prior to the Sevier Orogeny). The Maka Luta crater (Tonto Group: Tapeats Sandstone, Bright Angel Shale, and Mauve Limestone/Dolomite Rock of Grand Canyon) arrived after the Alvord but covered more of the continent, similar to the Tatanka’s dispersion. The Grand crater (Schnebly Hills Sandstone, Fort Apache Limestone, and Coconino Sandstone) is separated by the craters depositing the Redwall and Supai Formations from the Maka Luta crater, and is followed by the Blowout Mountain crater forming the more westerly edge of the Sevier Orogeny. The Uinta Mountains extends right across the Sevier thrust zone, because it was formed by a later crater which struck almost atop the thrust zones and pulled up the Uinta Mountains is an earth mascon. (Moon Mascons are mass concentrations of gravity in the center of many larger craters on the moon. They are all formed by CGRS from distant craters, see Chapters 10A and 16.)
 Figure 31: Where is the start of the Flood boundary in the Grand Canyon? That is not easy to find, but it is easy to define. The start of the Flood boundary is below the lowest cratering. If layer 3 is the Alvord crater, and it is mixed up with the evidence for the Blowout Mountain crater, 5; it is easy to see there is much to sort out. Actually, crater 6 is my diagraming of the Laramide Orogeny, like the Uinta or Bighorn Mountains. Mascons are short mountain ranges that are pulled up when the crater bottom rebounds. The difference in the Sevier and Laramide Orogeny is covered in Chapter 10B of my book. I will define the start of the Flood as below the crystalline basement.
 Have you now recognized the need for a good gravity overlay? There are two addresses for Global Gravity Anomaly. I used the download from UCSD. The reference in the Scripps site gives the background on how it was derived and a little about it. Scripps Institute of Oceanography is part of University of California at San Diego (UCSD) so you can down load the same KML file for Google Earth from either webpage. But, if you want to see the craters, you need to get it.
Sevier and Grand Canyon, Pt 3
 There may be no other plot of ground so often used to illustrate many of the geologic processes espoused in textbooks than the Grand Canyon. Geologist talk about it like they have the processes all figured out. Is it just possible that they have gotten it all wrong? This presentation is going to suggest unimaginable cratering was responsible for everything we see there, from the rocks, the sequence, the faults, and the actual canyon. None of it got there by geological processes we can see happening around us today. We will question if some of the processes even work the way everyone has assumed they worked. Gentle reader, do not be afraid to questions the rocks, the processes, even my model, but above all, question the assumptions both you and I have made. Our God is a God of mystery, but He is also a God of Knowing. And in knowing, He is worthy of our praise.
 In the previous two parts I have covered a little of how I arrived at my model of crater formation, and the cratering events that shaped some of the strata exposed in the canyon. Now we want to understand the cratering events that led to the formation of the canyon.
 Figure 60: Redwall Cavern, a prominent landmark on the river trips is a great place to deal with the ubiquitous red color that coats much of the inner gorge. Many just say that it is Iron Oxide, but do not specify the type. Iron (Fe) has three oxidations states and forms three oxides: rust that requires water in its molecule, magnetite that is black, and hematite that is red. To form hematite requires removing three electrons from the Fe ion, which requires almost twice the energy of removing only 2 electrons (Chapter 12.). If it were rust it would keep forming and flaking off, like rust does on a piece of iron. It did not come from the Supai above that washed down as the rangers try to tell you, because it covered the ceiling of Redwall Cavern, and it could not have washed onto the ceiling all the way to the back of the cavern. Also, the hematite in the Supai Sandstone is trapped as crystals between the grains of silica sand. The black you can see on some of the far wall is not “dirt,” but chemist have identified it as oxides of magnesium, and tungsten, and it requires high temperatures to form also. All of these oxides require very high temperatures, ~1,000 degrees C (1,832 degrees F), to form. Note, the Cavern formed at the same time as the rest of the canyon and all of the other alcoves into the Redwall, which are also covered with hematite.
 Figure 61: It was Aristotle who recognized that streams move material, and Seneca recognized the power of streams to wear away valleys. Leonardo da Vinci believed that valleys were a result of their streams, but Unaweep and Grand Valleys of Colorado and the Grand Canyon are extreme examples of under-fit streams. The water flowing through them could never start to produce the vast amount of erosion that has taken place there. In the Grand Canyon it is made even worse. It is not one channel, but, a maze of side channels covering about 2,000 sq. miles (5,200 sq. km.). I have classified the Unaweep and Grand Valleys as Release Valleys (Chapter 1) from the Unaweep crater. Could the Grand Canyon have the same origin??
 Figure 62: Let’s start with one small but pronounced feature of the erosion, the Butte Fault. It is up to the east, telling us the shear center is to the west. The west side it thrusting up-and-over the east side. Comparing this in a diagram of the expected cratering faults, the only expected movement of earth in a cratering event would be thrust movement, reverse faults, outwards in all directions as a result of shock compression at the impact site. The formation of Normal Compensation faults would be expected as the compression drops down into the Release Valley at the adiabatic conversion site on the inside of the compression wave. Faults are not a matter of plate growth/extension or contraction/foreshortening. Horst and Graben systems and Transverse Faults do not exist (Chapter 19A). There are several things in geology that will have to be relearned, and faults are one of them.
 Figure 63: The Bright Angel-Phantom Creek-Eminence Break Fault is a second continuous linear that Huntoon and Sears first recognized in 1975. It is first seen at the Bright Angel trailhead, and forms the canyon to the river. From there the linear continues following the Phantom Creek canyon out over the North Rim where it corresponds with the Eminence Break on the north eastern edge of the rim. Do linears appear at random (Chapters 3-7)? Or, can their source of shear be traced back to the supposed direction of plate convergence?? Over vast reaches of the Pacific Northwest multiple authors have traced the Euler Pole for several sets of faults. They assume the Euler Pole is a pole of plate rotation, but I find their location of the pole corresponds with my location of cratering centers (Chapter 19). We are finding the same thing, and identifying it according to our different models.
 Figure 64: (A) One map of Butte Fault that may have been taken from an old map or estimated from the terrane. I highlighted their designation of Butte Fault as two linears using corresponding labels to Figure 66. (B) Linears I located in the area using topographic clues, CGRS in white and short concentric linears shown in red. Labels as in Figure 65.
 Figure 65: Craters found to correlate with linears around (A) Butte Fault and (B) Bright Angel-Phantom Creek-Eminence Break Fault. Butte Fault is up to east and Davidson, Molokai, and Salsipuedes craters all center in the Pacific Ocean. Red oval encircles a topographic high parallel to Ipojuca linear (Chapter 15A). The Ipojuca linear extends through Nankoweep Butte, Figure 62B. Ipojuca center is in the southern Atlantic Ocean. Huntoon and Sears identified the Bright Angel Fault as a normal fault (compensation fault) with west side up, meaning its center is to the southeast. I correlate it with the Gulf of Mexico crater. Additionally, they identify it as faulting between the deposition of the Unkar and Chuar Groups. This means that the Gulf of Mexico crater arrived between the Tatanka and Gorda craters. But in fact, the Gulf of Mexico is east of the Tatanka and would arrive first, but its CGRS may not have arrived here until after the Tatanka’s CGRS. This type of associations allow sequence and timing to be established for craters outside of the Grand Canyon.
 Figure 66: Top of the Crystalline Basement under the Grand Canyon and some of the earliest mapped faults (Precambrian). Butte Fault designated in blue as separate linears: (A) CGRS from Molokai crater, (B) CGRS from Salsipuedes crater, (C) CGRS again from Molokai crater, (D) CGRS again from Salsipuedes crater, and (E) CGRS from Ipojuca crater. Bright Angel-Phantom Creek-Eminence Break Fault designated in red. Two portions of the more southerly Mesa Butte Fault also appear to correspond with CGRS from the Gulf of Mexico crater. Faults are often made up of segments from different shear centers that have become associated in the mind of the geologist because they seem to form a continuous line on the ground. This reflects the observation in the Paradox Basin, made by Gay (2012) that faults and other structures exhibit “straight line segments with corners” where they meet other segments. They are largely not one continuous linear.
 Figure 67: What do the Sevier Orogeny and the Alvord crater have to do with what we can now see in the Grand Canyon? Remember the Gravity Map of the farside of the moon? The distinct bull’s-eye appearance of high and low, red and blue, gravity? If cratering did this to the moon, it also did this to the earth. In spite of all the later cratering, we can see that the Grand Canyon (red oval) lays in a broad blue band that extends well beyond the canyon. If it is dark blue, it was filled with a less dense version of the rock. As I have suggested the Alvord crater deposited the Chuar Formation, so that formation in this area is less dense than the alternative. If that formation is less dense, it will be preferentially eroded by the adiabatic conversion forming release valleys in subsequent cratering. What are some of these larger subsequent craters, and what did they each contribute???
 Figure 68: When evaluating what each crater contributed, we have to recognize how the dark blue rings conform to the white rings of that crater. I have already emphasized how the Alvord and Blowout Mountain have a similar foot print and how they both contributed to the Sevier Orogeny. In the Grand Canyon area, the Blowout Mountain produced a couple of additional small up-thrust. I suggest that these up-thrust were smaller because they were working against the low gravity left in the area by the Alvord. The blue ring of the Winnemucca crater extends well beyond both ends of the Grand Canyon’s area. Again the dark blue seems to hug the white rings, strongly indicating that it is a low gravity ring of the Winnemucca crater. The white ring just beyond the canyon did thrust up some mountain ridges, so it would be a compression wave, and the canyon just behind it would be part of the associated release valley. The general line of the canyon appears to mimic the curve of the Winnemucca’s rings.
 Figure 69: The Chilili and Gandy craters have one very important aspect in common, both of them include the Grand Canyon within their original crater rim. We saw on the moon’s highlands, the continent of the moon, all of the craters, except the mascons in the largest, have blue centers. The fallback into the crater leaves a less dense lithology. On the Chilili crater the third ring displaced the mountain ridge down Baja California. A larger view would show that slight arc certainly originally aligned with California’s Sierra Nevada, further to the east. The original crater ring on the Gandy crater is outside the edges of the image.
 Figure 70: While the Grand crater included the Grand Canyon within its original crater rings, both the Grand and Navajo craters also contributed to the release valley the Colorado River flows through in the Canyon. With the Grand crater the white arrows point to sections of the river channel that follows the rings. The Yellow arrows indicate other locations that it contributed to the gravity pattern, but the river does not follow it. The river channel southwest of both Kaibab Plateau (K) and Shivwits Plateau (S) are release valleys from Grand crater, while the raised plateaus themselves were produced by the Navajo crater. The inner ring of the Navajo crater is especially easy to see (red arrow) as it is a ridge of high gravity making almost a half-circle. Walhalla Plateau on the southeast pointed end of Kaibab Plateau. It is a nearly isolated plateau surrounded by steep slopes to the Colorado River. I propose it remained a plateau because it was harder, denser because of the added energy put into it by the Navajo crater. Its added density may not reflect different mineral content, but only denser, more tightly packed particle matrix.
 Figure 71: The Alaskan crater produced a CGRS just southeast of the white arc that highlights the release-wave response on its backside, The CGRS is accentuated by a second arced linear to the northwest. The red line indicates the shock/compression ridge and the dark blue linear behind it was produced by the following release/expansion wave. The Aguj de Anahuac crater being a smaller crater than the Alaskan, I assume arrived a couple days later. It left a CGRS in a very similar location, but I think the exact location of its release valley better corresponds to the low gravity area connecting the Kaibab and Shivwits Plateaus. A careful examination will show the low gravity linear that makes this central portion of the canyon also had an expression on both the Kaibab and Shivwits Plateaus forming small valleys in its paths across them. This expression on the plateaus is not a feature of the Alaskan craters linear. The Alaskan CGRS probably arrived earlier about the time of the Chuar or Tapeats, while Aguj de Anahuac arrived about the time of the Redwall or Kaibab and left a release valley much higher in the strata.
 Figure 72: Now that we have accounted for some of the sedimentary layers from cratering, how did the canyon form? Could it also be cratering? Some readers will object, but I place the entire canyon as a Release-Valley Canyon formed with the help of the Flagstaff crater. The Flagstaff crater shows up as the blue ring inside the first white ring on gravity. In the Grand Canyon vicinity, the blue ring is diverted to the Canyon which is a dark blue, very low gravity path. That there is little indication of the Flagstaff crater at this resolution on Landsat is not surprising.
 Figure 73: Do you see the similarities between the dark blue path of the Grand Canyon and this wiggly canyon I showed you previously in Mare Orientale? The low gravity paths were already formed by the individual adiabatic responses of all of these craters and probably even more. The Flagstaff crater, because of its size I would place late in the 40 days of cratering, maybe between days 35-38. The adiabatic conversion from the Flagstaff crater would have blown much of the sediments out in one puff, and the fast moving water flowing all the way through it would have quickly washed any remaining loose sediments towards the California coast. Some of them may have dropped out of suspension, but I would not look for a “California River” as some papers have proposed. This flow coastward, would have taken place continuously for several days at this time, and would have been rapid but not highly erosive. Note: many of these lines account for the direction of faults within the canyon, and would make an interesting study.
 Figure 74: Let us look again at the Flagstaff crater’s rim in topography. The edges of the “crop circle” (“Gulf of Mexico to Turner Gulch” slide show) are marked with the inside end of the yellow lines. I do not believe the “crop circle” would have been recognized if the Flagstaff crater had not been identified first, but it is real. How many other obvious indications of craters occur but are ignored because we are using a different model? One you have seen some of it, it becomes obvious.
 James was writing about the need to practice what we know in our spiritual lives, but it is not an absurd stretch to apply it to everything we know. Is knowing enough? The picture is a poor pun and a tired joke, but you now have new information. Think, what are you going to do with it? Discard it because it can’t possibly be true? Investigate it more? Ignore it because you don’t want it to be true?
 Figure 75: Can you apply what you have learned to this figure and locate comparable topographic clues in this region for these CGRS. I see clues for each, and clues for many, many more.
 Figure 76: One other form of erosion which played a major role in the canyon we see today was small erosion craters that continued throughout the Flood year and into the Post-Flood period. This probably involved secondary impactors which were chunks of lithology that was shot into orbit by the first LARGE impactors. Secondary impactors may have continued till Sodom and Gomorrah. Horseshoe Mesa is a famous landmark with its horseshoe shape and two arms. Can you see the many fracture linears with dark plant growth. How many of them are indicated in the earlier image for cratering fracturing and the Flagstaff crater? At the end of its west arm . . . . . . .
 Figure 77: Is a series of circular lineaments in the plateau’s surface. Only the middle of the circles are on the Plateau surface, but I see them very clearly on Google Earth, and they are equally visible on the ground surface. It would be an interesting study to compare limestone in the circles and that more distant. In the second yellow ring, where the purple arrow points on the “thumb” peninsula some very curious minerals are exposed.
 Figure 78: This is the trail out onto the thumb. Around the small tree, along the path and in the distant wall barite is visible. If you ever get down there, the barite is easy to identify. It is white, like cloudy quartz, but four times the density. It feels very heavy. The geologist tell us, barite replaced the quartz chert in these locations. How does chert/quartz melt out of the limestone and make a void barite can fill? It is only about a 6 foot wide band of barite with the quartz chert still present on either side. I suspect either the compression wave or release wave vaporized the quartz in this ring and mobilized the Barite. It would be a great project for some chemistry major’s thesis.
 Figure 79: This obvious crater is not so obvious from the ground. It is referred to as Phantom Creek Valley, and I believe I have camped in an overhang on the south wall of the crater. I wish I had known about its total shape when I was there. I spent a day climbed all over it. This would be a great location to see specific characteristic of secondary craters. Note the red near the center of the crater. I will assume it is cutting down to the liver red Hakatai Shale. The Hakatai shale is a far reaching red formation, like the Supai and Moenkopi formations. They are red from distinct red crystals of hematite scattered among the white sand and gray shale particles. Distinct hematite crystals require ~1,000 degrees C (1,832 degrees F) to form in the air. They cannot grow between the sand grains. That is why I propose a vapor condensate to form the sediments in the air, not erosional degradation.
 Figure 80: Looking at the area surrounding that circle in Phantom Creek, I see it as only one of many circles. Should I be misunderstood, I am saying much/most of the topography is shaped into circles produced by secondary impacts that makeup the majority of erosional craters. They continued landing after the 40 days, until the days of Sodom and Gomorrah. This would produce the soil for the earth, but could also produce major post Flood catastrophes.
 Figure 81: One more look at Hematite. This is the south edge of the Tonto Platform with Cheops Pyramid and Utah Flats in the background. Something turned the normally white Tapeats Sandstone alternating layers of red and white, in a circular shape. Is it the small center of a secondary erosional crater? I believe so.
 Figure 82: Many of the side canyons to the Colorado River are still banked with large deposits of “river rounded” cobbles. I would suggest from the image that many are rounded not from tumbling but ablation and show good indication of a heat rind from going through and being spit-out from the adiabatic conversion. I would suggest this happened in the formation of a release valley. The release valley we now call the Grand Canyon.
 Figure 83: In a rare glimpse inside a heavenly court room where “gods” set in condemnation before God as He recites their failing, Psalm 82 says, because of their actions “all the foundations of the earth are shaken.” Not covered with water, or filled with fire and smoke, although we have seen that is true in other places, but the very foundations of the earth/ continental shelves are shaken. If we are not going to believe this is pure hyperbole or metaphor, it would take quite a large force. That force would be consistent with impacts of the size I am suggesting. Psalms 29 qualifies as a scene out of such a courtroom: The Psalm is not addressed to the Lord, but about the Lord. It is addressed to the “heavenly beings”/ mighty-son. Assuming, Jehovah includes the portion of the Godhead called the “Son/ Jesus,” we must assume an angel (“sons of God”) is being addressed. Because he is mentioned as a “mighty” son, I will suggest a specific angel, Lucifer, because he is commander of other angels. He is being instructed to give Jehovah glory and strength, which Lucifer refused to do when he said, “I will be like the most High (Isaiah 14:14).” Preferring KJV in verse 7, the voice of Jehovah “divideth the flames of fire.” “Flame” not only denotes the burning, but also refers to the “head’ of a spear, the piercing part. Blazing spears are acting upon, piercing, the many waters, and we can reason from their still burning that the waters did not quench them. “Divide” is the same word for the priest dividing the sacrifice, each portion for its specific use. Not that we want to appeal unnecessarily to a miracle, but the “flames of fire” did not land where they wanted, but where the voice of the Lord directed them “over many waters.” Jehovah makes the whole Earth shake and skip, pierced with flames of fire. That is the Flood as Noah and David knew it.
 Figure 84: But, do I presently have an answer for all of the geologic question? No, but I have enough that I think my model is on the right track. The more details I find, the more answers I can supply. Our Lord’s handiwork always shows in the details. “When I consider the heavens, the work of thy finger, the moon and the stars that thou hast ordained . . . . What is man that thou are mindful of him, and the son of man that thou visited him . . . .?”
 Once again in the words of David, Psalm 29: “The voice of the Lord is over the waters; the God of Glory thunders, over many waters. The voice of the Lord is powerful; the voice of the Lord is full of majesty. The voice of the Lord breaks the cedars; the Lord breaks the cedars of Lebanon. He makes Lebanon to skip like a calf, and Sirion like a young wild ox. The voice of the lord divides the flaming arrows. The voice of the Lord shakes the wilderness; the Lord shakes the wilderness of Kadesh, The voice of the Lord puts the deer into the pain of birth when its not its time, and devastates the forest, so that in Hs temple all cry, “Glory”. The purpose of the Flood, in my opinion, was to destroy the work of angels with man in the Nephilim Affair, and form a world in which man could once again say, “Glory to God.” Glory to God!
Gulf of Mexico to Turner Gulch
 The Gulf of Mexico Crater is one of the larger, and most thoroughly studied portion of geology in the North American Continent. As a major source of hydrocarbons, there has been much discussion of how it was formed, and how all of the petroleum products got there. At the other end of the size scale, the Turner Gulch crater forms a part of the surface of the Uncompahgre Plateau of Colorado and Utah. While the Gulf of Mexico crater tells about conditions when cratering started, the Turner Gulch tells about conditions when cratering ended.
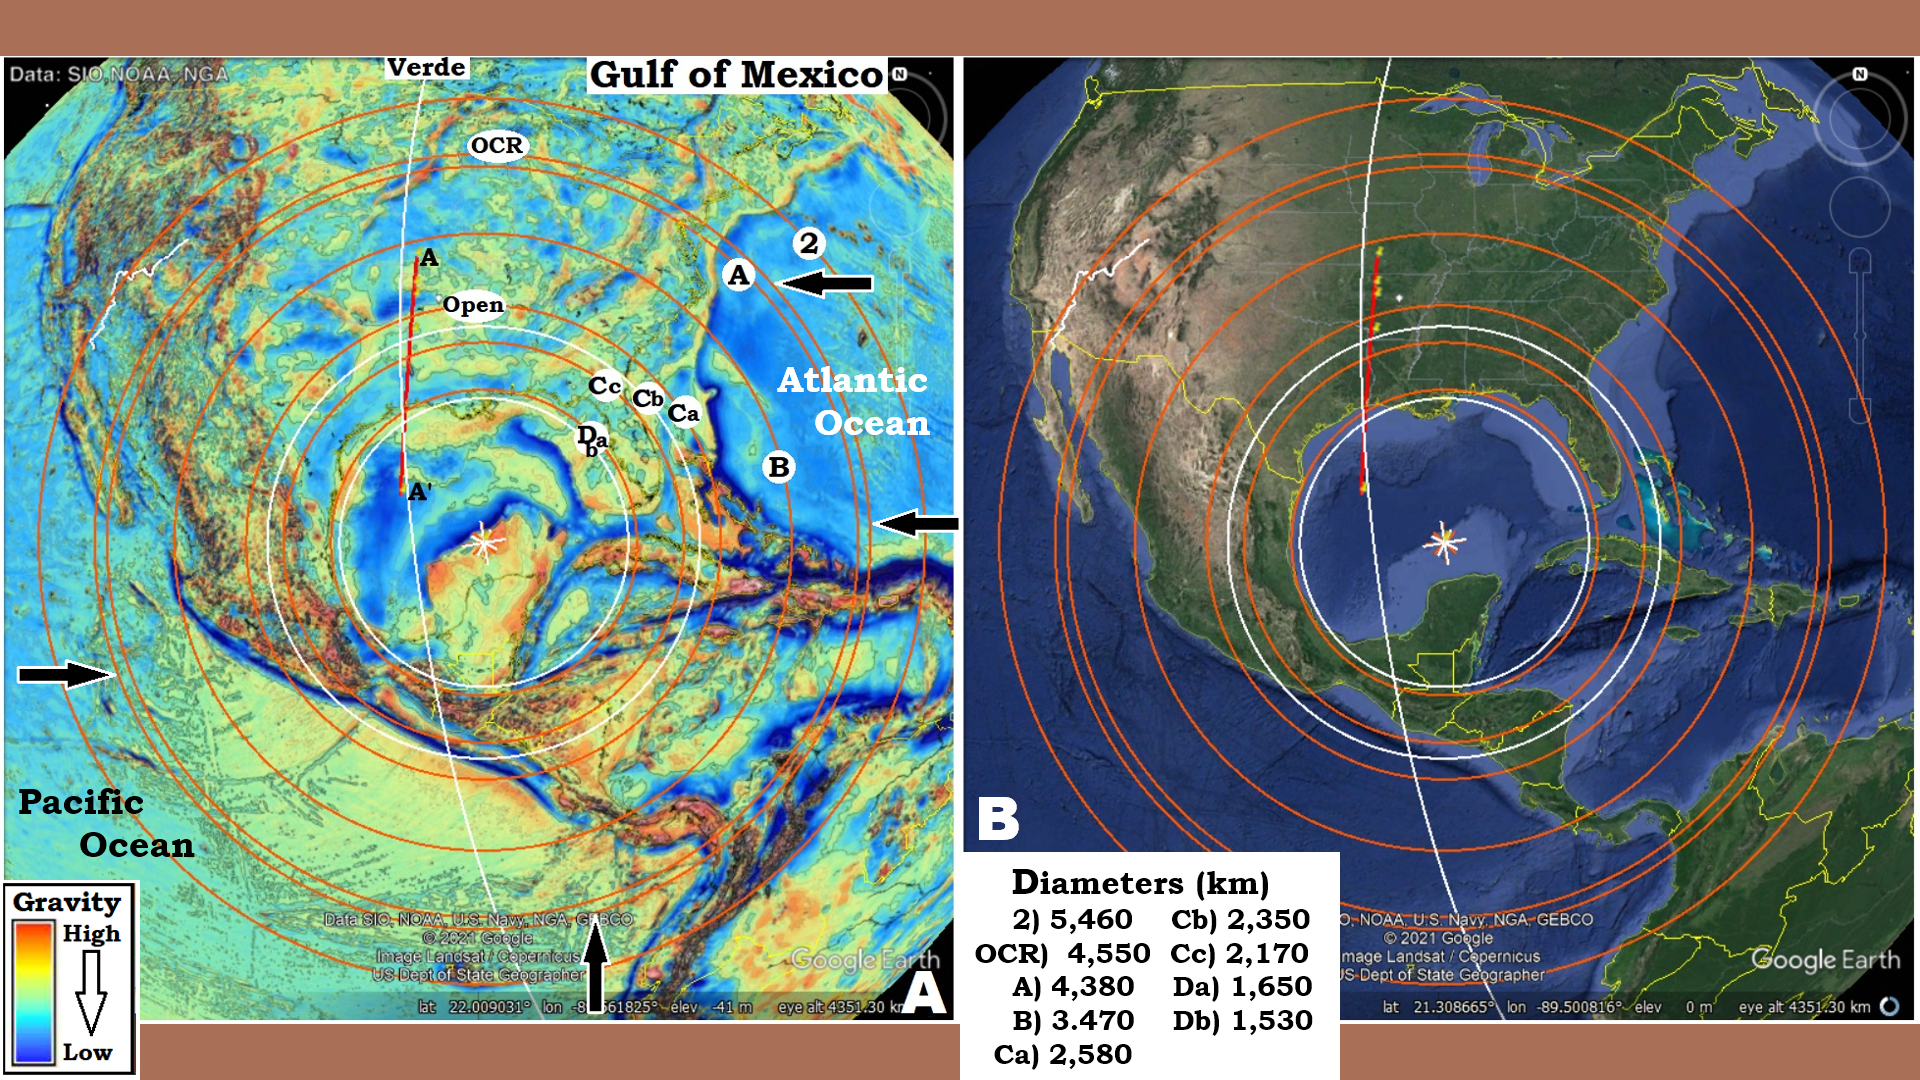 Figure 1: Trying to find the dimensions of the Gulf of Mexico crater was a bit of a challenge, because the gulf itself seems such a logical choice. It is reasonably round, and at over 1,500 km/930 miles in diameter it would be a fairly large crater by earth’s standards. But, when I located the image of the Sabine Block, Figure 2, in the position A-A’, reaching past the Open Ring (Cc) I figured that Cc-ring must be the crater rim. However, when looking at the Global Gravity Anomaly Map from Scripps (2014) the portion of the Original Crater Rim (OCR)-ring between the two pairs of black arrows became obvious. In the Atlantic Ocean a very distinct darker blue ring, low density ring, fills between A-ring and B-ring. Immediately under A and B-rings themselves are a higher density ridge shown by the lighter blue. In the Pacific Ocean between A-and B-rings is a broken blue gravity pattern, but it is lower gravity than the much more yellow B-ring. And it can be seen that the A and B-rings define much of the yellow arced area that extends south from Mexico. The Gulf of Mexico crater provides a reason for the distinctly denser gravity pattern over this area of the ocean’s floor. White arc overlaying the red line (A-A’, line of Sabine Block section) identifies a Concentric Global Ring Structure (CGRS) centered in the Verde crater in the eastern Atlantic Ocean, near northern Africa, that I believe defines the physical shape and location of the Sabine Block, Figure 13.
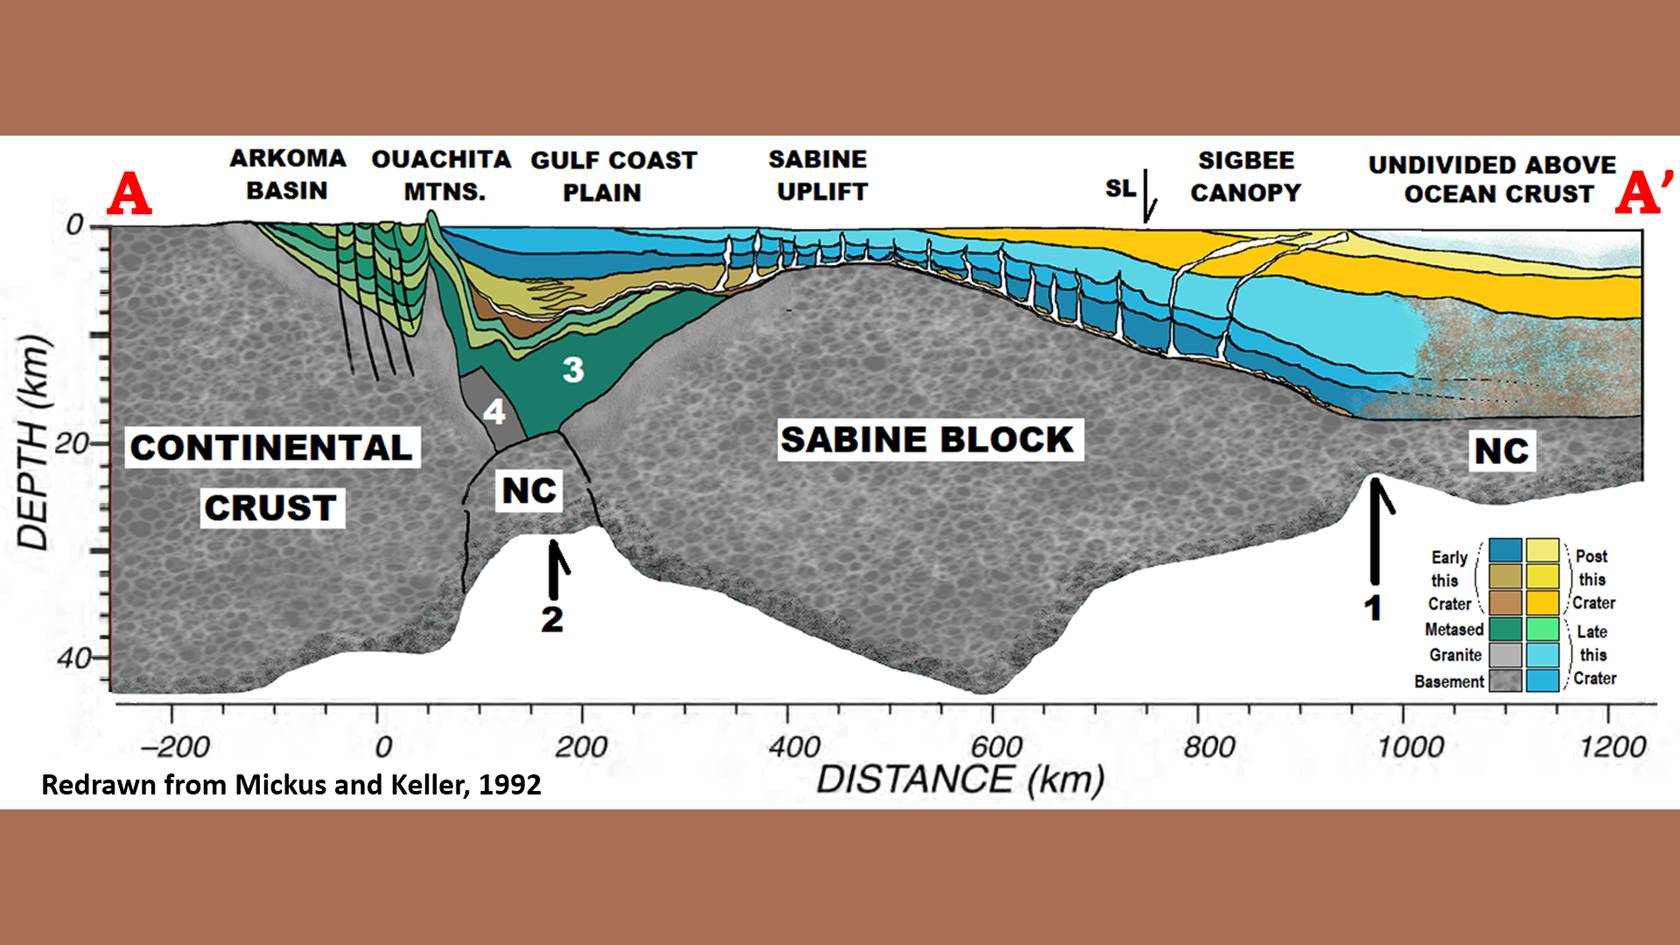 Figure 2: Cross section of the Sabine Block roughly down the border between Texas and Louisiana (A-A’ Figure 1) that encouraged me to see the Gulf of Mexico rings further to the north. Then plotting it on gravity map allowed me to see the larger context of the entire North American Continent. The Sabine Block is a chunk of continental crust that has been broken off. If the gray peak of granite (gneissic) core under the Ouachita Mountains and block-4 had arrived later, visually the Sabine Block might have directly fractured off the continental crust and floated south on the more viscous mantle surface. But, what could have broken a 40 km thick by 800 km long block of rock loose? It had to happen before any significant amount of the sediments were deposited. Did the Gulf of Mexico crater produce a ring-fault that split it off? The division does not continue around towards Texas. In fact, a sharp split occurs below the Texas Salt Basin, which is assumed to be part of the Grenville Orogeny for the Plate Tectonics Model forming Earth’s geomorphology (See pdf: GoM-1-Grenville Orogeny never happened). Although there are some ridges and gullies descending along the gulf coast of Texas, there is not another loose block near this size.
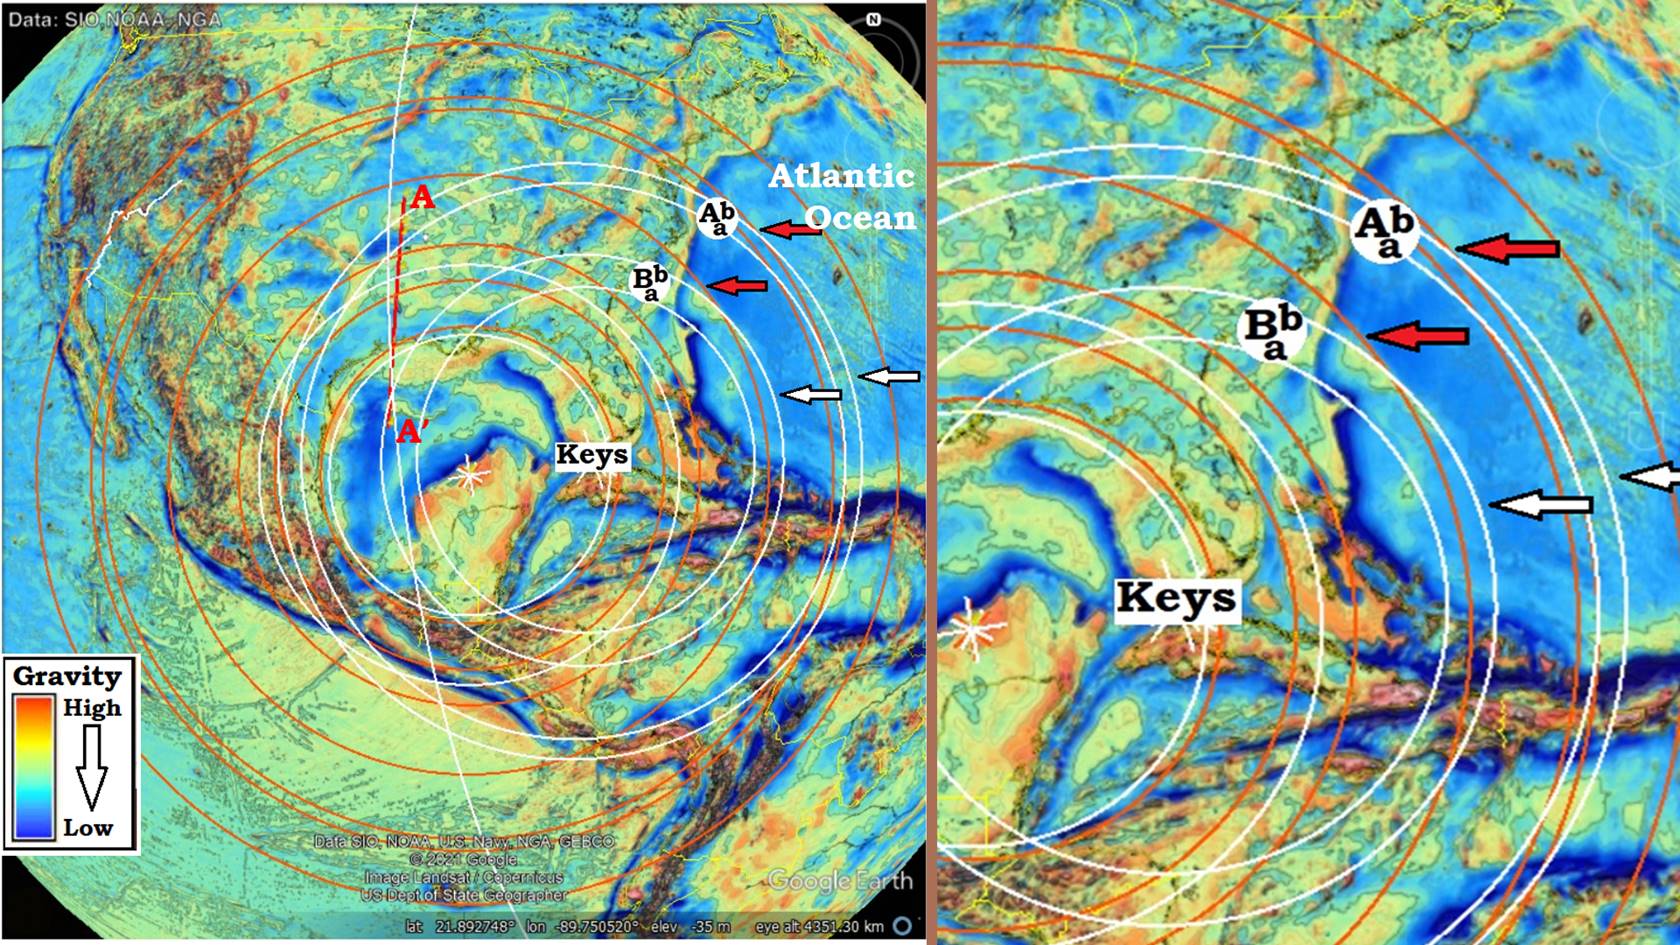 Figure 3: Additionally, the geology of Florida is not like the rest of the bordering gulf structure. The cratering process did not shear it off in a slope, but instead seems to have left it as a block. The overlapping of the Bermuda crater (see slideshow: The large craters that formed North America) could account for some of the differences, but after searching, an additional earlier crater was located, This earlier crater, the Keys crater, left heat in the substrate that changed the way the later Gulf of Mexico shaped the crater edges in this area. Recognizing the Keys crater requires careful separation of the clues. In the Atlantic Ocean the red arrows point to slightly greater density rings of the Gulf of Mexico crater, while the white arrows show slight deviations of higher gravity that comes from the Keys crater. Compare the same area in Figure 1 to see the deviation when not obscured with circles.
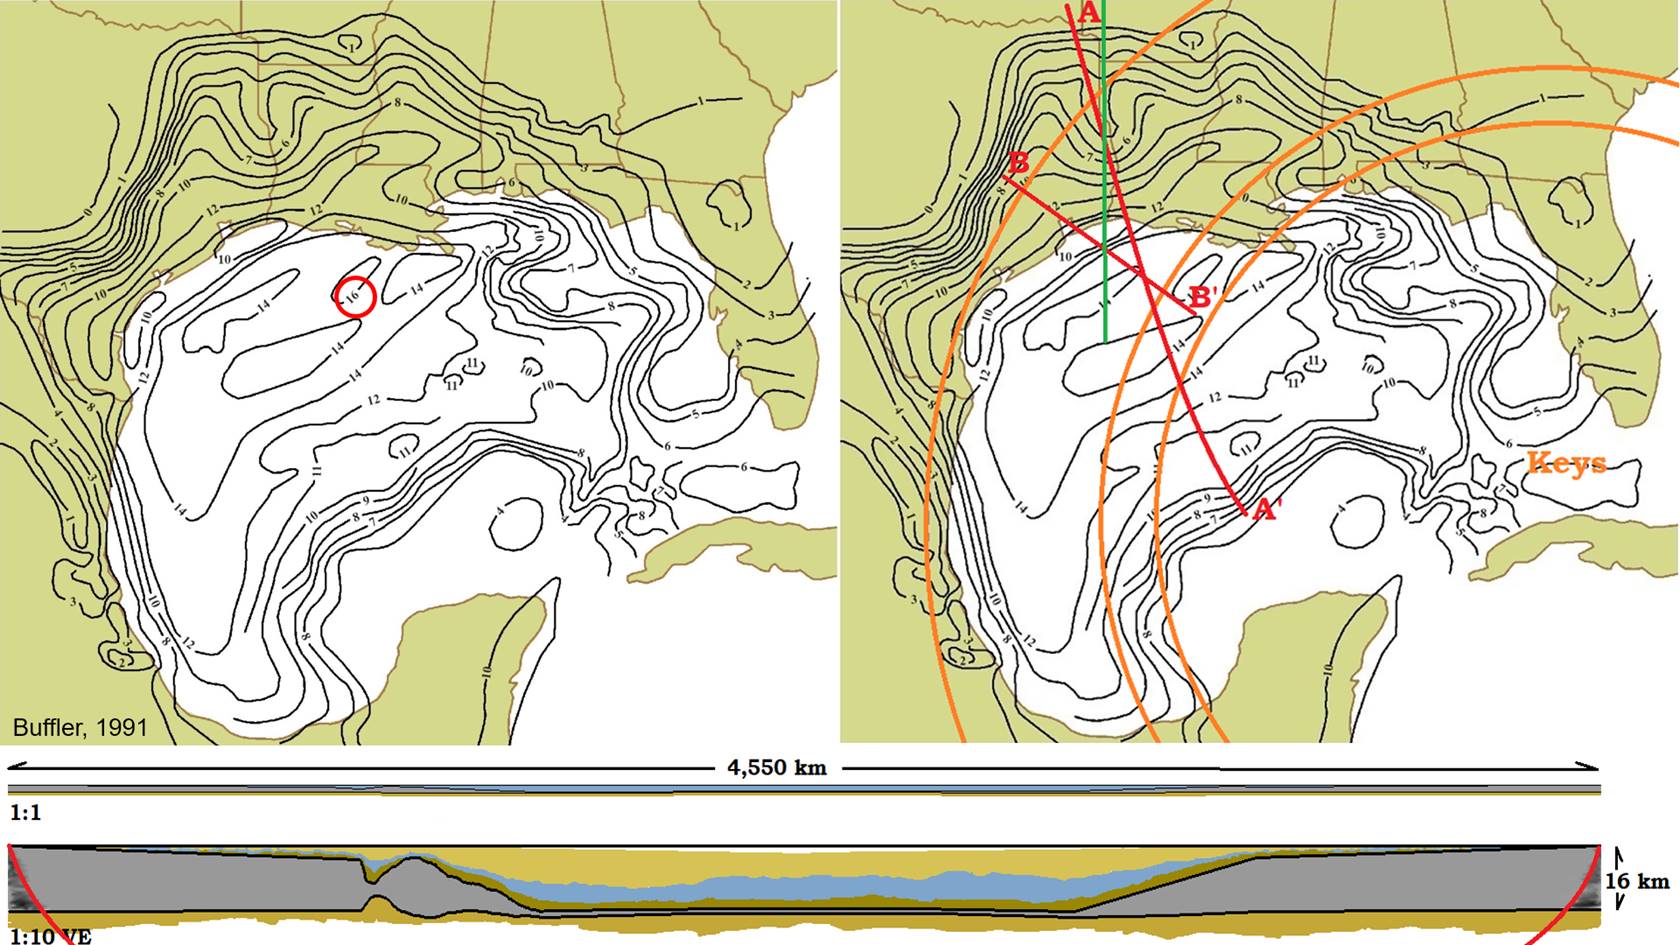 Figure 4: Looking at the surface of the basement as determined by welling drillings, Buffler produced a topography map of the bottom of the excavated bowl of the Gulf of Mexico. The lowest depth (~16 km/10 mi) is part of the release-wave ring of the Keys crater. The Green linear is where the cross section of the Sabine Block was measured, but I propose the raised linear under the red arc (A-A’) suggest the actual structure might be an arc formed by a CGRS from the Verde crater (Figure 1). The outer red ring/annulus from the Keys may be responsible for splitting the Sabine Block off on its west side from the main Continental crust (Figure 13). Combining the 4,550 km/2,830 mi diameter with the 16 km/10 mi depth and basin shape of the bowl is shown at 1:1 ratio in a generalized original section, and with a vertical exaggeration of 10 times to accentuate the bowl shape. This is not the crater shape most people would expect from cratering models often offered. The model by Shoemaker (1974) (Chapter 8) and still used by NASA, based on an subsurface nuclear explosion, suggest they need to examine more actual craters. Which is the point of this slideshow.
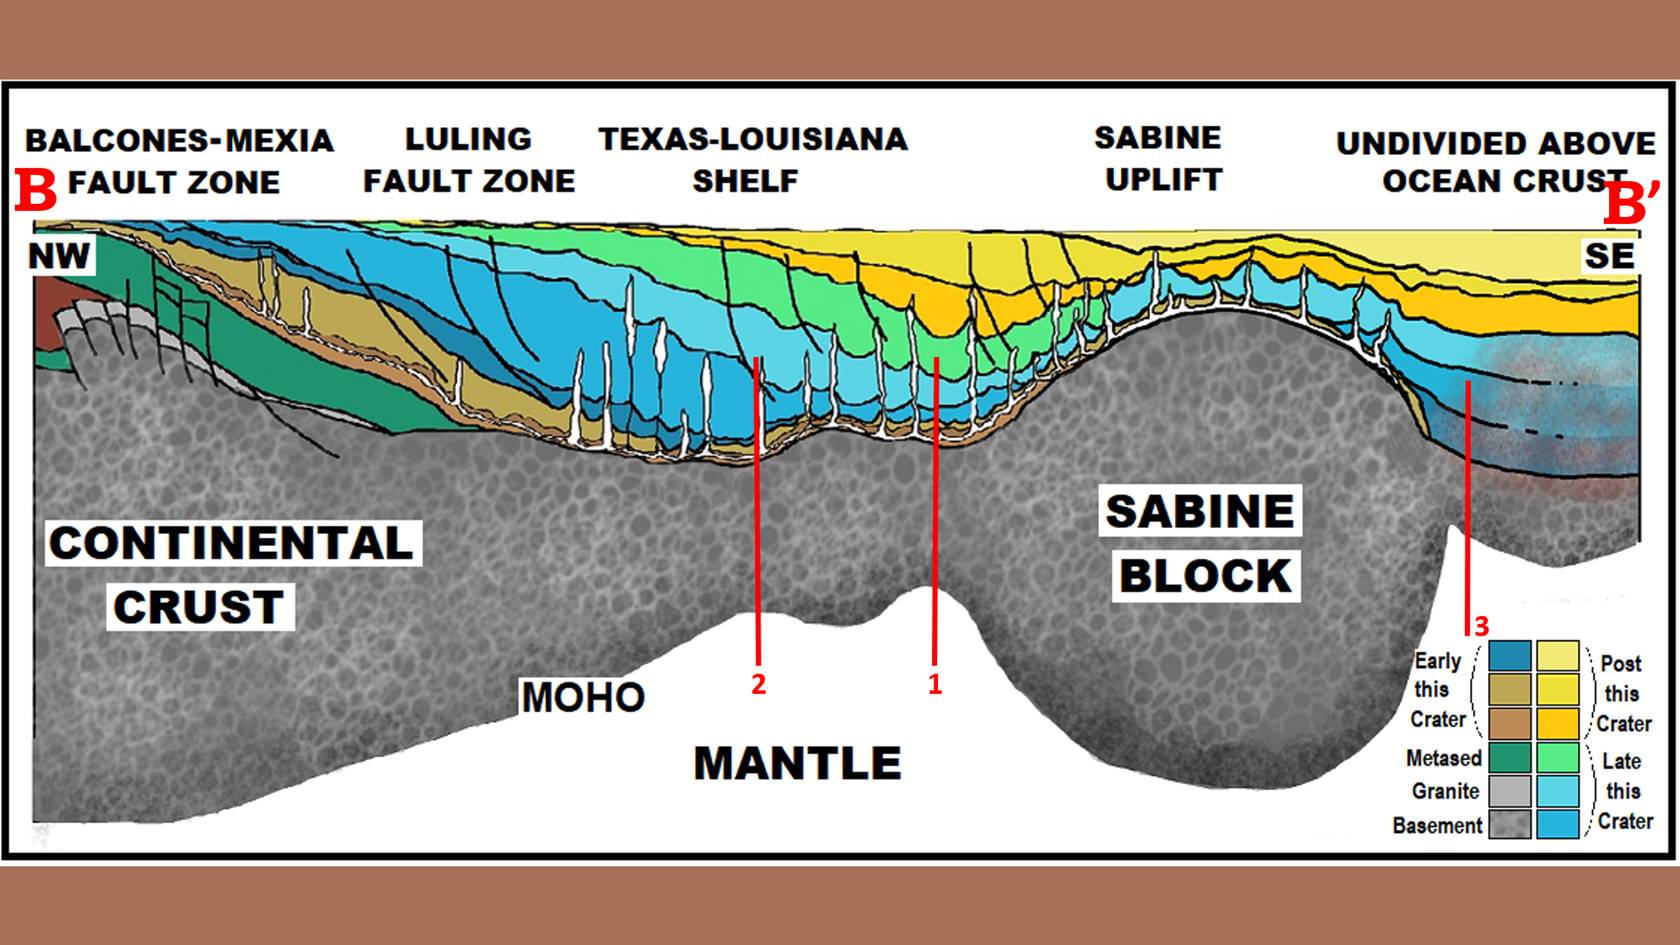 Figure 5: A section from Mid Texas into the Gulf across the Sabine Block. (Linear B-B’, Figure 4). Red linears 1-3 show possible locations of faulting from the Keys crater that might have split the blocks loose at multiple locations. Or they may represent multiple fracturing events from multiple other craters. One section does not give us enough information to differentiate between choices.
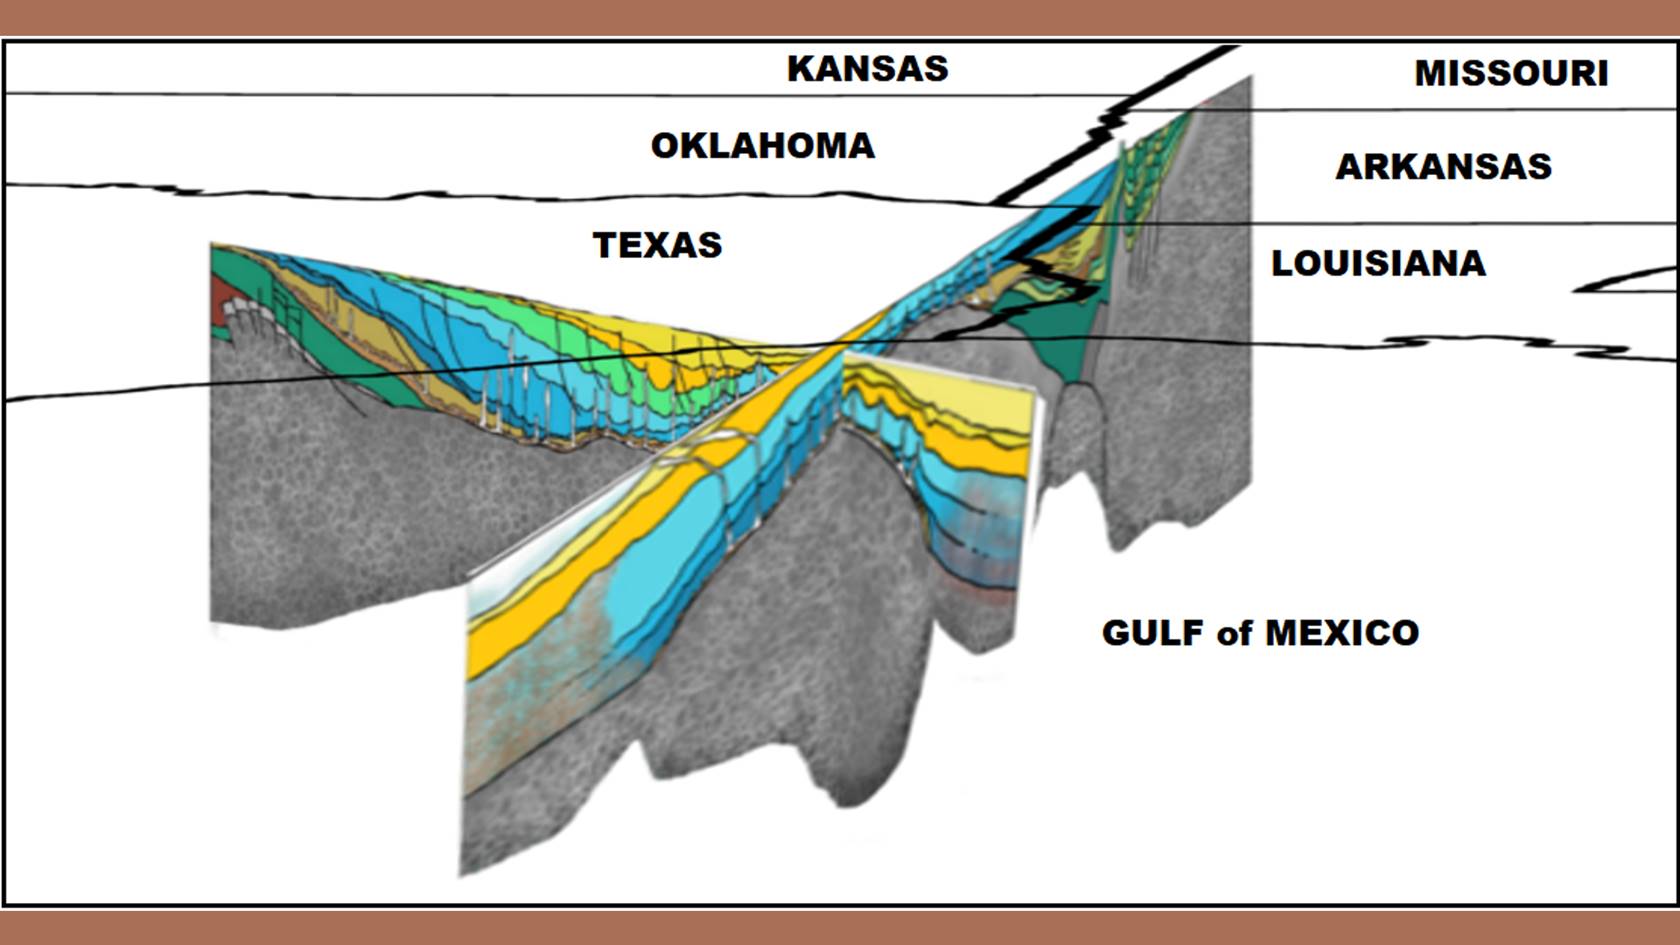 Figure 6: When both Figures 2 and 5 are combined obliquely, we get more of an idea of the actual shape of the Sabine Block in the edge of the Gulf of Mexico cratering bowl.
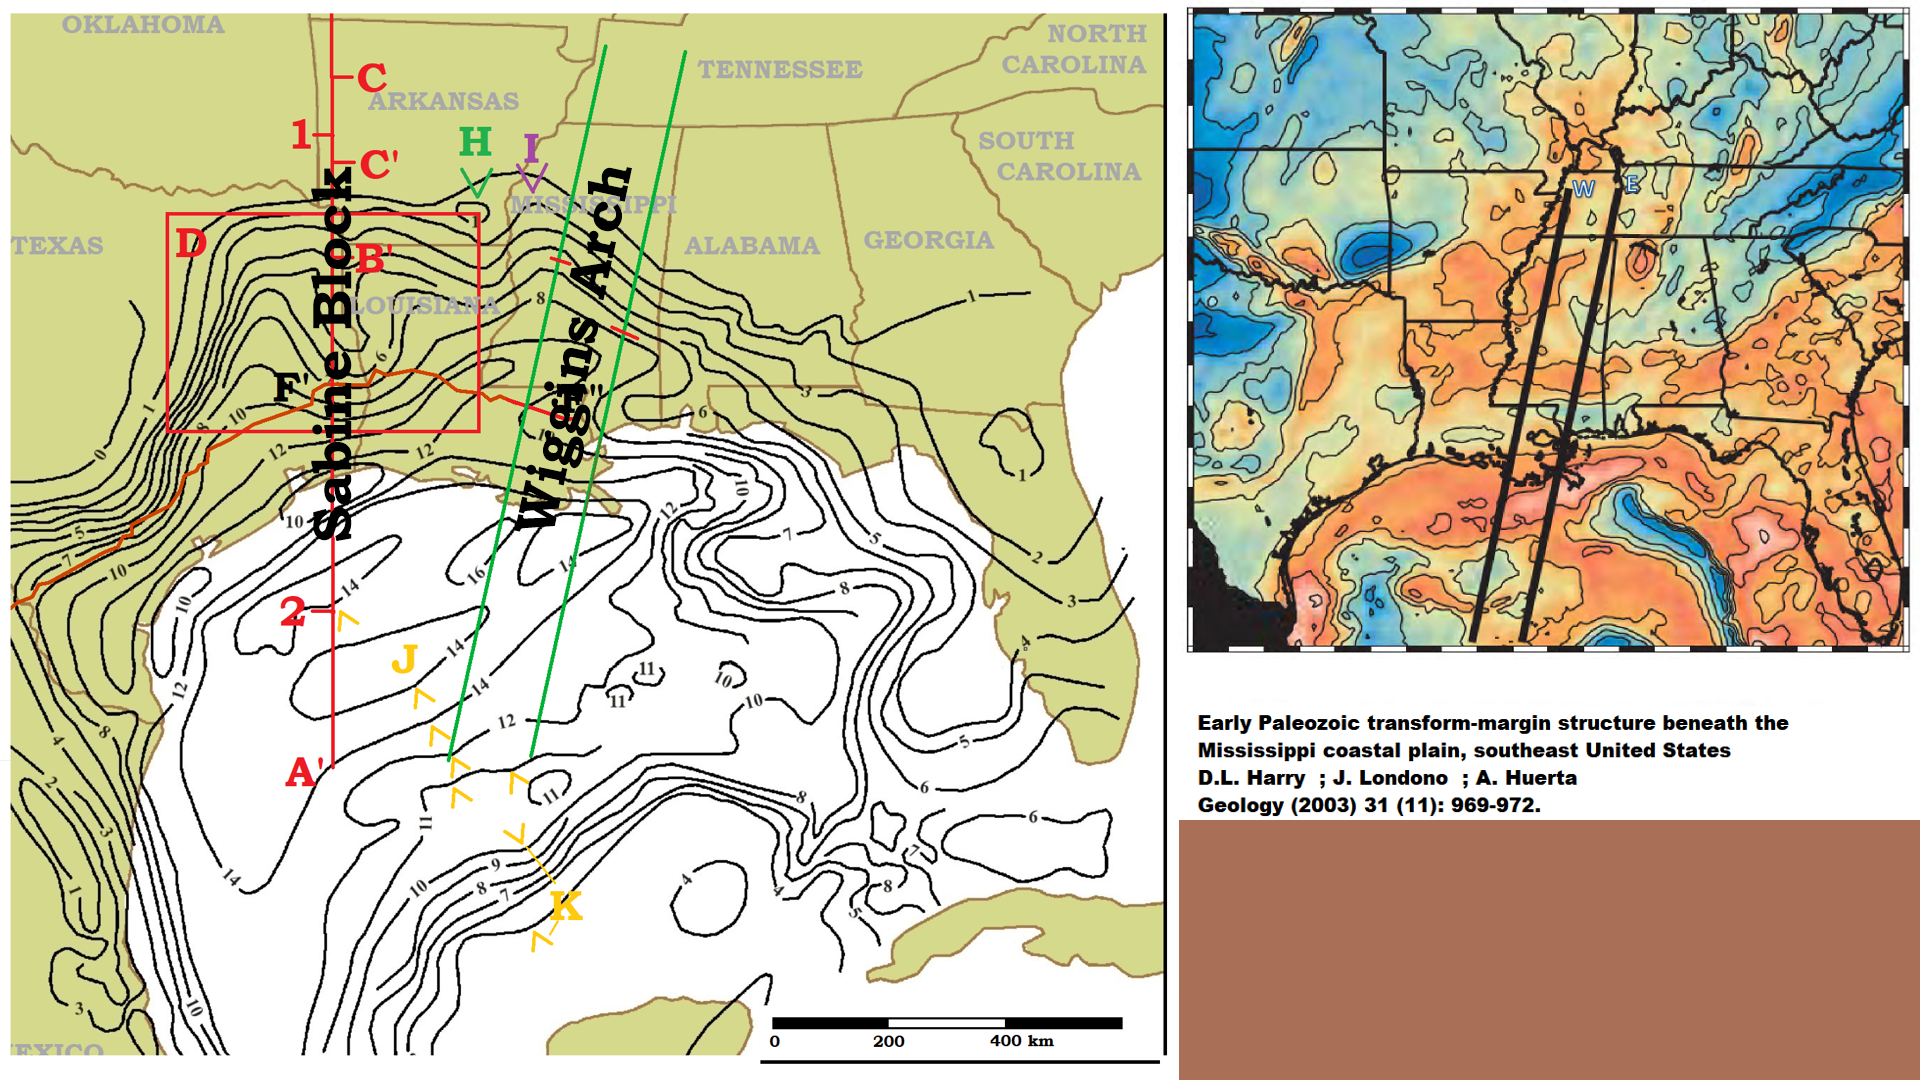 Figure 7: But, the Sabine Block is not a total peninsula sticking out into the gulf. It is attached to the Wiggins Arch structure extending across Mississippi and possibly Alabama.
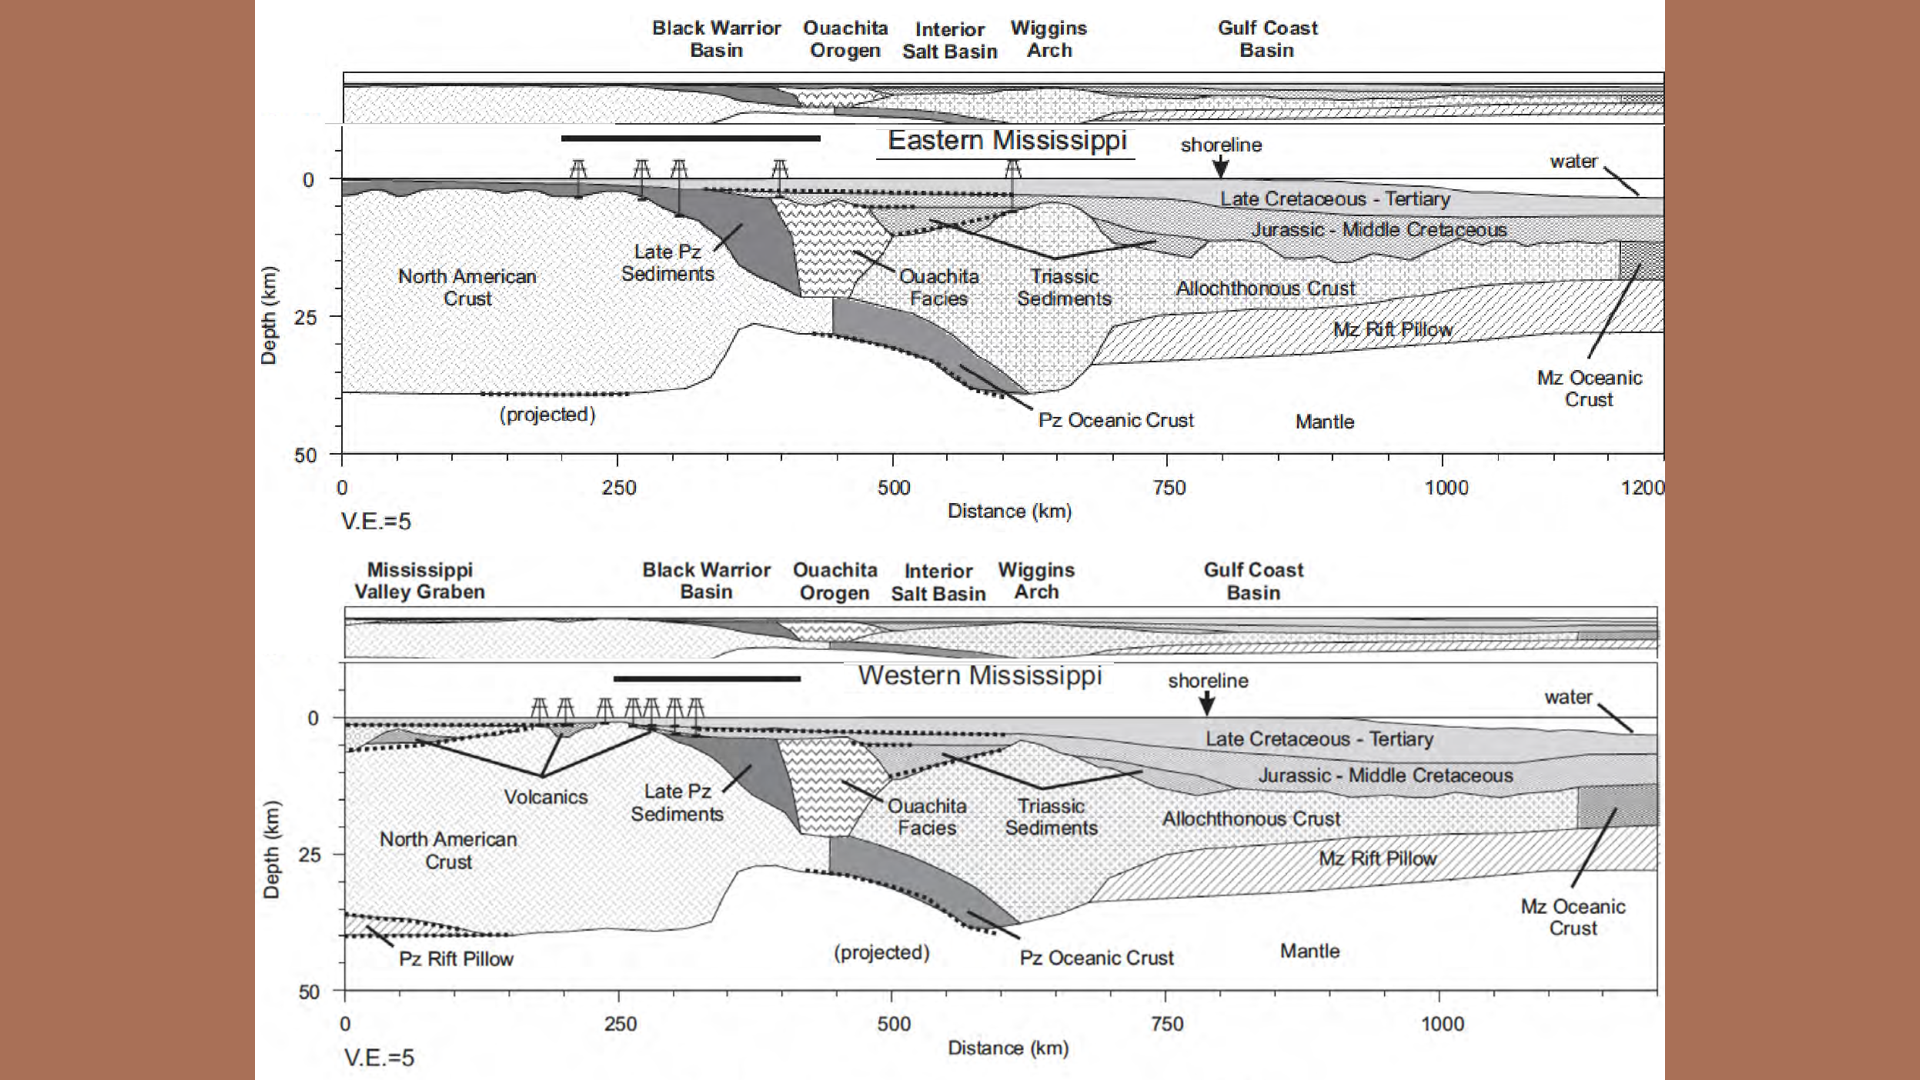 Figure 8: Here are two sections through the Wiggins Arch. They have roughly the same profile as the Sabine Block. As they carry that structure towards the Keyes crater, I propose they all brock off in the same event prompted by the lithologic change produced by the earlier Keys crater and all were split off by the following Serranilla crater.
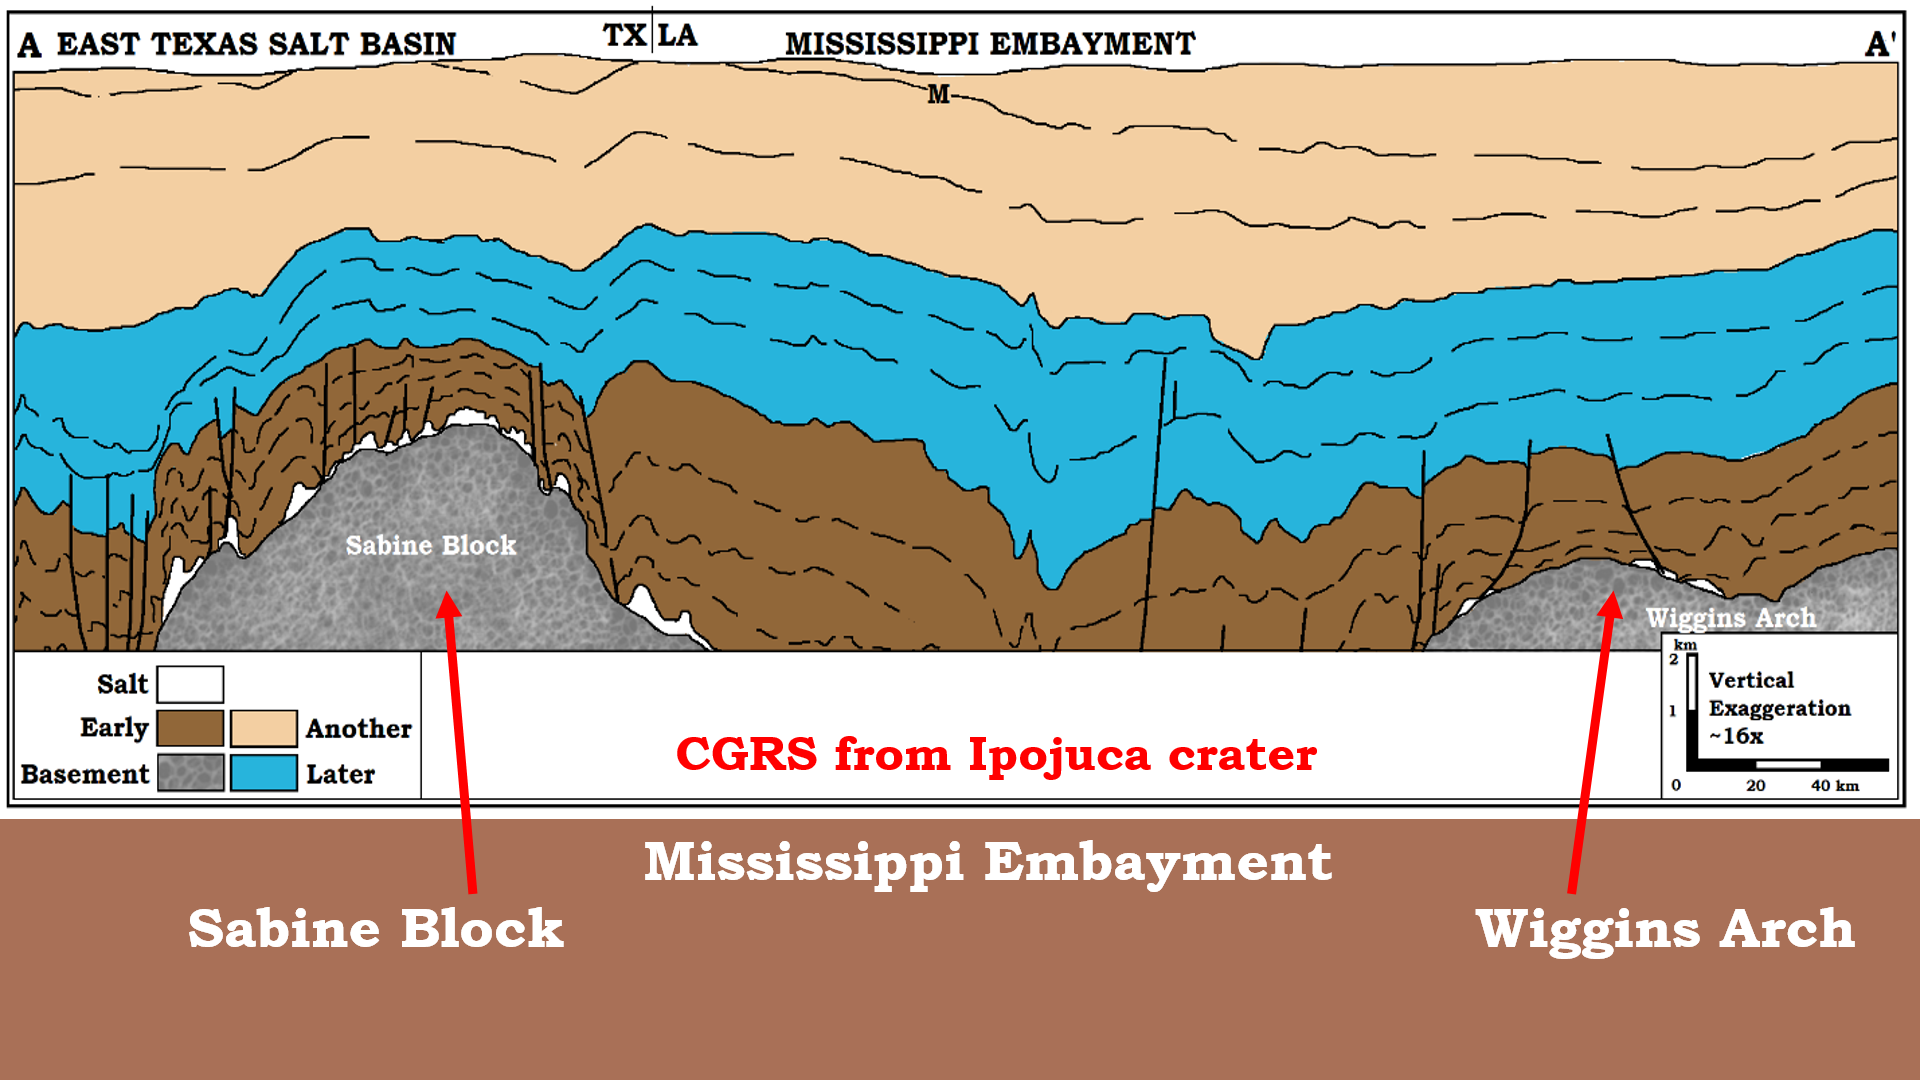 Figure 9: Between the Sabine Block and the Wiggins Arch occurs a trough known as the Mississippi Embayment. It extends up the path of the Mississippi River’s thalweg past the joining of the Ohio River. This thalweg is a CGRS Release Valley from the Ipojuca center in the southern Atlantic Ocean (Chapter 15A) and can be traced into Saginaw Bay and through Lake Huron into Ontario and Quebec, Canada.
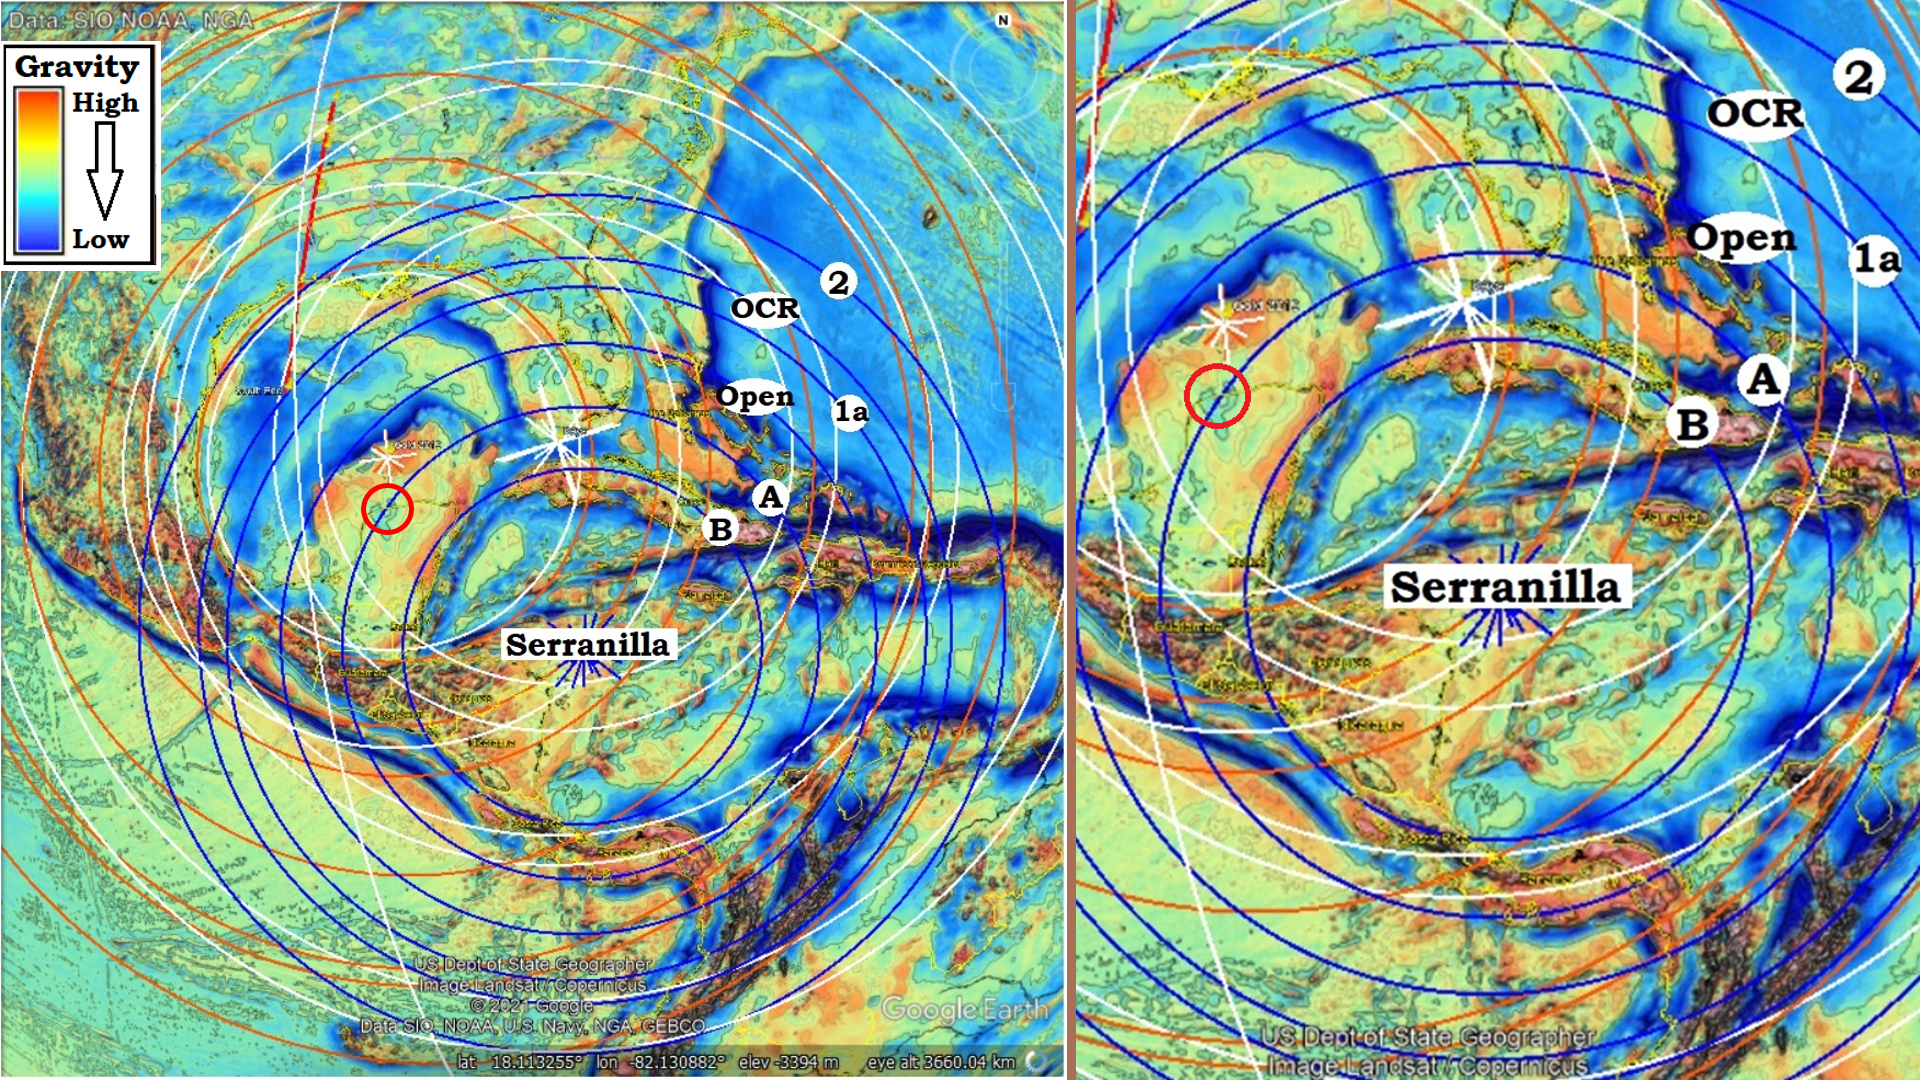 Figure 10: If the Keys crater caused the Sabine Block and Wiggins Arch to fracture across the bowl of the Gulf of Mexico, what caused them to fracture on their northern end off the Continental crust of North America? I will propose it was the formation of the Serranilla crater that spans from the Yucatan Peninsula to South America, and is responsible for forming much of the Caribbean Ocean. The Serranilla crater forms the arc of mountains that rim the northern coast of Cuba, from the Sierra de Los Organos to the Arch de Camaguey, although later smaller craters have made major contributions to the up-thrust final form. The Mayan Mountains of Yucatan and Belize carry the arc to the south. While the small red circle, the Chicxulub crater, is credited with the Iridium layer and much of the Late Cretaceous to Paleogene lithology of the Gulf Of Mexico region, I propose the lithology and accompanying changes were due to the formation of the much larger Serranilla crater, not the tiny Chicxulub.
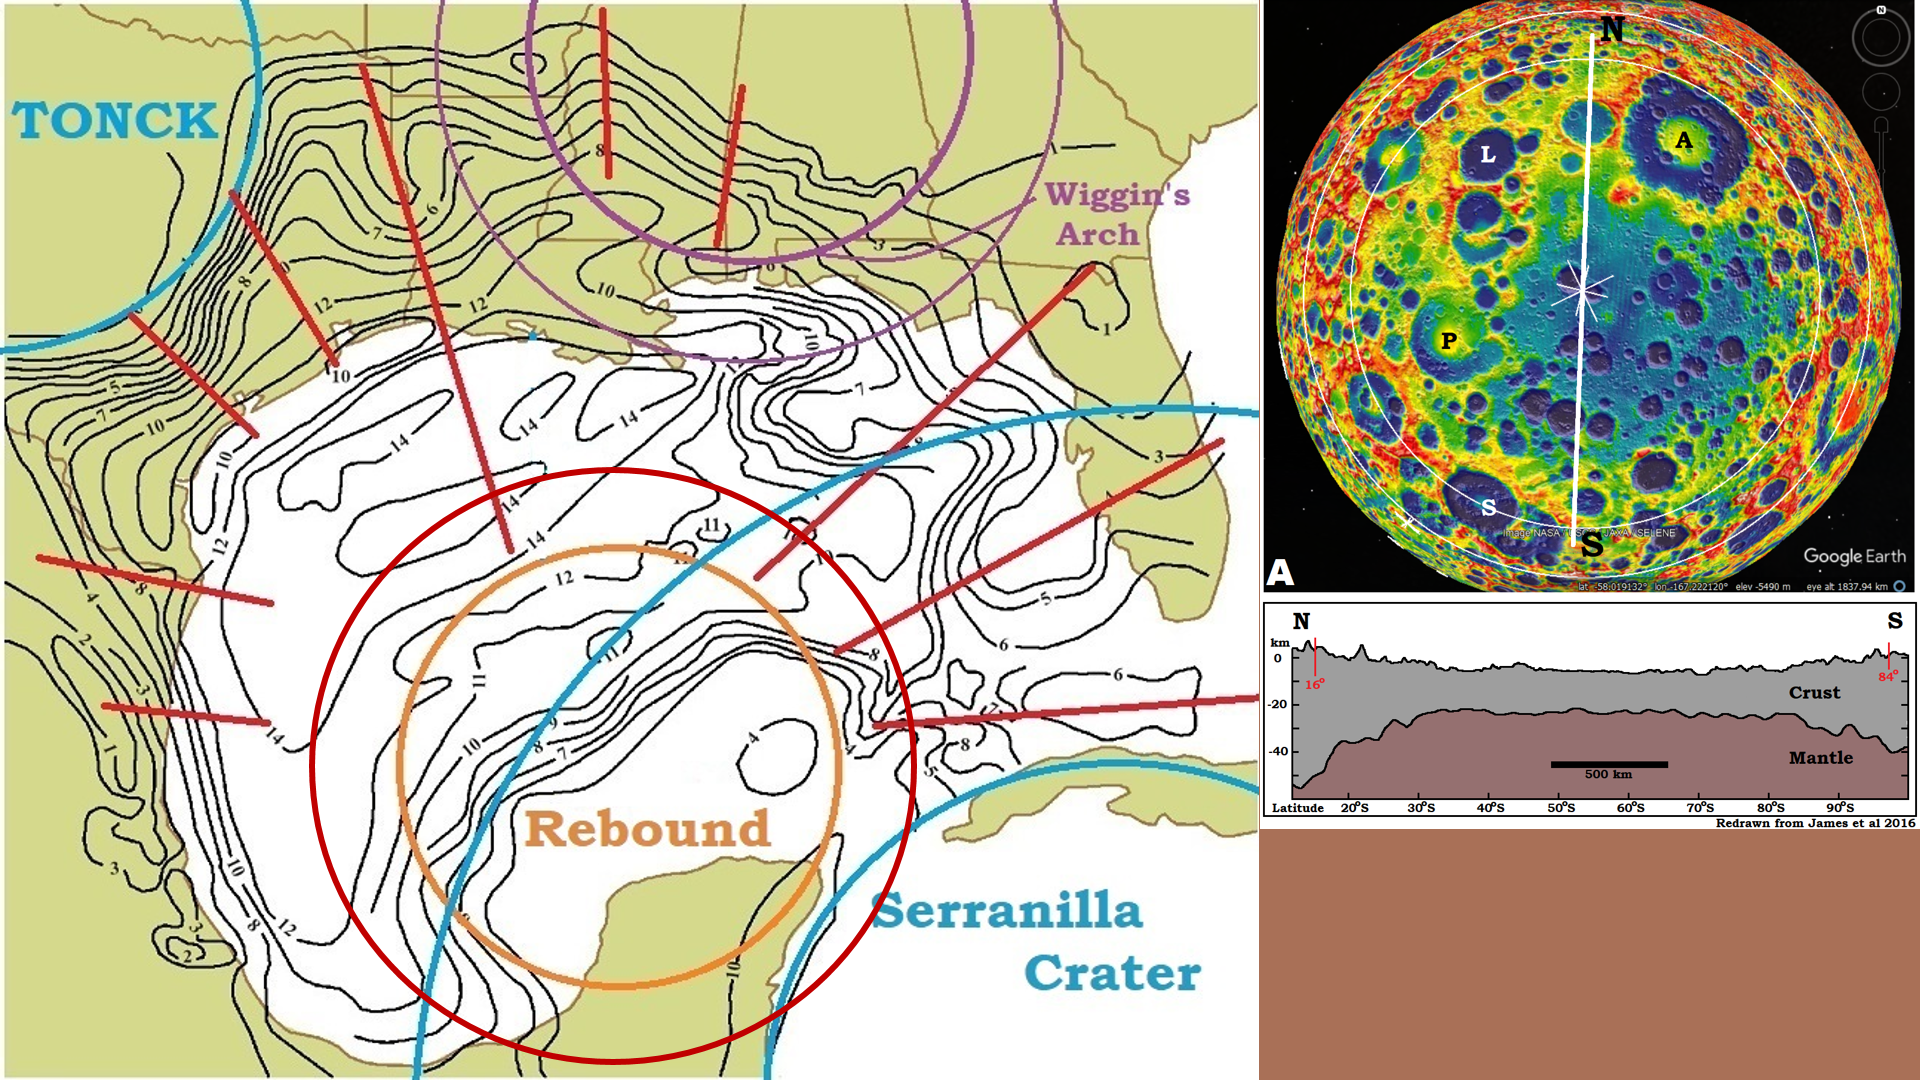 Figure 11: An uplift in the center of the crater is a commonly recognized structure in lunar craters. (A) shows the South Pole-Aitken Basin in GRAIL Gravity Map. James et al (2016) provides the cross section of the ~2,000 km/1,240mi diameter crater. I propose the uplifted mantle exist under the Gulf of Mexico crater to the Open (Cc)-ring, Figure 1. This topography isochrones suggest the rebound is most evident in the red circular area, possibly accentuated by the uplift from the Serranilla crater.
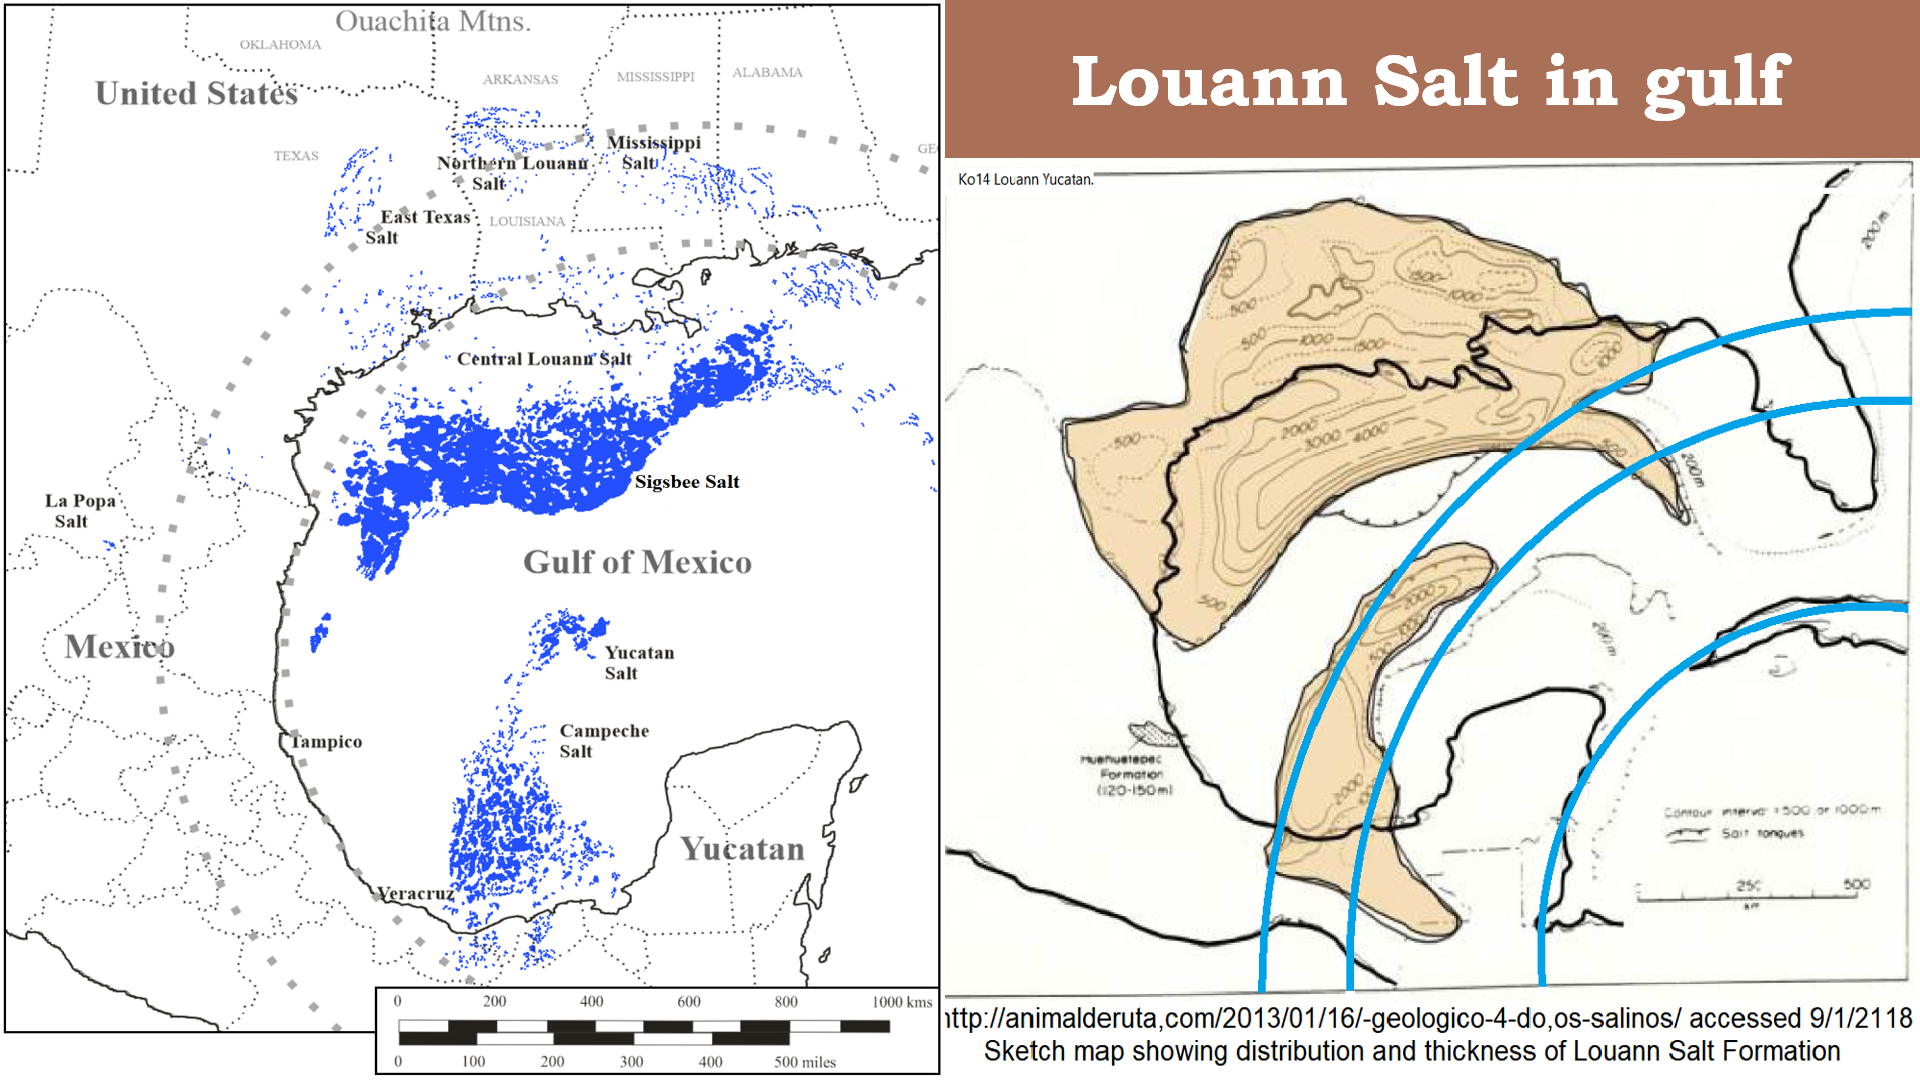 Figure 12: Two drawings of the distribution of salt in the gulf. Present model builder have no explanation for the strip of separation between the two main salt bodies. Many refer to it as the “spreading center” suggesting this strip is where the gulf has historically grown wider pushing South America and Africa (Gondwana) apart to form the Atlantic Ocean. We will see an explanation why the Sigsbee Salt is thrust southward, but the salt’s “arc of absence” separating the two main bodies, and the circular absence between the Yucatan Peninsula and the Yucatan Salt and Campeche Salt, where I have proposed the Gulf of Mexico crater is centered, is a real physical absence. As I propose salt is a condensate from the cloud of vaporized rock. The heat in the surface may have a direct affect on the ability for vaporized minerals to remain on the ground after condensing (see pdf: GM 2- GoM Louann Salt). This heat would most likely be present near the center of the Gulf of Mexico crater, and where additional heat was put into the substrate by the Serranilla crater. This would also suggest the Serranilla crater happened before much of the heat for the Gulf of Mexico crater had time to significantly dissipate.
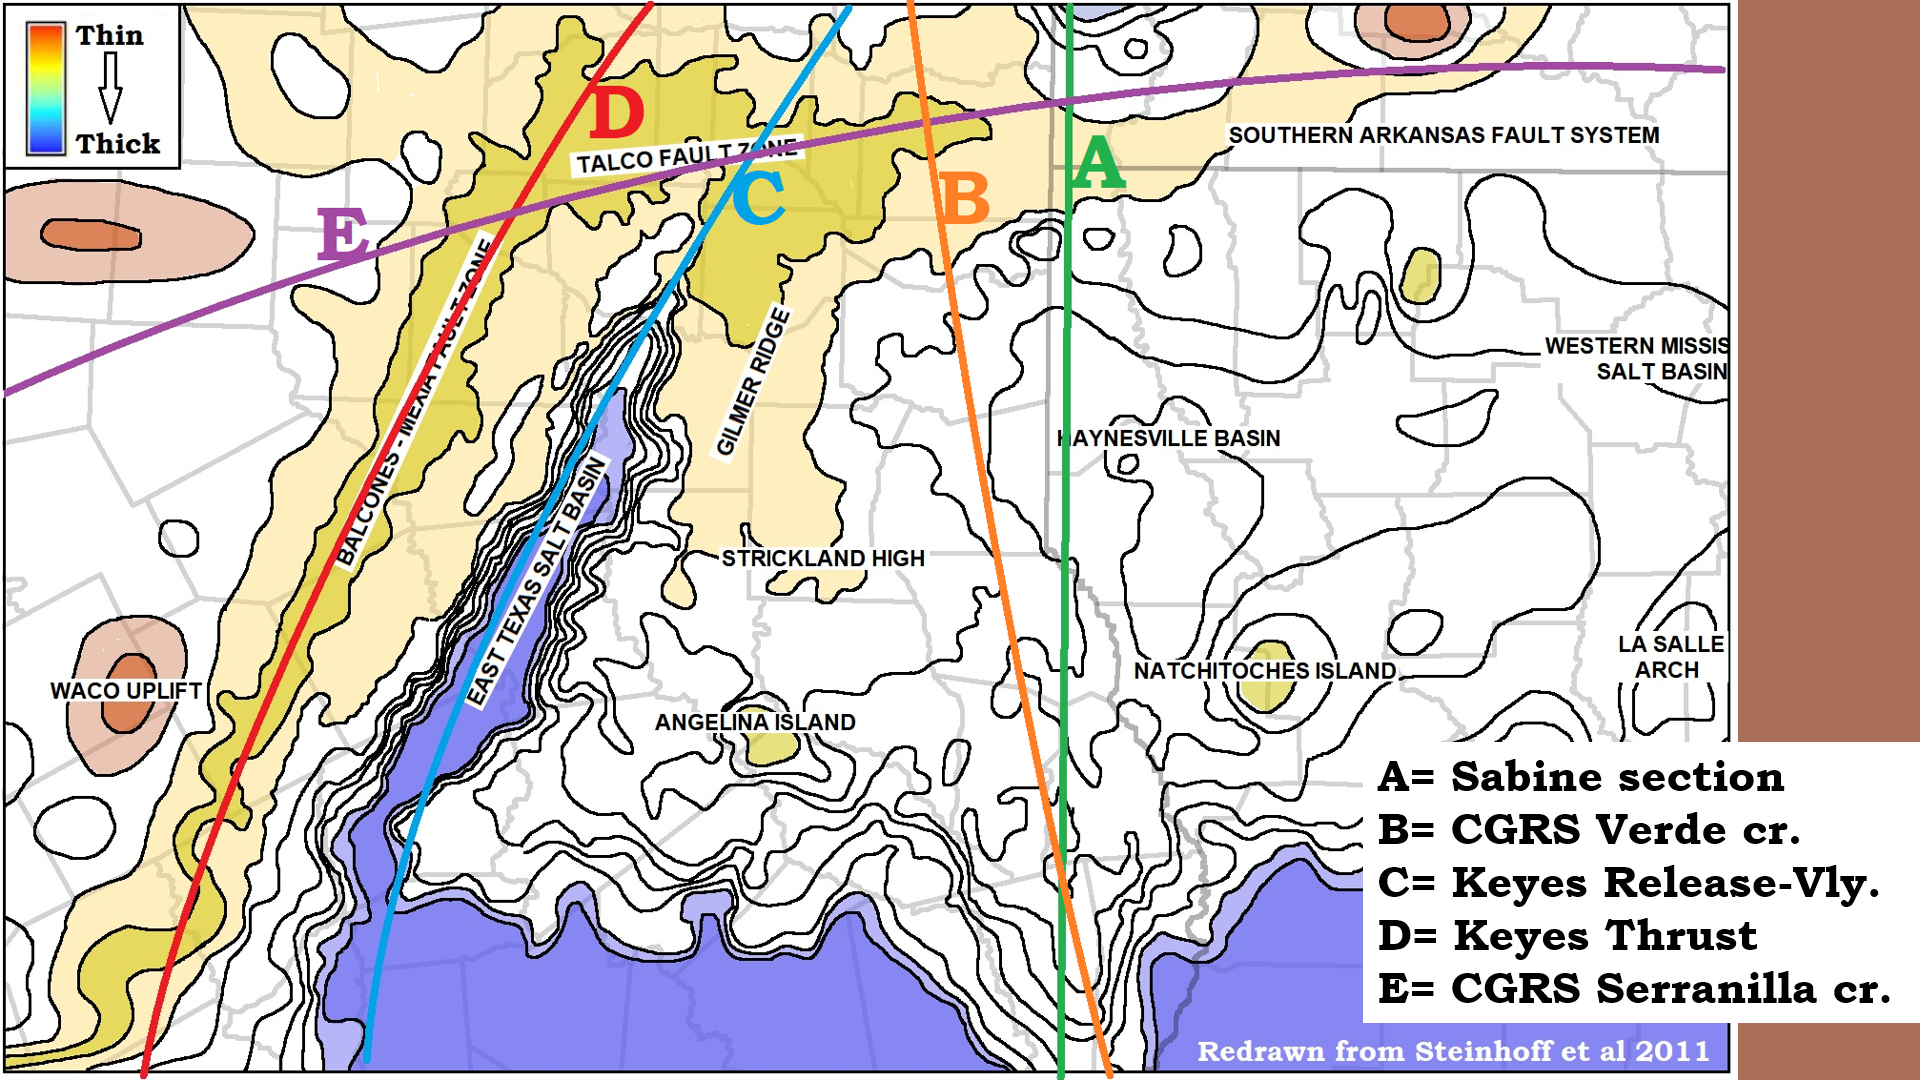 Figure 13:Steinhoff et al provides a Topographic map of the top of the crystalline basement using the Pettet to Gilmore Lime as a surrogate from well drillings. Some of the detail we can see in the basement topography includes the top ridge of the Sabine Block, linear B, laying at an angle to the mapped section used by Mickus and Keller, Figure 2, that is located at linear-A. Linears C and D are a ridge and valley pair that cuts off the west side of the Sabine Block. I believe this shear pair probably centers in the Keys crater. Linear E shows in both the Talco Fault Zone and the Southern Arkansas Fault Zone, and I propose it is a CGRS from the Serranilla crater.
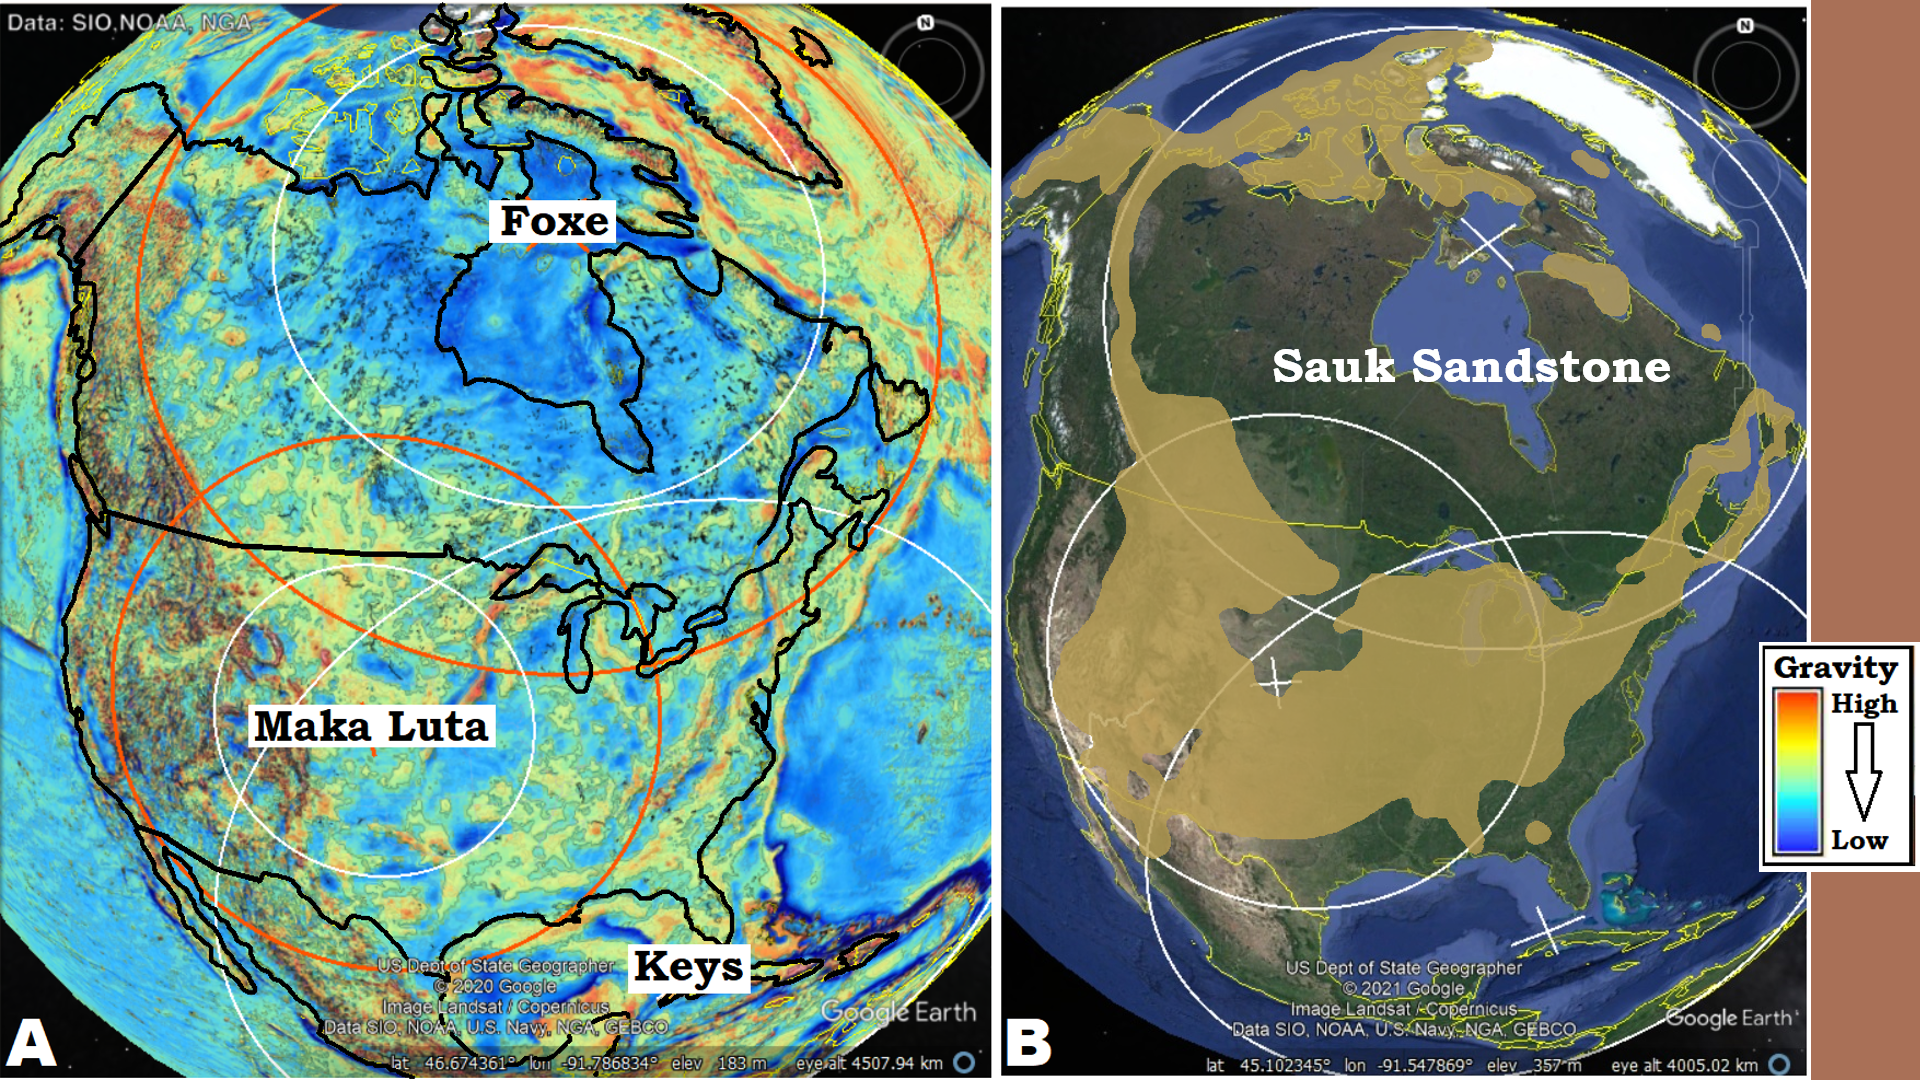 Figure 14: The first sedimentary layer above the Great Unconformity in the Grand Canyon is the Tapeats Sandstone. It is correlated over much of North America and is often referred to as the Sauk Mega Sequence. While the author does not agree with the concept behind mega sequences, these correlated sandstone layers do conform to the edges of the Foxe crater and much of the Maka Luta crater with some significant absences. One of these absences is underneath the center of the Maka Luta crater and a void extending along the CGRS from the Keyes crater. This curved linear is often referred to as the “dinosaur Peninsula,” as many evidences of dinosaurs are to be found in it. As some additional spots appear on the Keyes circle further south, I propose heat controlled the non-depositing of the sandstone in these areas. If the substrate was too hot, the quartz and feldspar sand was not able to condense, This would also explain why the sandstone did not condense towards the center of the Foxe crater. This is the Canadian “craton” which must have remained at a higher temperature than its edges. But, why is the void in the sandstone over Texas and Louisiana adjacent to the Gulf of Mexico?
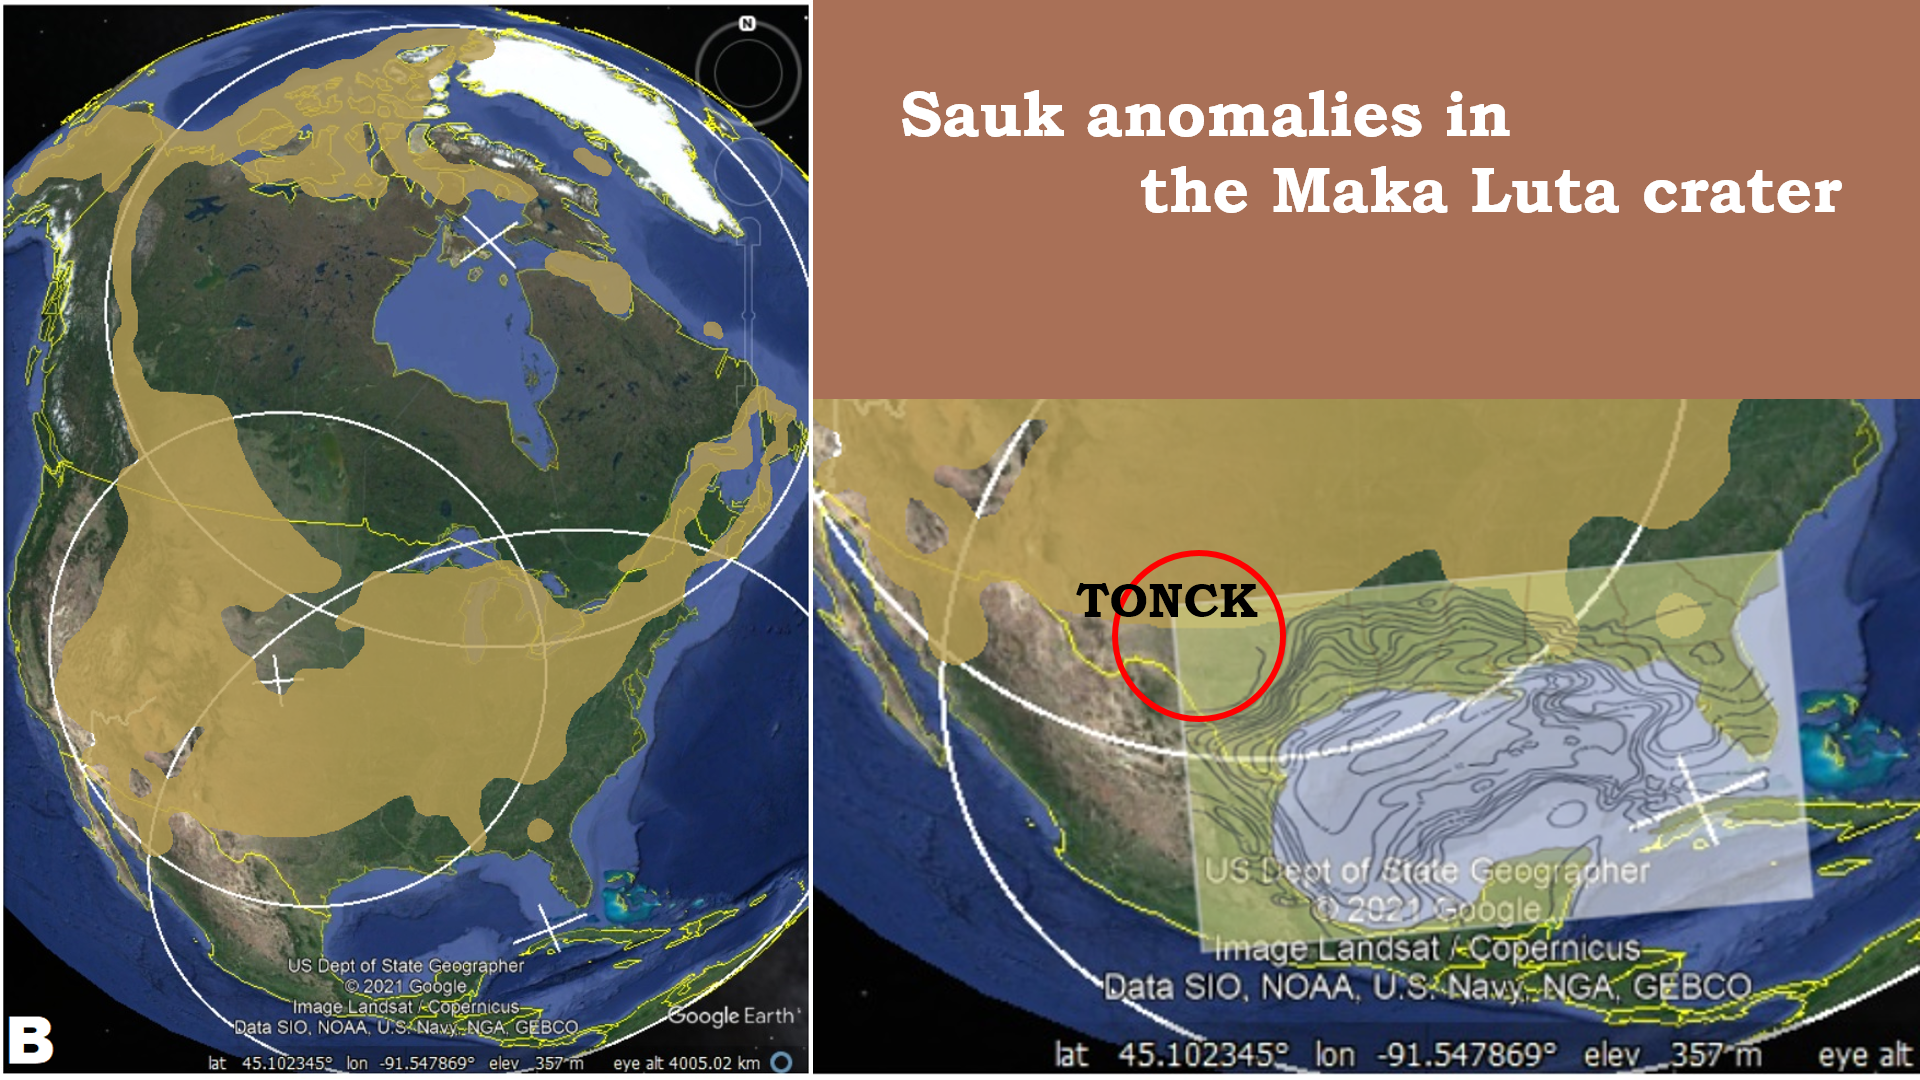 Figure 15: Overlaying the basement topographic map over the Sauk map suggest a reason. Much of that area was excavated by the Gulf of Mexico crater and would also be at an elevated temperature compared to further inland. The spot of sandstone just north of Florida, in southern Georgia is also interesting in this regards. Note how the isochrones over Florida avoids that area. It is likely that the basement under that spot was also at a lower temperature to allow condensation of the sandstone from a cloud of vaporized rock. The placement of the TONCK crater, Chapter 1, extends the void in the Maka Luta to the west, but it does not follow its border like the basement topo does. I propose this is because the TONCK crater was after the Maka Luta, and therefore did not change the substrate’s temperature, but it did push back or rearrange the excavation of the Gulf of Mexico crater in that area, so that it is no longer recognized.
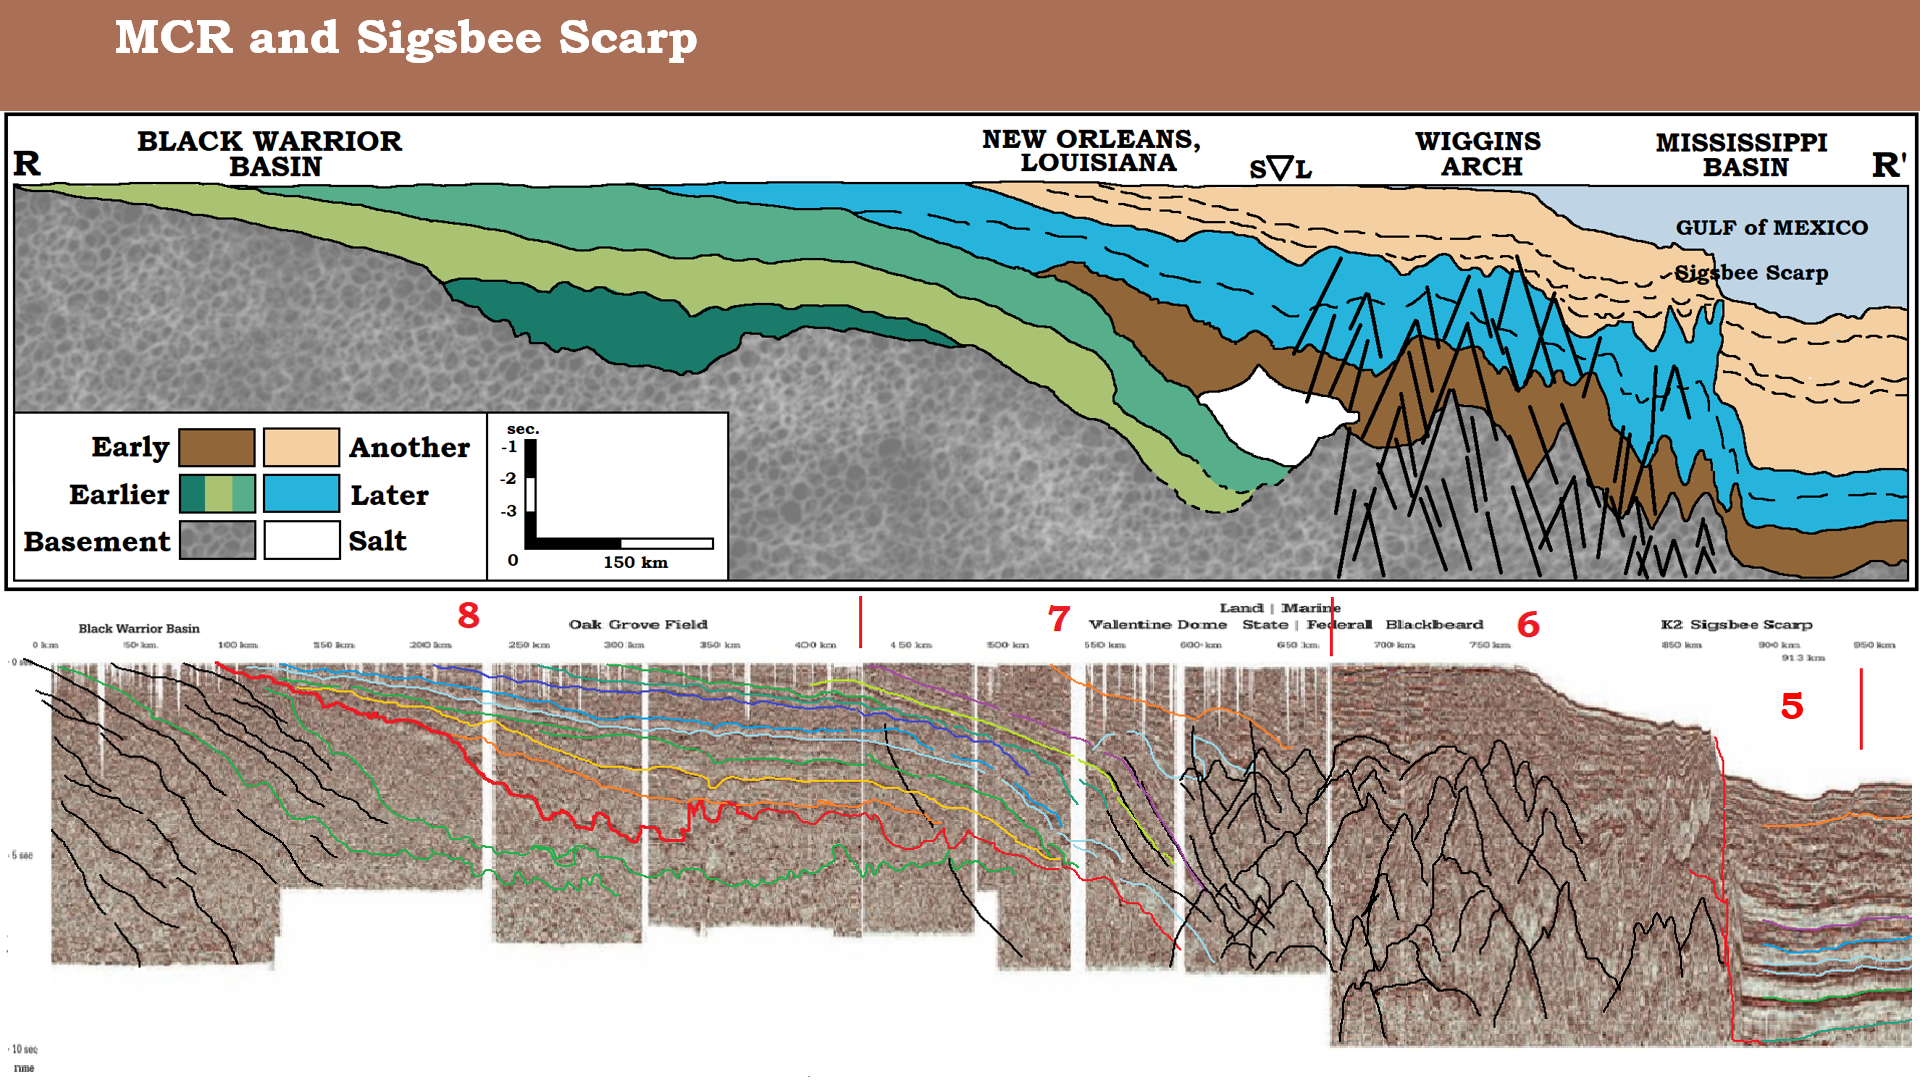 Figure 16: Section R, see Figure 18 for location, extends from the Black Warrior Basin, across the Wiggins arch, through Sigsbee Scarp, into the deep gulf. I have included the original ION seismic section for the reader themselves to see the disruption that the MCR crater produced in the sedimentary strata thrusting up the Sigsbee Scarp. Had not that disruption occurred, it is presumed that the slopping layers seen under 7 would continue at that same slope to join up with the layers under 5. That slope would have been the slope of the crater sides in the excavated bowl. I am struck by the similarity in appearance of the cone shape in the area of the thrust-up to the cone-in-cone appearance of shatter cones that are also often found under the edge of a crater’s ring. Remember shatter cones are found in association with rings of relatively small craters. What would a shatter cone look like if it was 12-14 km/8-10mi tall and 4-600 km/250-375 mi wide? Maybe it would look like this.
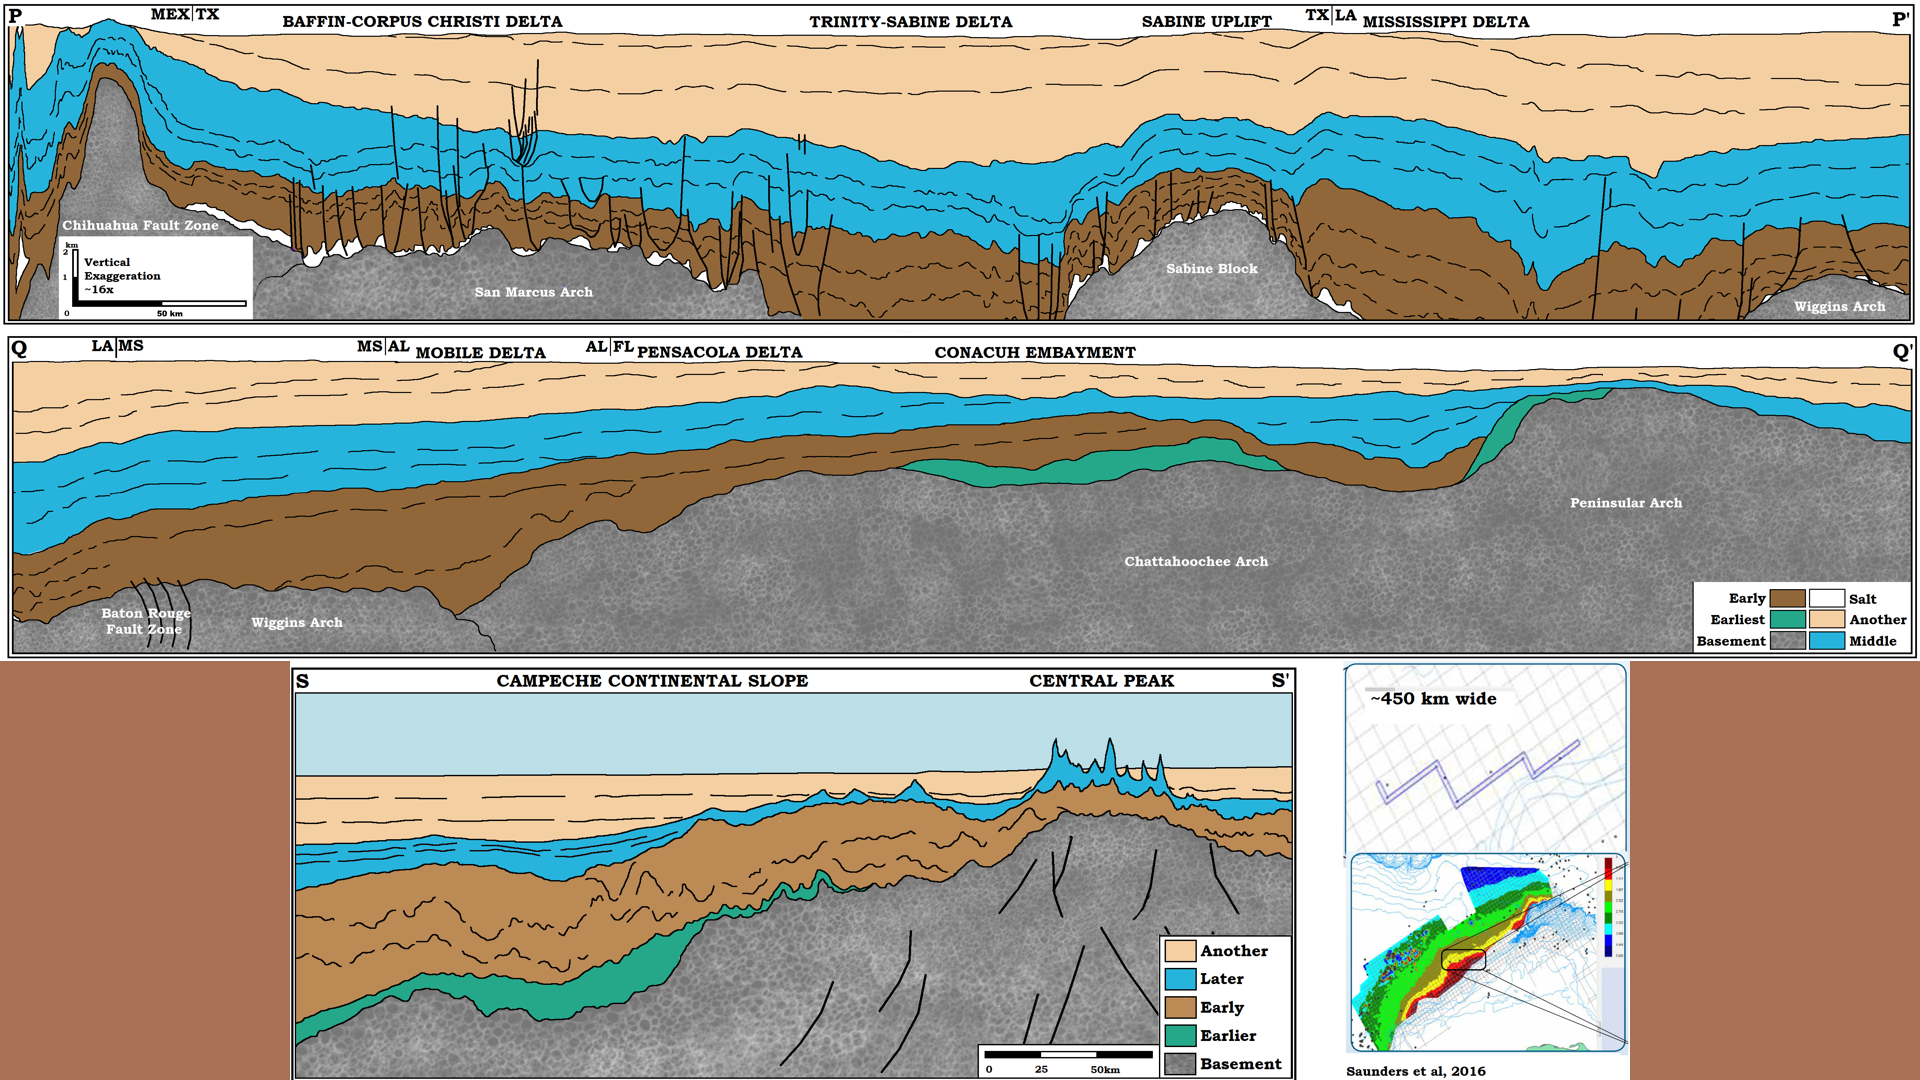 Figure 17: Sections rimming the Gulf (location shown in Figure 18) from the Mexico-Texas border on the upper right (P) to the Atlantic Coast just north of Florida on the mid right (Q’). The strata are not only correlated, but they are continuous, except for the earliest strata which did not deposit on the Peninsular Arch under Florida. The earliest strata only deposited on the gulf side of Florida and may represent sediments from the Bermuda crater. Both the Bermuda and Gulf of Mexico craters came after the Keyes crater and worked together to form the sub Florida Peninsular Arch. The top of the blue strata is generally identified as Late Cretaceous-Paleogene boundary. I propose both the brown and blue strata were all fallback sediments from the Gulf of Mexico crater. And, while later craters thrust up and rearranged the gneiss in the crystalline basement and lower strata, no later craters pierced down to the crystalline basement in this area. Section S-S’ shows what I interpret as part of the central peak structure, just on the edge of the Campeche shelf. This is where I find the center of the Gulf of Mexico crater in Figure 1.
 Figure 18: Key to most of the lithology sections and locations referenced in this slideshow. The Gulf of Mexico is the location of the Grenville Orogeny and the convergence and rifting of Gondwana. For this all to have happened gradually is impossible if all the base layers show continuous deposition from Mexico to Florida (See the Grenville Orogeny never happened). As possibly the most drilled and studied area of ground on the planet, the Gulf of Mexico hold few lithologic secrets. The history of cratering is all in the details, and the more details we know, the better we are going to be able to understand exactly how cratering there took place. If the model is correct, the more we know, the more we will understand, and the clearer the details will become.
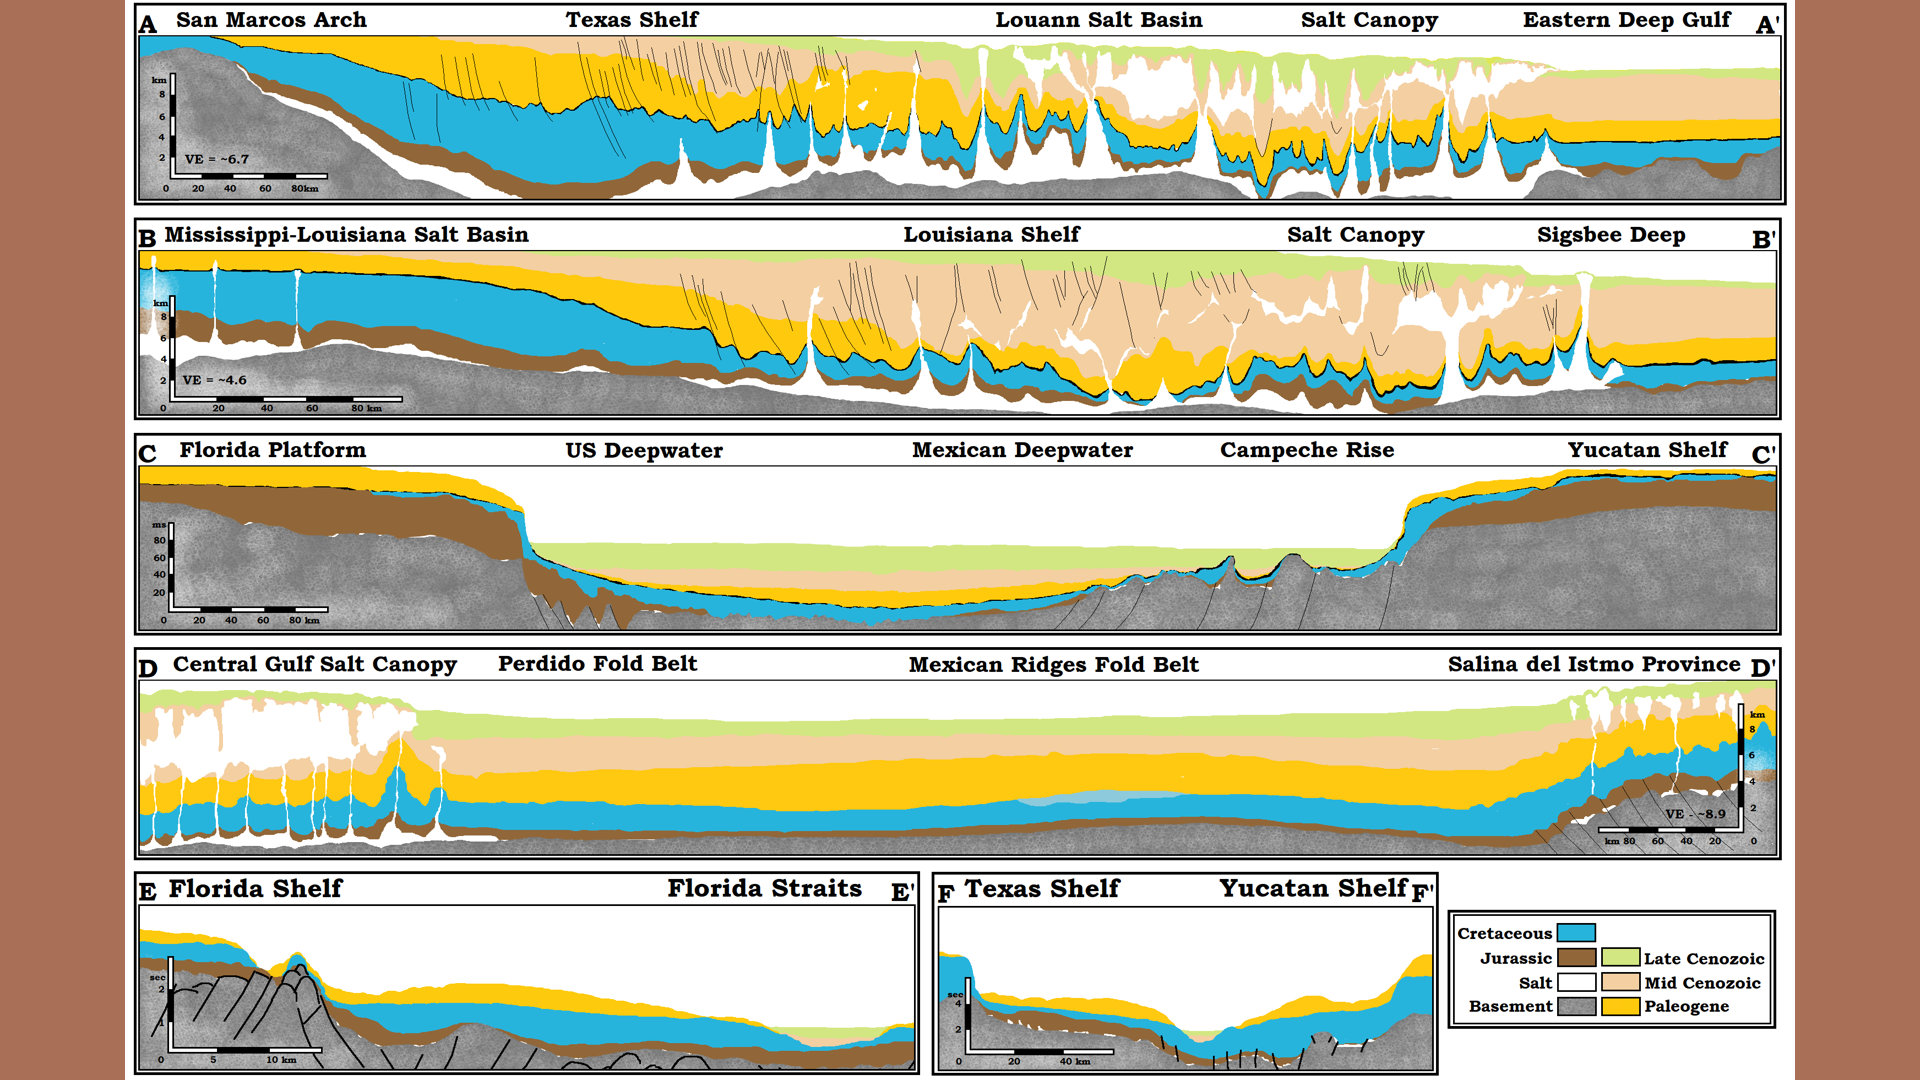 Figure 19: Six sections through the gulf (for locations, see Figure 18). The black line between the Late Cretaceous and the Paleogene is the K-Pg Boundary (KPGB). The black line represents the KPGB iridium layer believed to be spewed out by Chicxulub crater causing the dinosaur extinction. The KPGB iridium layer is real, but unlikely to represent a unique feature. Probably, iridium layers around the world represent local cratering to that area, like in the gulf. But, it was not produced by the Chicxulub crater, which was much later, but maybe the Serranilla crater in this location. The Paleogene Wilcox formation just above the KPGB is one of the thickest single strata in the gulf, and it may represent the final fallback and condensation from the Gulf of Mexico crater with the arrival of the Serranilla crater. Section C show it predates the rise of the Florida platform and predates the Serranilla as it is partially absent in the south end of the Campeche rise which I attribute to uplift in the center of the Gulf of Mexico crater, and disruption form the rise of Yucatan in the Serranilla cratering up-thrust.
 Figure 20: Comparing sections between areas can be misleading. This is three section. A-A’ is across the Eastern Rocky Mountains to the Mississippi River, a distance of ~1,500 km/~930 miles with an altitude gain of ~3500 m/~2.0 miles. In barely half the linear distance on the Louisiana Shelf, B-B’, strata in the Gulf gains almost 10 miles/16 km of altitude. Similarly in C-C’, on the Texas shelf in about 2/3 the linear distance the altitude gain is between 9 -10 miles/5 - 6 km. All three sections are shown with the same vertical exaggeration, so they are in the same scale. Topographic changes in the Gulf of Mexico is nothing like topographic changes on the surface of the earth, so it would be ridiculous to postulate similar processes formed them. I am suggesting, the cratering bowls left by the early craters were very different than the remnants of smaller craters left on the earth’s surface.
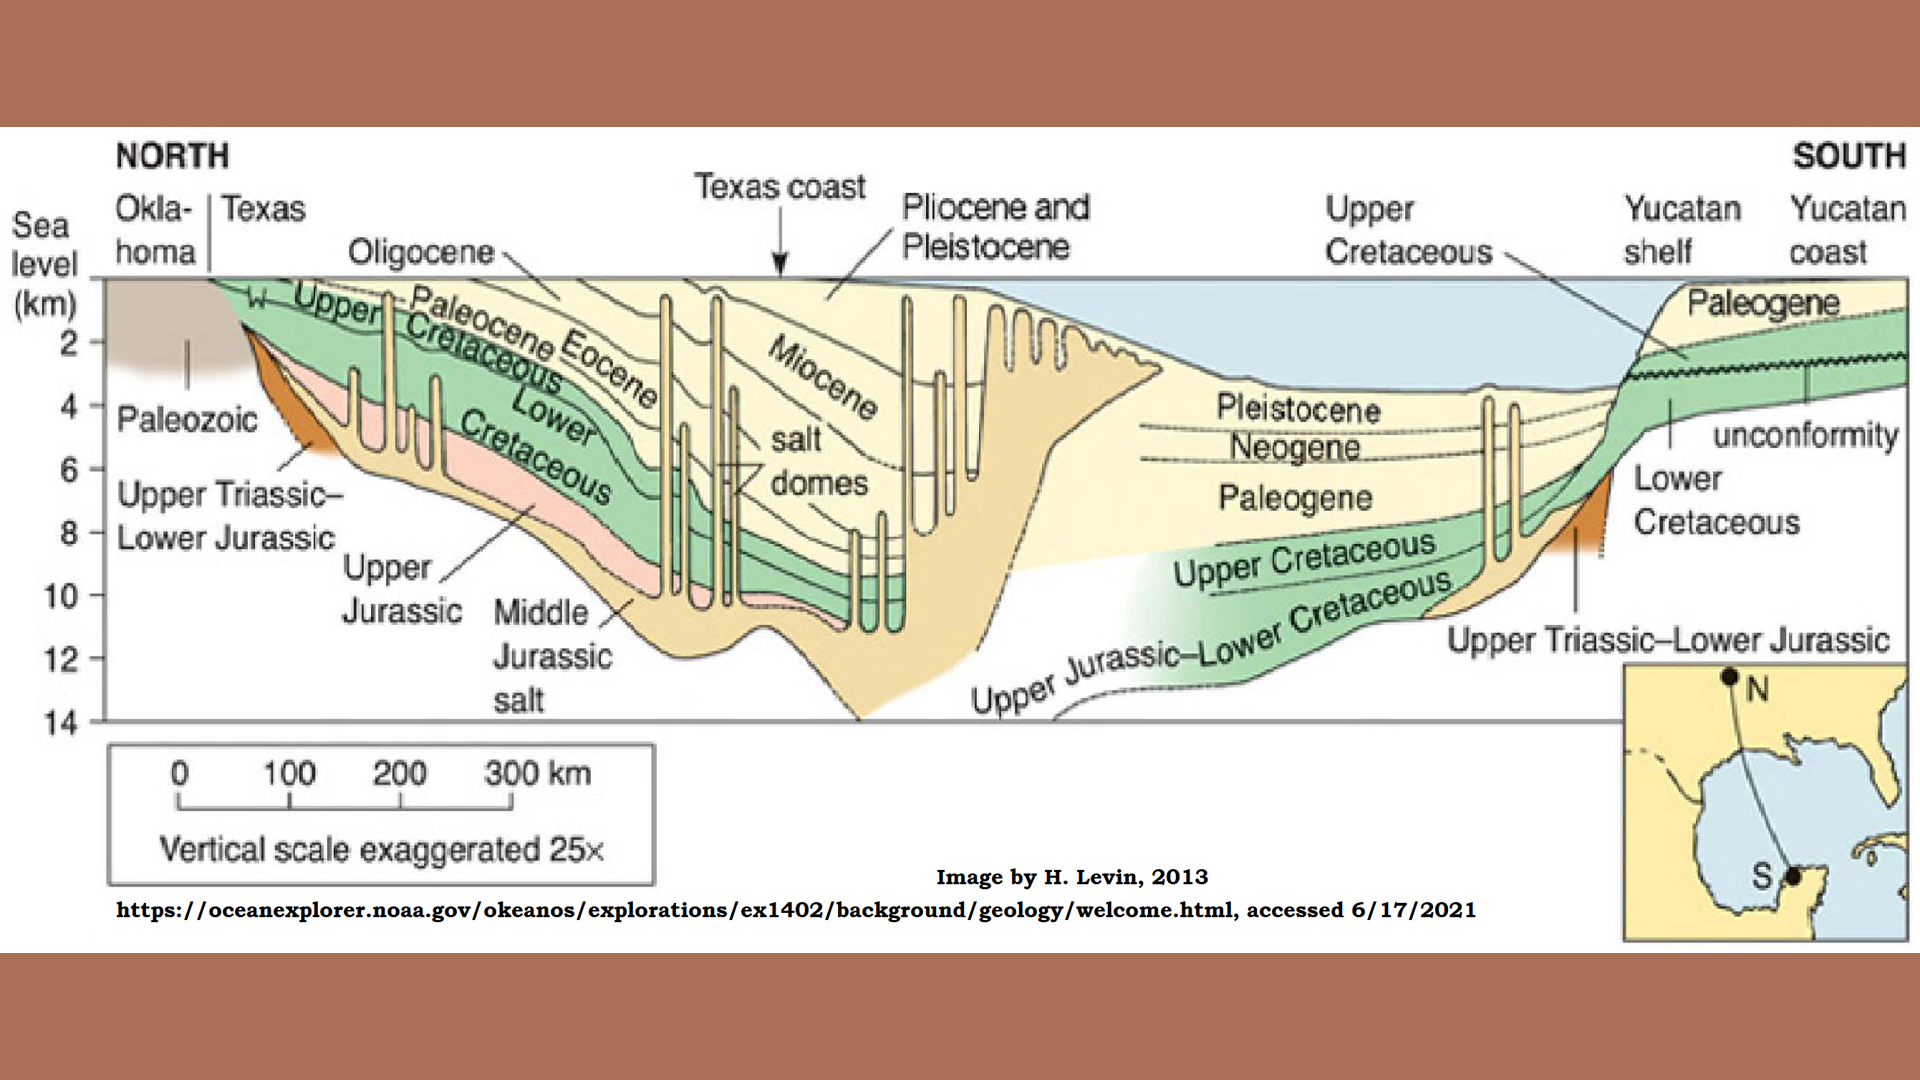 Figure 21: One more section from Oklahoma, west of the Sabine Block, to the Yucatan Peninsula. The section emphasizes the differences west of the Texas Salt basin and the Sabine Block. It is a very simplified section, but contains some very important information. On the north end there is some “Upper Triassic-Lower Jurassic” strata indicated. I propose this would be from an earlier crater that struck further west but left some strata incorporated below the first fallback from the Gulf of Mexico crater. This suggest, the cratering bowl was not excavated into the lithology, but the rim was pushed up from below like Meteor crater in Arizona (see Chapter 8). In the center of the section, the upturning and overturning of the strata with the emplacement of the Serranilla crater has been interpreted as a complete over-thrust of some of the Jurassic sediments. Against the Yucatan Shelf it shows some additional “Upper Triassic-Lower Jurassic” strata remains. Whether further research will substantiate this designation remains to be seen. The sections in this area show broken and rotated blocks of rubble, some of which have completely become engulfed in the up-thrust crystalline rock. The interpretation of origin of these xenoliths is totally dependent on the model being used.
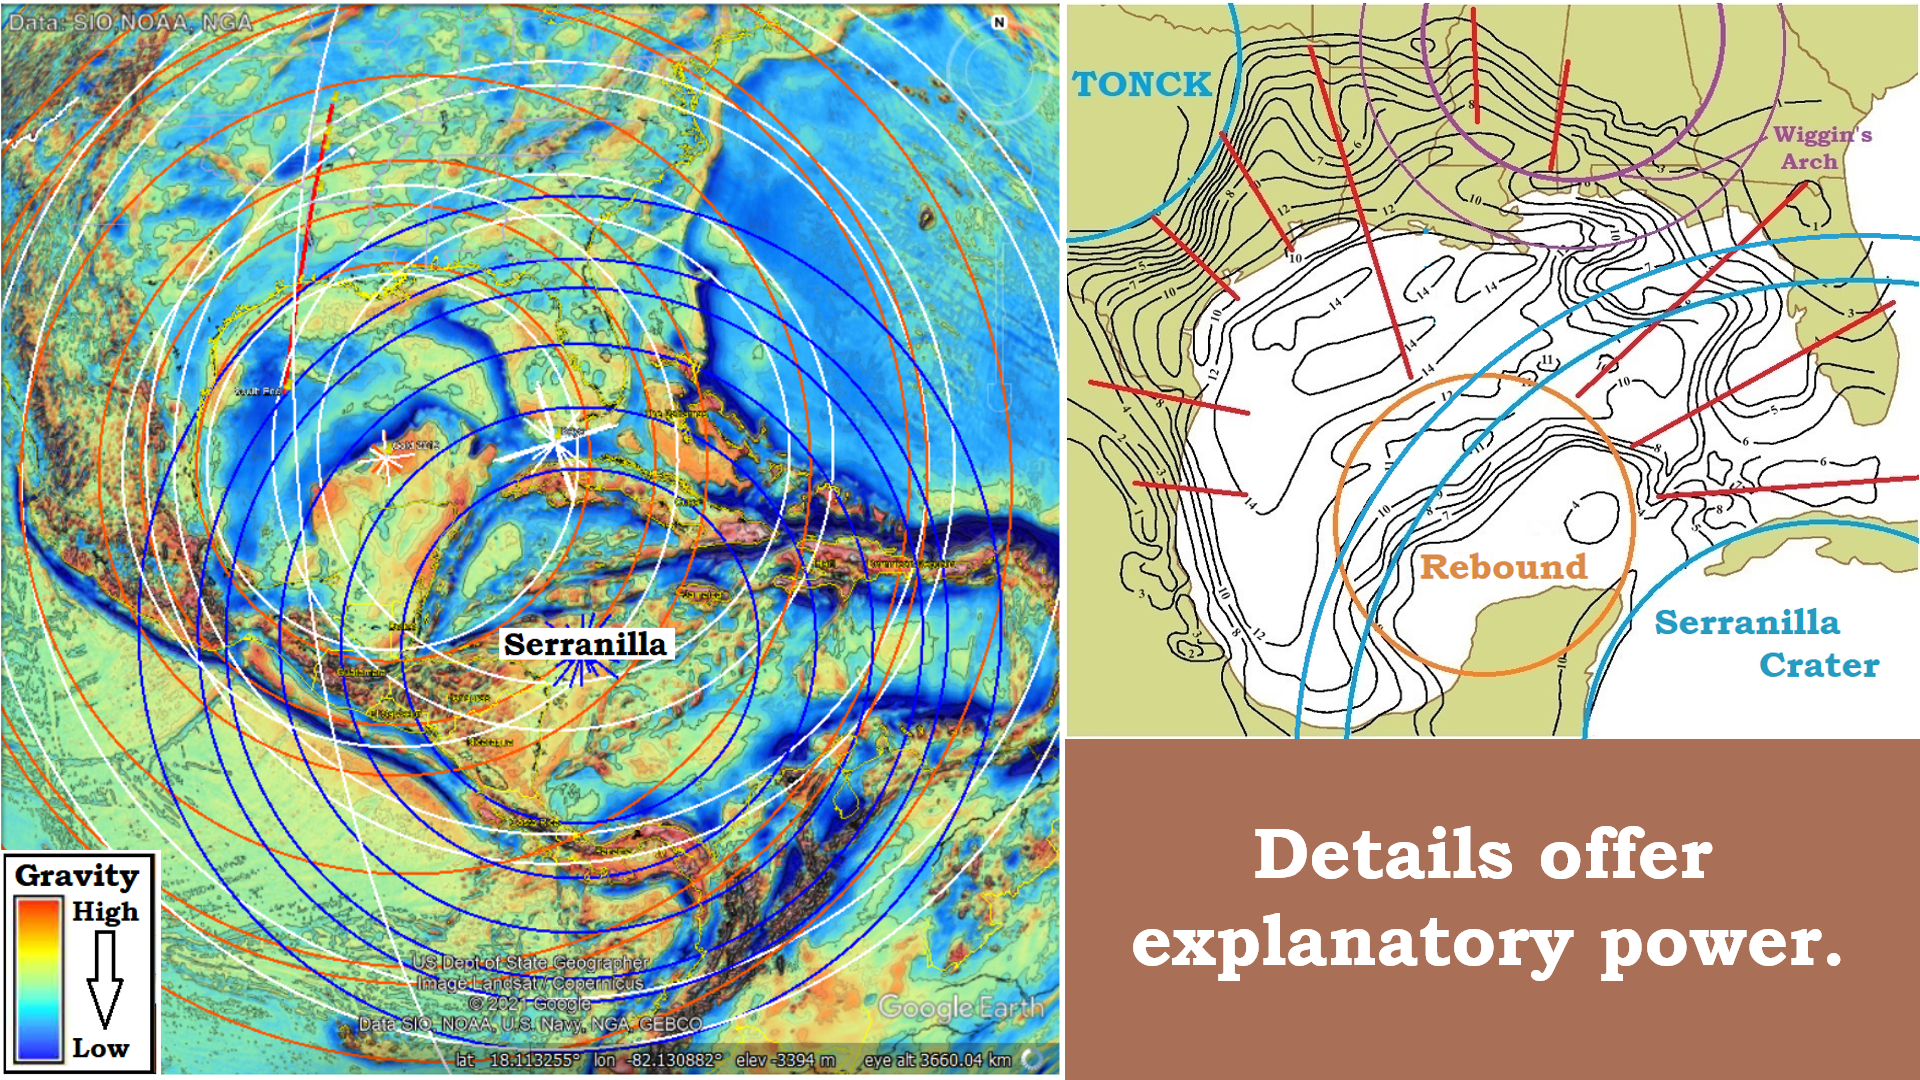 Figure 22: The rebound of the crater bottom happened relatively close timewise to the time of up-thrust putting the Serranilla crater in place.
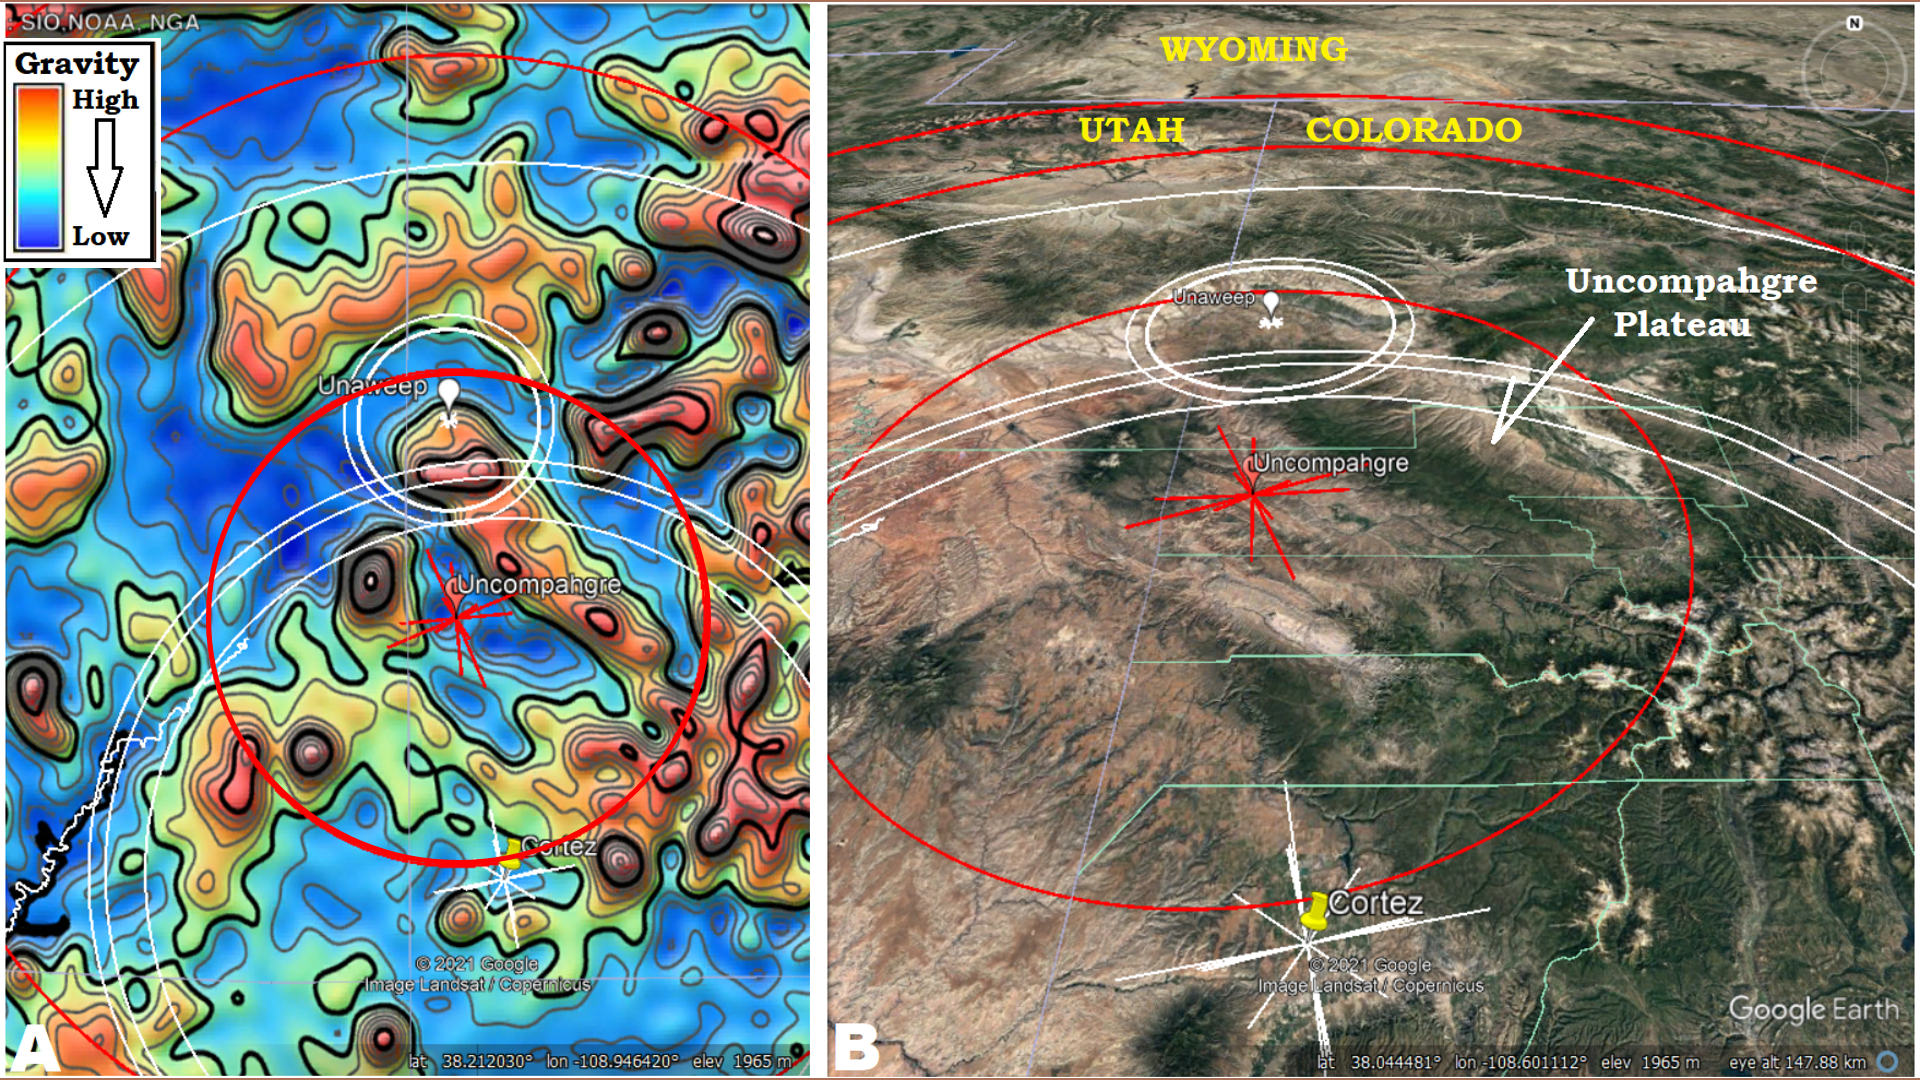 Figure 23: Understanding a large crater like the Gulf of Mexico involved sorting out the events of many craters that interacted with and in the gulf. Considering the interaction that proceeded and produced the cratering results for the Turner Gulch crater are nearly as involved. Once again, the more we know, and the greater detail to which we know it, the more ability we have to explain the lithology. Gravity and Oblique view of the Uncompahgre Plateau and Uncompahgre crater in red. The larger white ring belong to the Cortez and Unaweep craters.
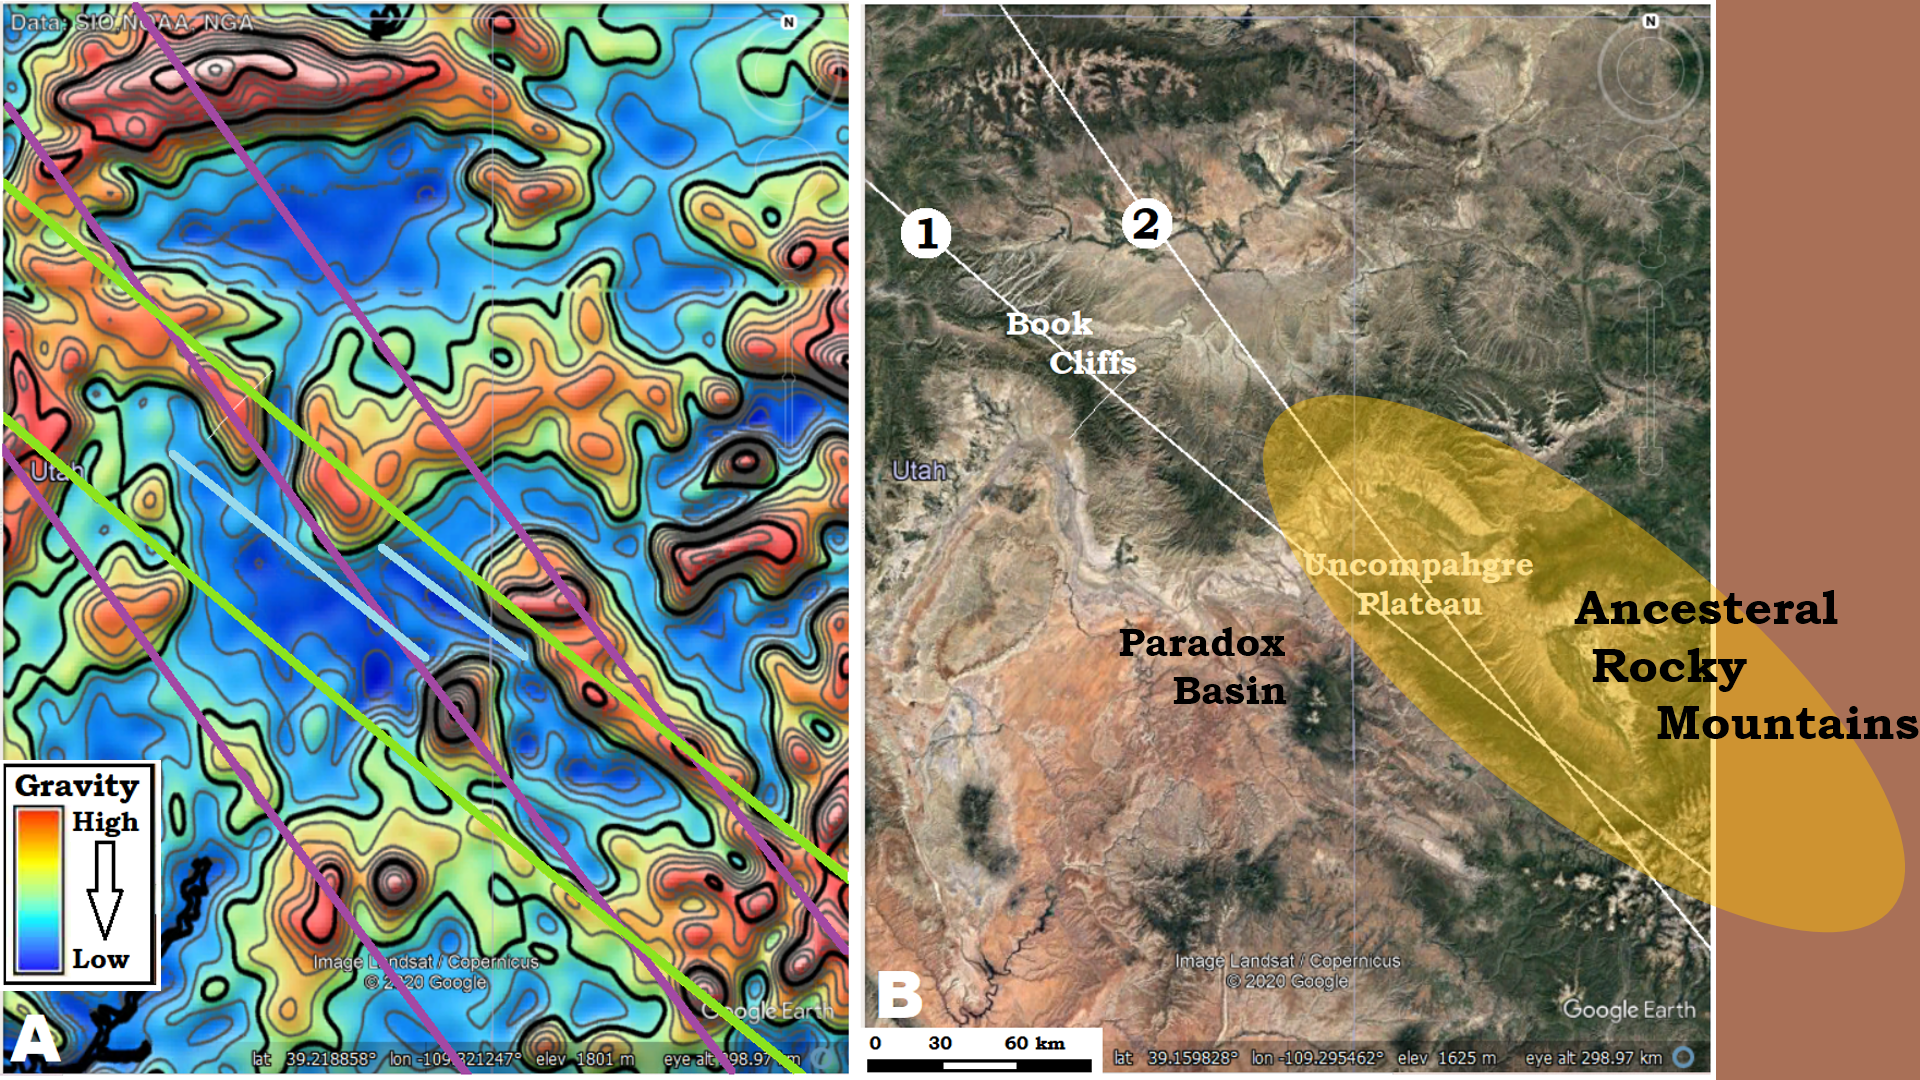 Figure 24: Secular geologist suggest the monoclonal gneissic dome Uncompahgre Plateau is all that is left of the Ancestral Rocky Mountain that eroded away to fill the Paradox Basin. By contrast I propose two CGRS are expressed in its structure. (1) is concentric to the Irminger shear center in the northern Atlantic Ocean, and (2) is concentric to the Tasman Sea, just east of Australia. The Irminger seems to be the first or primary CGRS to arrive as the Plateau thrusting up the southwestern edge, giving it a distinct slope to the northeast and placing the drainage divide at the top of the southwest edge. This is the wrong direction for sediment laden water to drain into the Paradox Basin on its southwest, and contradicts the popular explanations.
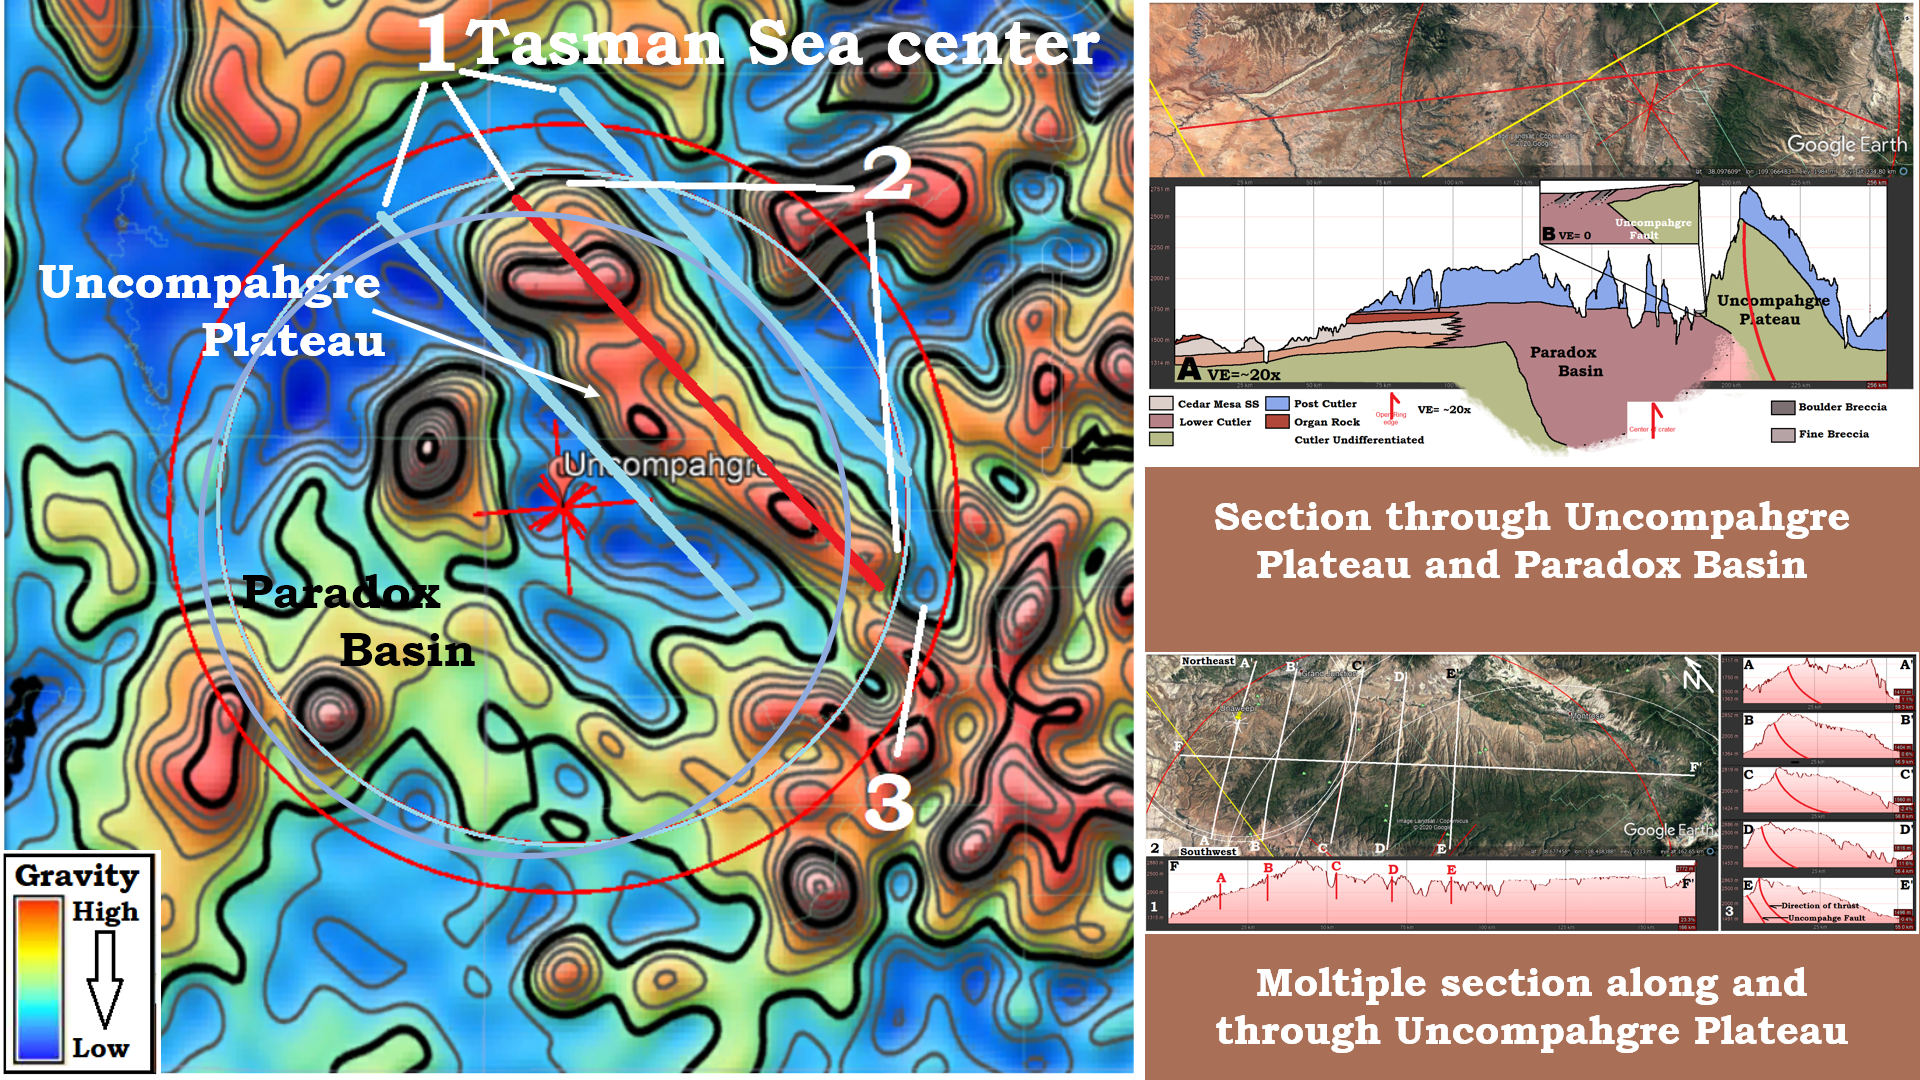 Figure 25: While the Uncompahgre Plateau may have gotten its profile from the Irminger CGRS, it got its linear shape from the Tasman Sea CGRS. The red linear down its center is a compression/shock-wave expression while the blue low gravity linear to either side is a Release-wave Valley. The Uncompahgre Plateau ends abruptly on both ends (2). I will propose that the plateau is a mascon for the Uncompahgre crater, like mascons on the moon (Chapter 10A and 16). The (3) separation between the blue-ring that defines the plateau’s ends and the red ring which is the Open-ring defining the edge of the uplift/rebound (Chapter 9). Wrapping the Open-ring around the Plateau provides the center’s location. Cross section emphasize the plateau shape in longitudinal Section F-F’, and the monoclonal shape in sections A-E with the direction of the Irminger up-thrust indicated in red curved lines.
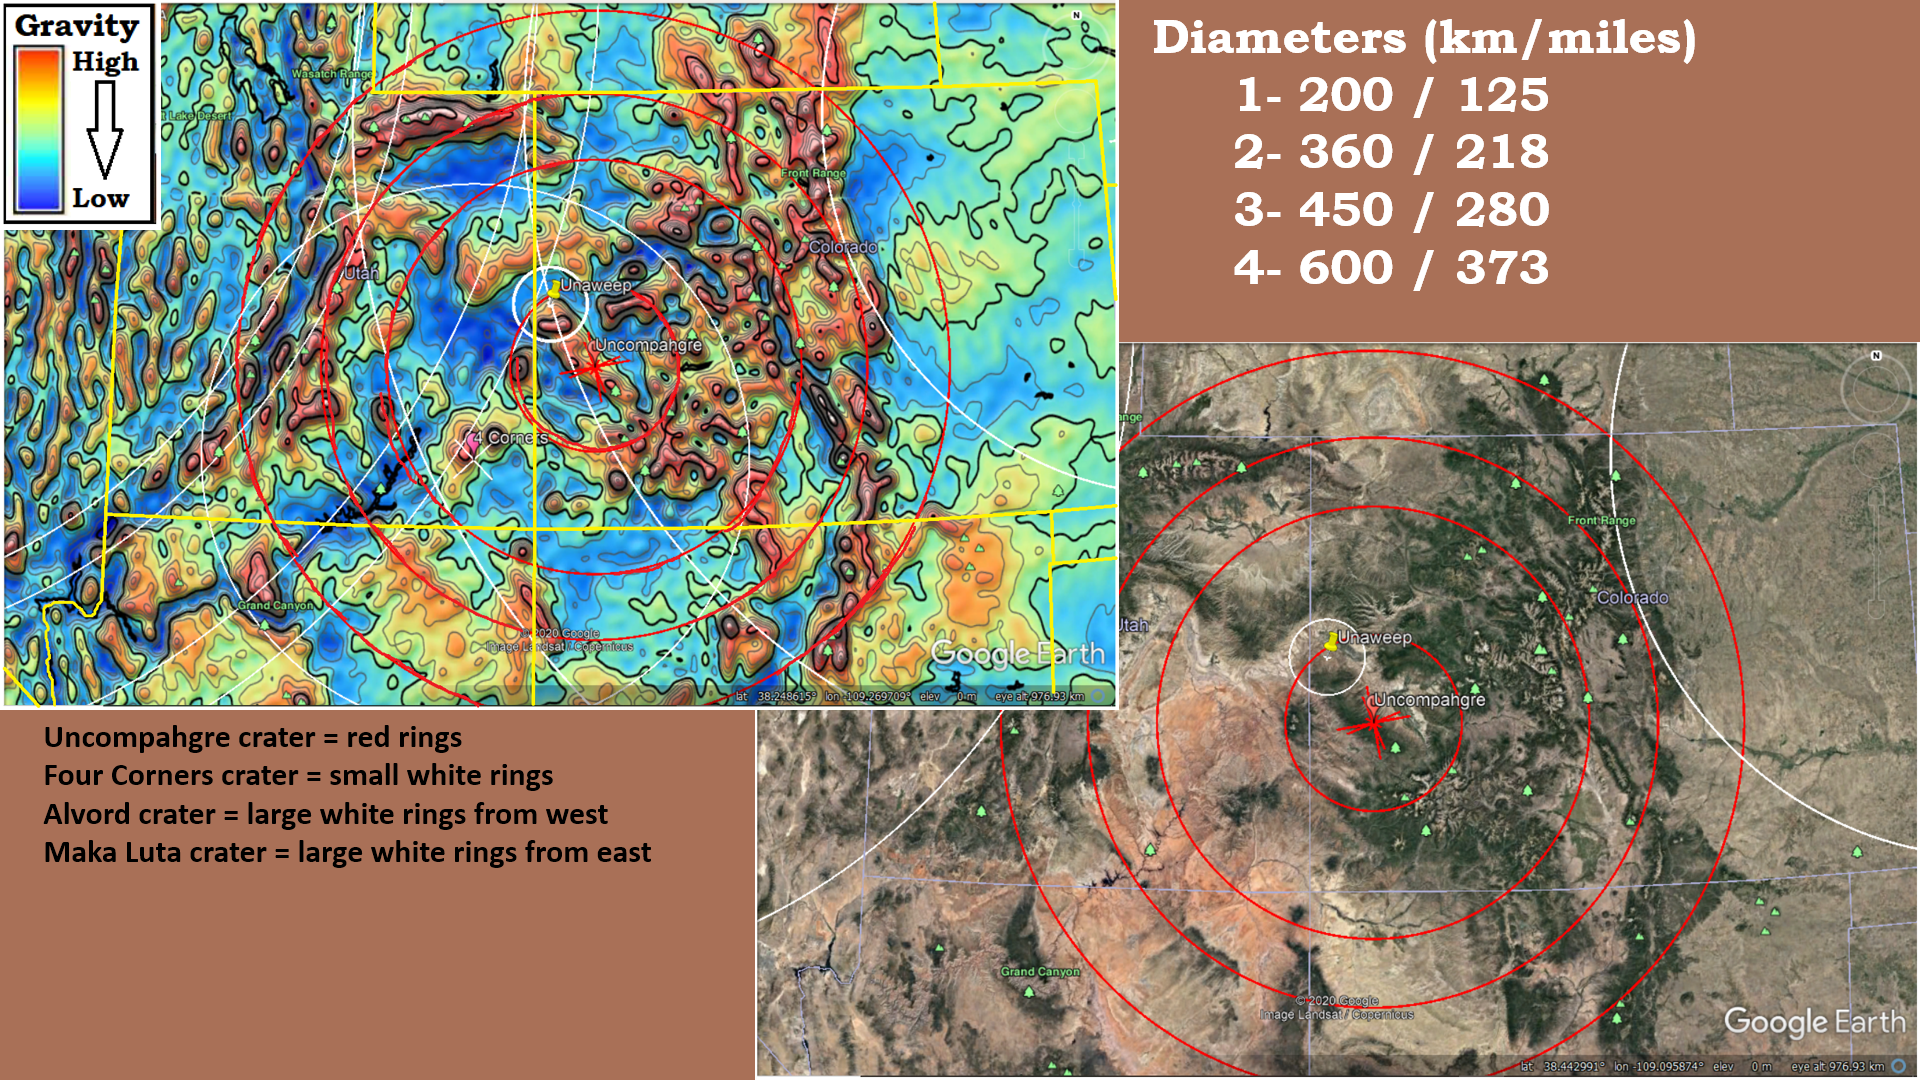 Figure 26: And, moving outward from there, the fourth ring shows a good conformation of a strong compression-wave seen in gravity. It was this ring I first picked out in the gravity map, and worked my way inwards to first identify the plateau as a mascon.
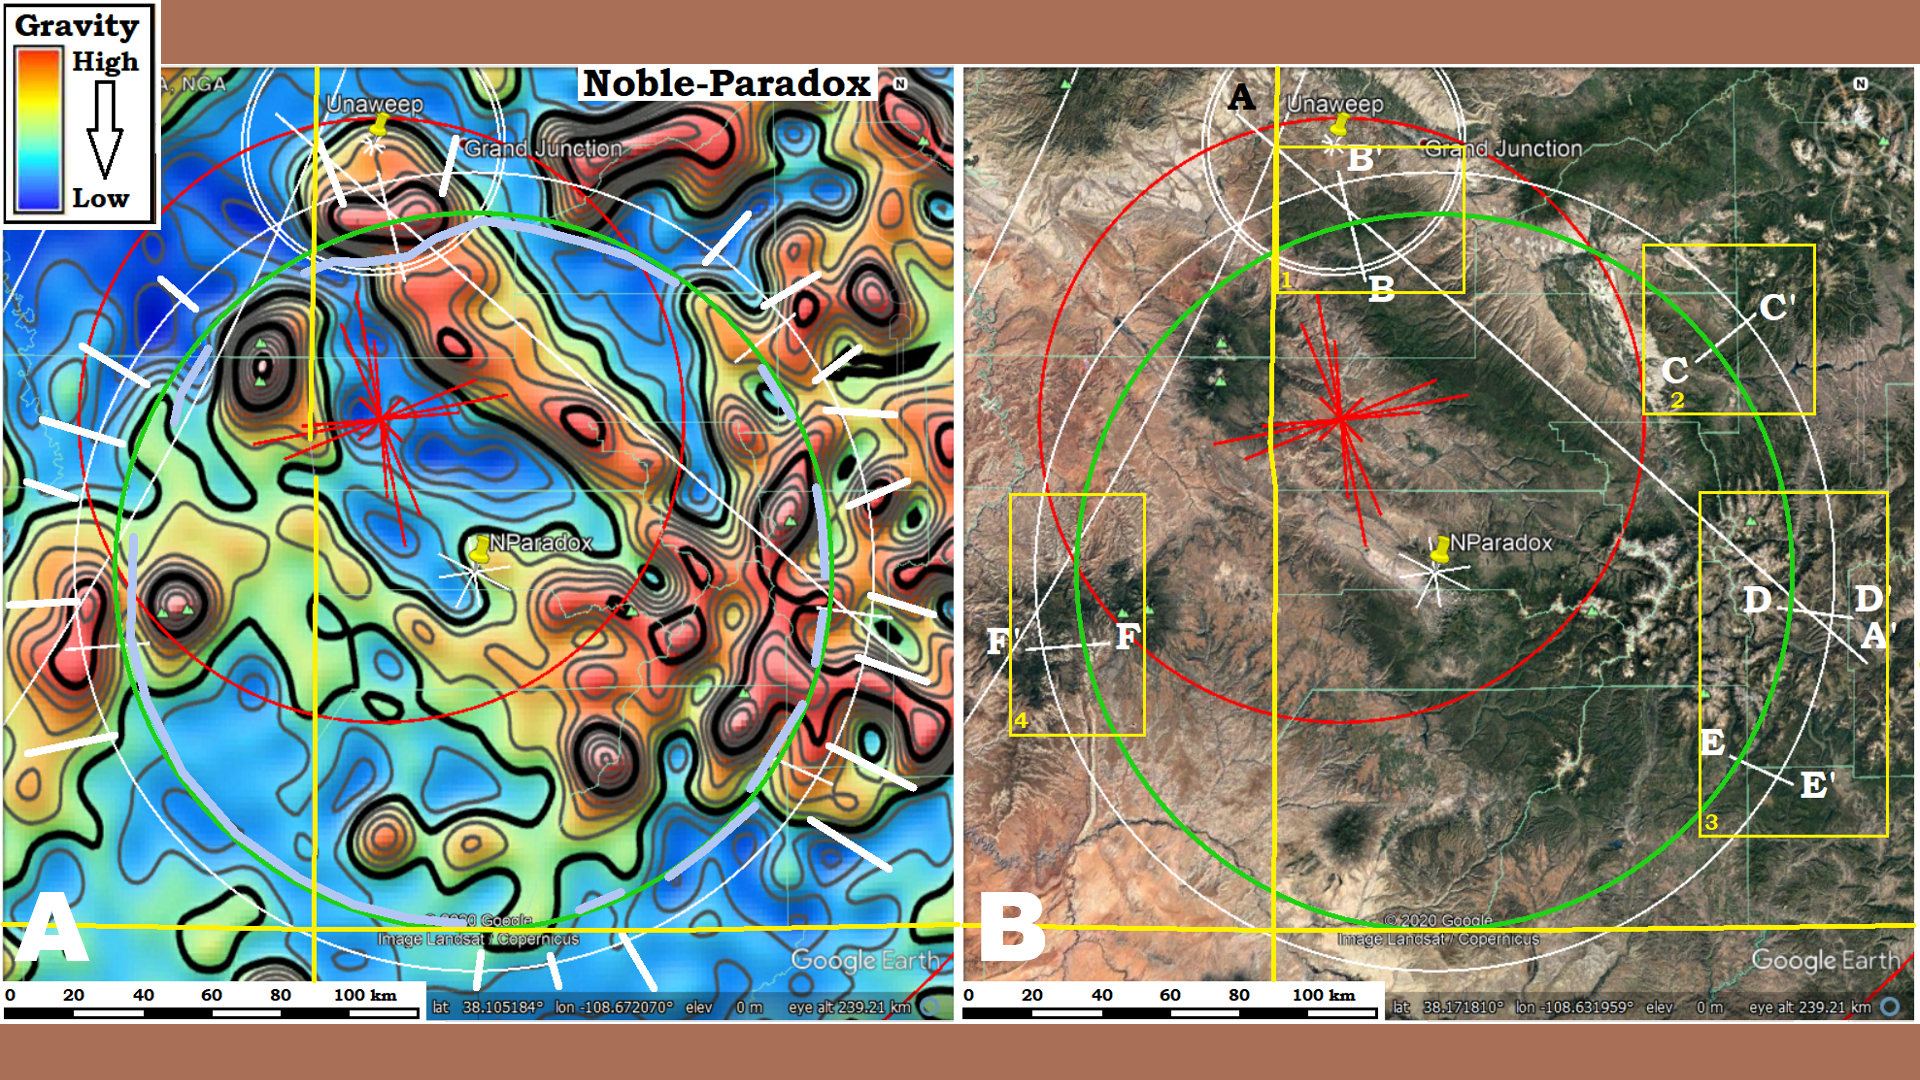 Figure 27: While we saw the Gulf of Mexico crater in Gravity maps and conformation in seismic sections and the lithology of well cores,, we want to see the smaller craters in gravity and topography. Everybody assumes earlier craters were hidden and obliterated by later cratering. This is only partly true. If we are looking carefully, many clues to the cratering history of an area can be plainly seen in topography as well as gravity, for the larger ones. The Noble-Paradox crater is a good example. Only about 120 km/75 mi diameter, the rings can be seen in image-A by points of change in the gravity measurements indicated by the inner end of the while lines. Pale blue sections on the green-ring indicates sections of lower gravity produced by the release-wave. In the topographic view, the rings are not nearly as visible, until be get down to the detail. A-A’ is the Irminger CGRS that defines the plateau, shown in Figure 25, but sections B-F are sections through low points on that release-wave where it had a good chance to leave an imprint.
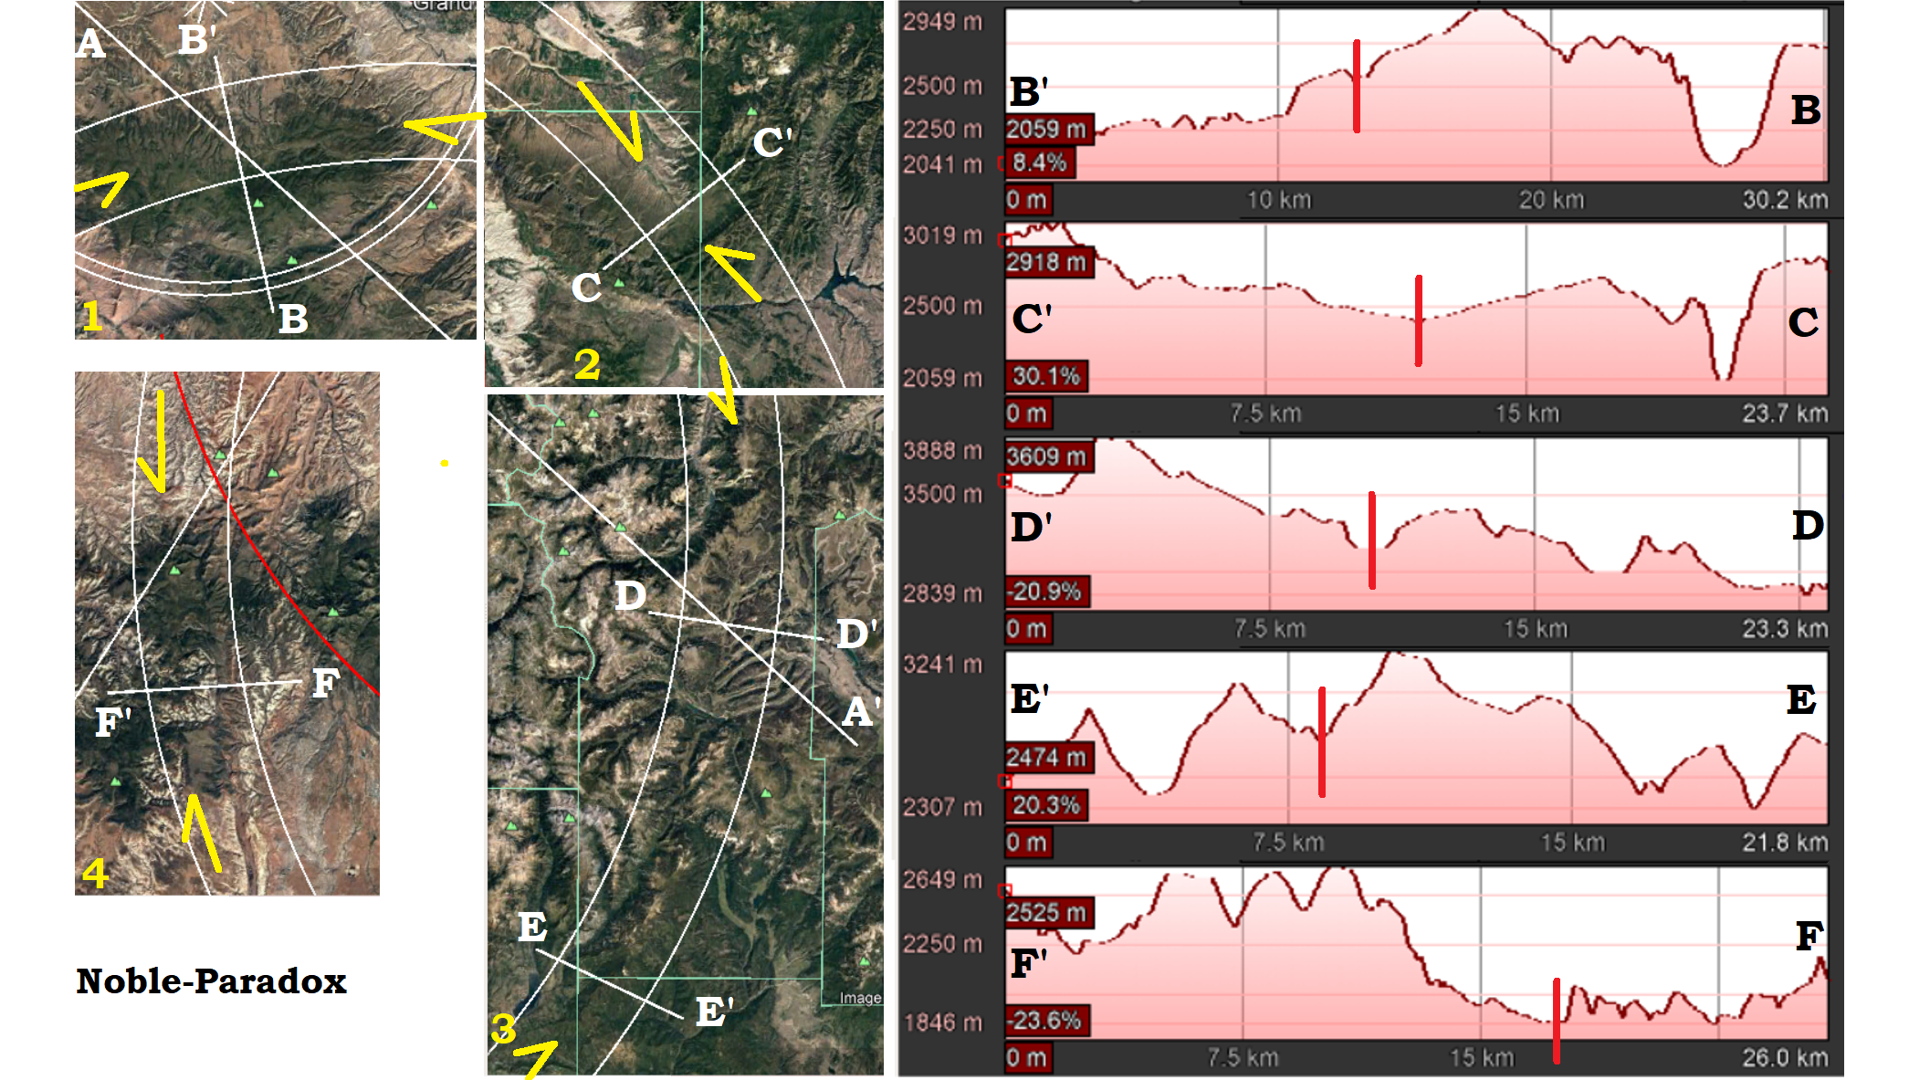 Figure 28: Looking at the four detail areas from Figure 27 a distinct line is seen in the topography between the two white rings and they all correlate to distinct troughs in the elevation profiles of the individual sections. Sections B and F that do not show the distinct lines, they still show the presence of a trough, though less distinct. No geologist would relate these different portions of a single ring trough if they had not first identified the ring of the crater, but now that it has been identified, it can not be unseen.
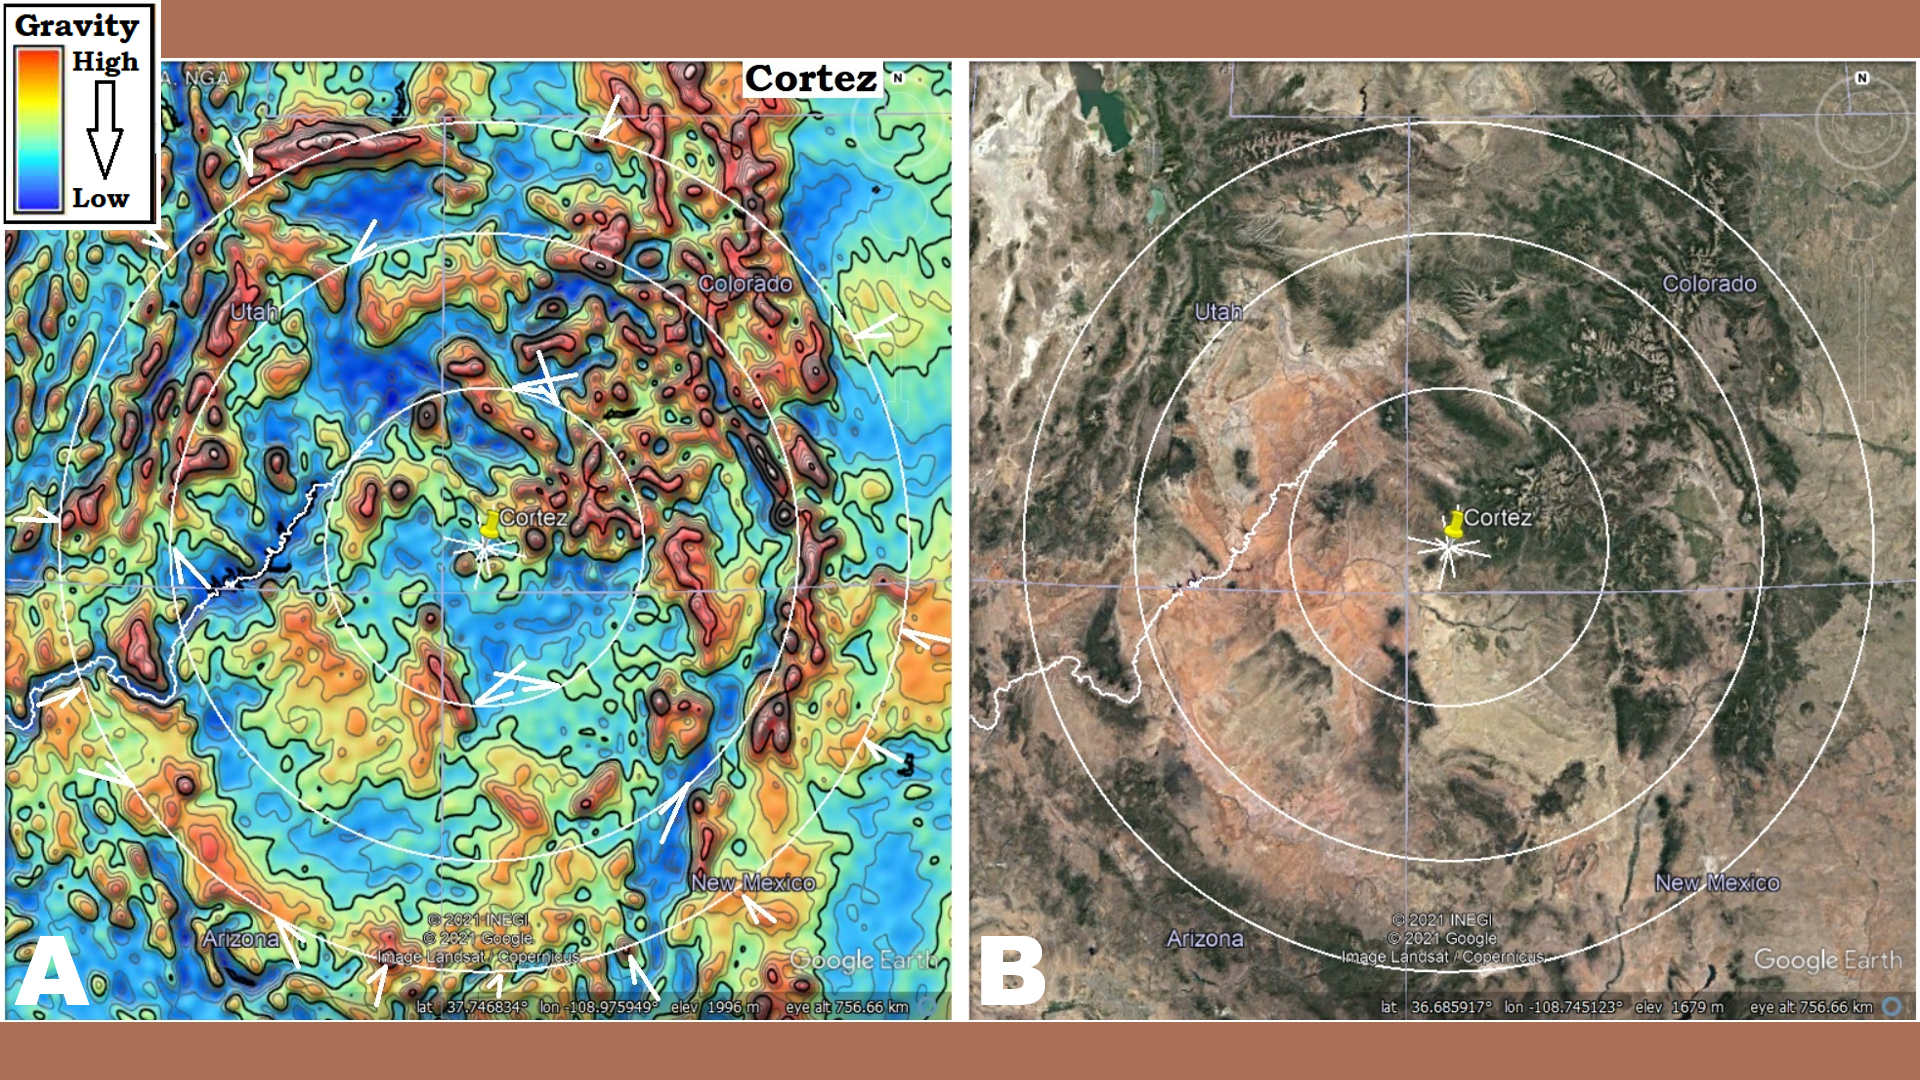 Figure 29: The Cortez is another crater that shows up in the same general area. Pairs of white arrows point to visible high gravity ridges of the rings. Open-ring = ~300 km/186 mi, OCR-ring = 580 km/360 mi, 2-ring = 800 km/500 mi diameter.
 Figure 30: An oblique view of the northern end of the Uncompahgre Plateau with a dark band corresponding roughly with the north side of the Unaweep Valley showing across the upper half of the image. Just below the middle, what looks like a flat topped hill with sloping sides can be seen. Image-B show circular lineaments of the Cortez crater correspond with many of the dark linears, as well as the location of the turner Gulch crater.
 Figure 31: If we look carefully other craters can be seen in the center of the same area. But, you say they are not obvious to you. Maybe that is because you have not looked for and located the details that make them visible.
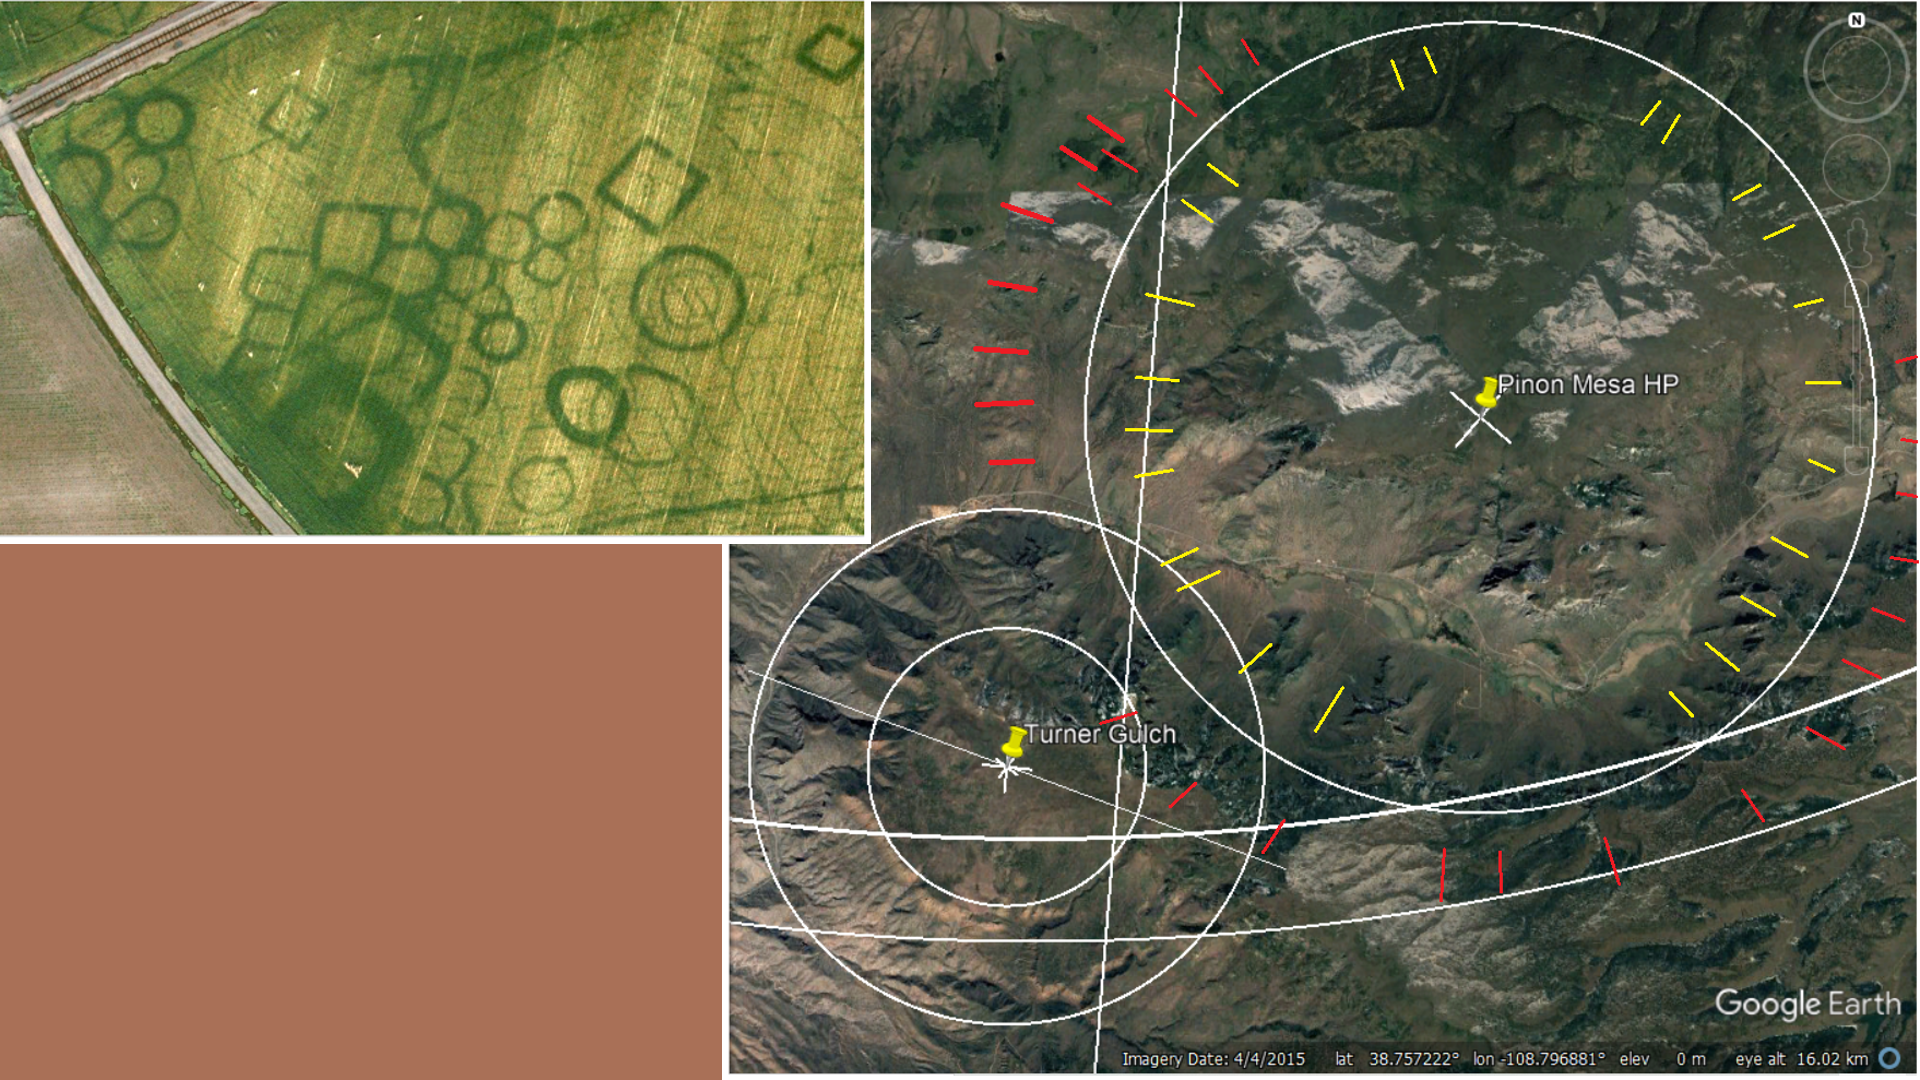 Figure 32: Crop-marks are a well-respected method for first identifying stone walls and fortification ditches under an agricultural field. These historic alterations in the landscape have caused conditions for greater or lesser plant growth or longevity that the archeologist can exploit to locate the historic traces. Similarly, subtle differences in density of the rock produced by the difference of expression between the compression of the shock-wave, and the resultant adiabatic dispersion within the release-wave, provide patterns that can be exploited in plant growth. Whether the circular ring under the white circle of the Pinon Mesa HP crater, indicated by the end of the red and yellow lines, is a ring of denser rock, or less dense rock? Whether it supports greater plant growth or is dark because it is barren? Or whether is has a mineral that restricts or encourages plant growth? These are all questions that need to be answered, but that the ring exist and has a probable connection to a shear point at its center seems obvious. I have given it a name for reference, and suggested it is most likely a small crater (not from the model used by NASA, but my understanding).
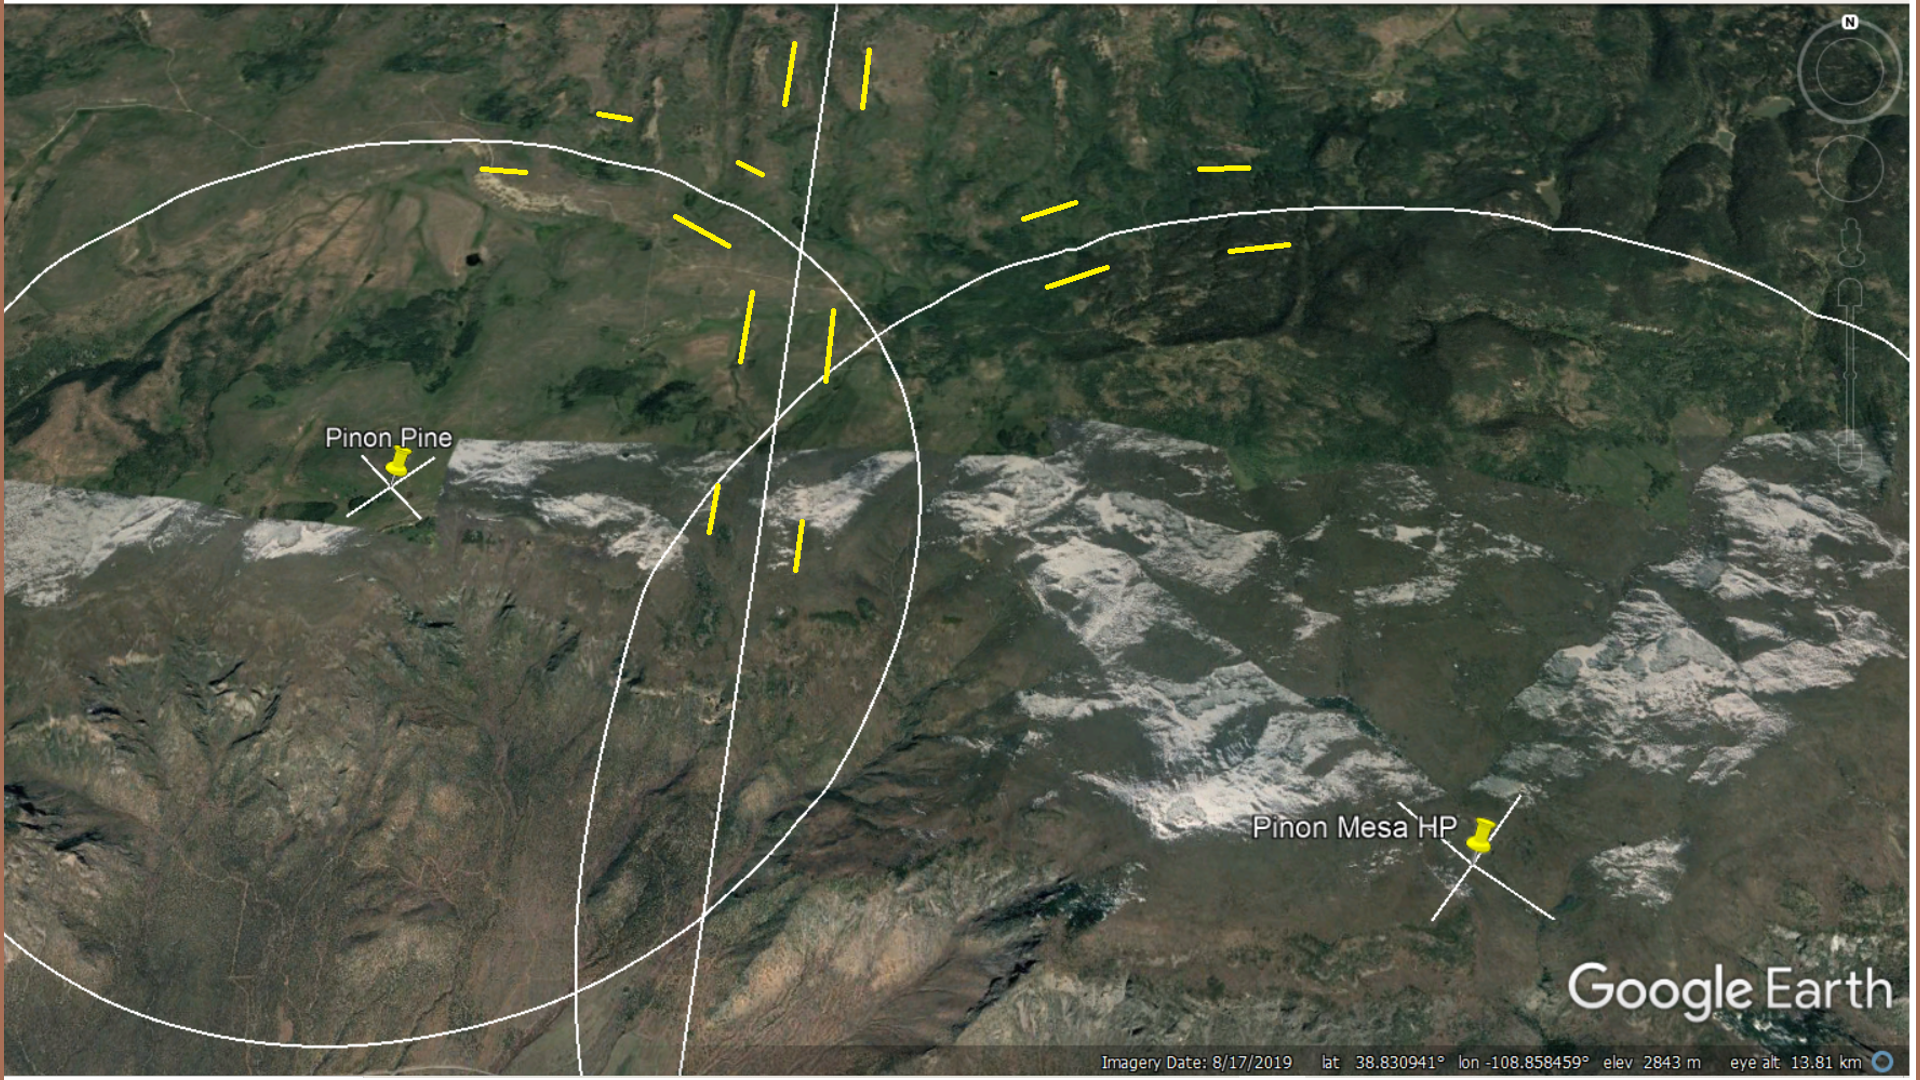 Figure 33: Yet these “crop-marks” are not unique to this single circular structure. The Pinon Pine circle to the west, and a line, which is a CGRS to the Ascension shear center in the South Atlantic Ocean, all left very visible crop-marks in the same area. Something was happening specifically in that area to encourage production of the tell-tell marks. I would propose the extra energy put into the plot of substrate by the Cortez and Payne crater, Figure 31, is certainly partially responsible.
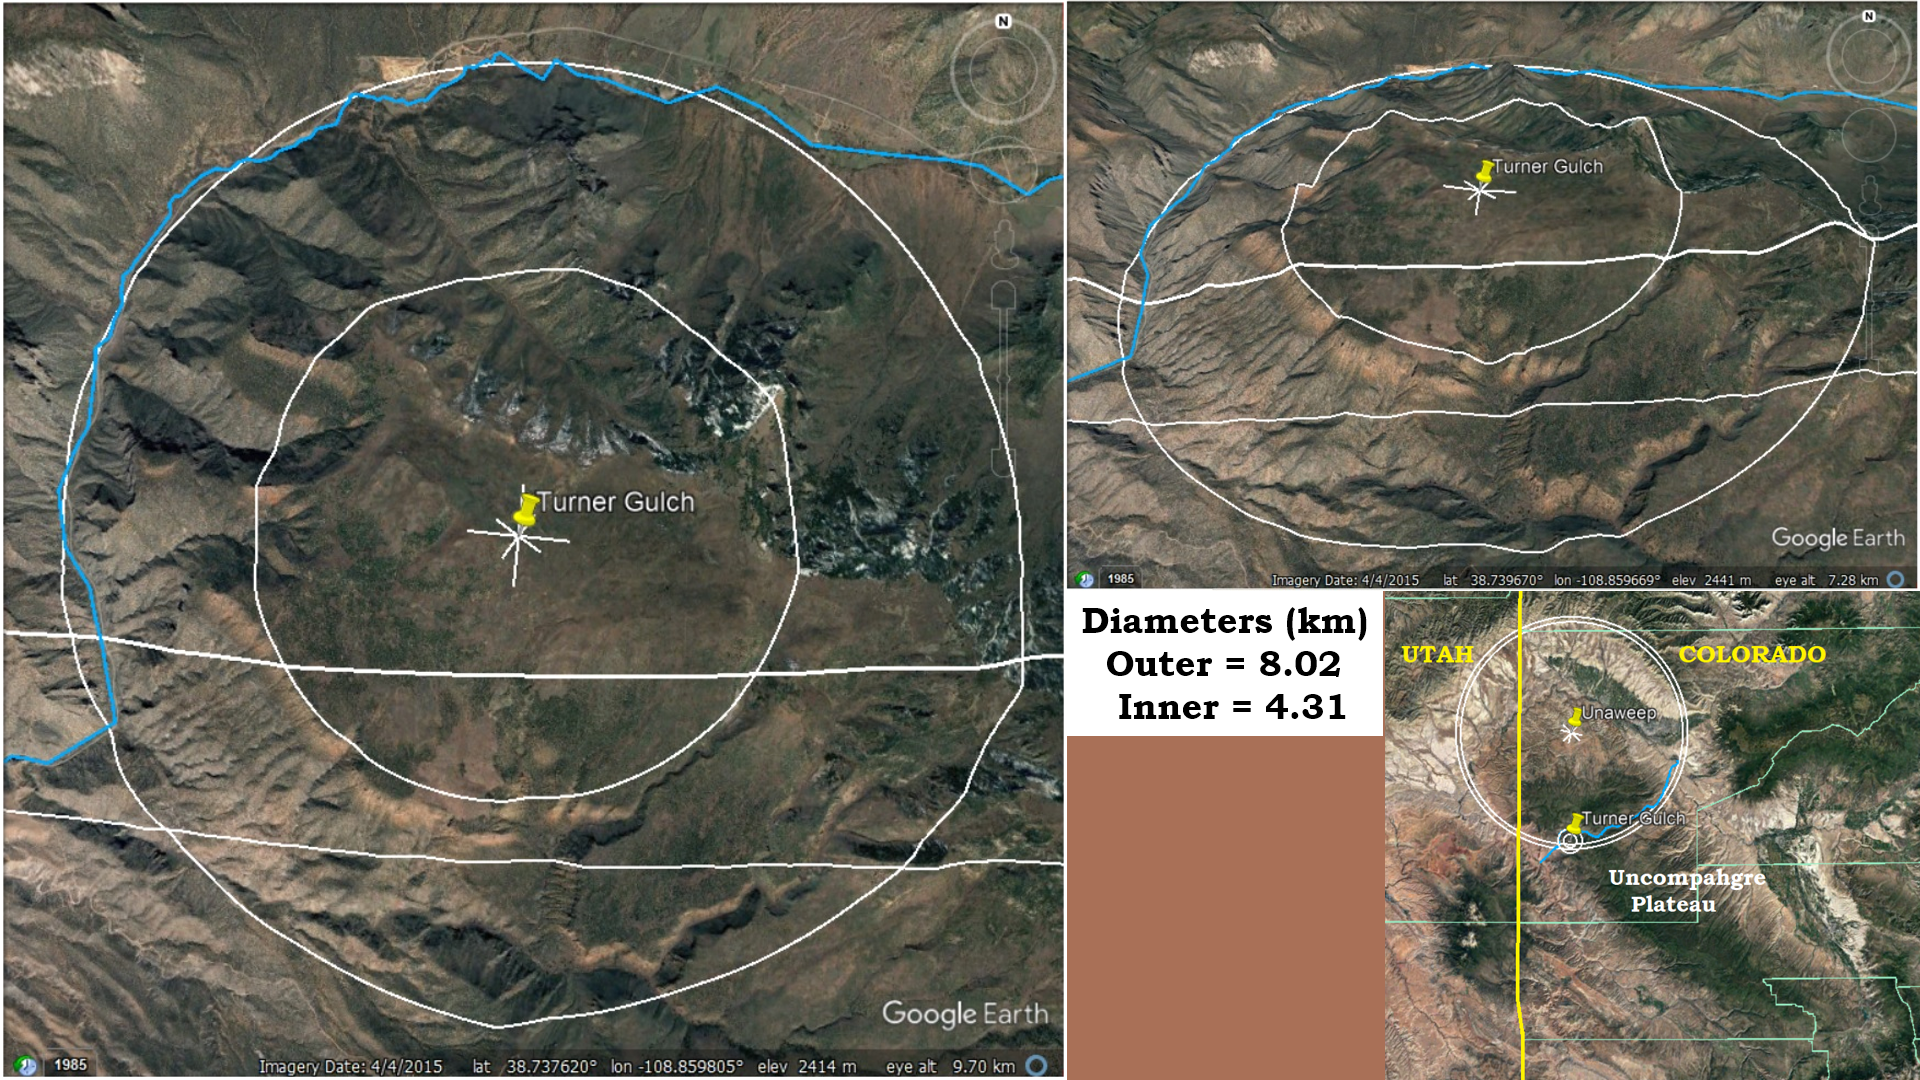 Figure 34: Many individual authors have speculated which river eroded the Unaweep valley across the northern end of the Uncompahgre Plateau. Chapter 1 in my book suggest the Unaweep crater’s release-valley was majorly responsible. That no river or flowing channel of water had anything to do with the erosion of the Unaweep Valley. This short slideshow has shown that once the Uncompahgre Crater had raised and isolated the Uncompahgre Plateau, several other craters, including the Cortez and Noble-Paradox craters, contributed to the total energy pattern expressed in the area of the Unaweep Valley. All of these craters are much larger than the Turner Gulch crater. The blue wiggly line is the path of the two shall creeks that presently flow from the center of the canyon to its ends. While the eastern half of the blue wiggly line conforms to the Unaweep crater’s release valley, with its white linear extension to the west indicated by the two parallel/concentric lines passing across the southern half of the Turner Gulch circles. But, the western end the Unaweep canyon does not conform to the rings of the Unaweep crater, but rather the much smaller outer ring of the Turner Gulch crater.
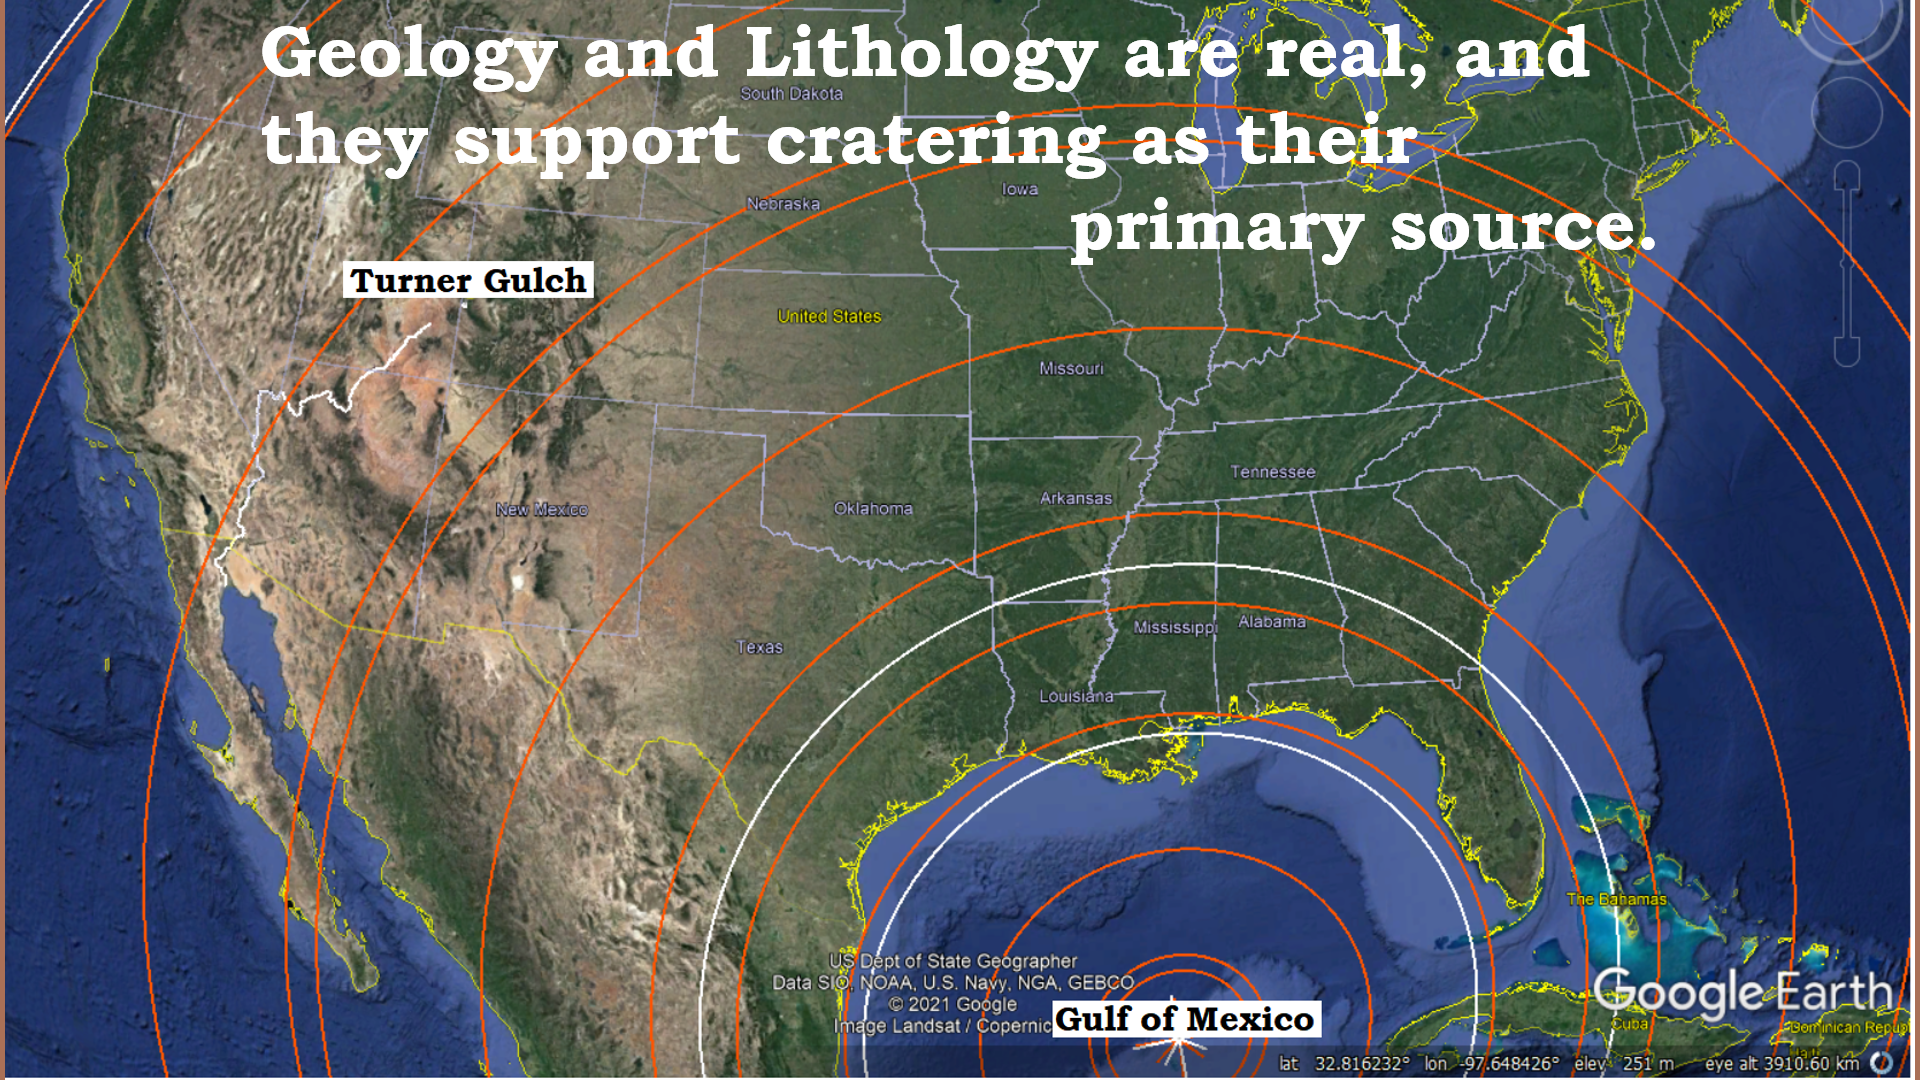 Figure 35: No matter whether the crater involved is as large as the Gulf of Mexico (4,550 km/2830 mi diameter) or as small as the Turner Gulch crater (8.02 km/5.0 mi diameter) when we understand the cratering behind the shear that produces the ridges and valley, the twist and turns of the mountains and river, we will start better understanding the lithology and all that it can help us understand about our Earth.